But a source with direct knowledge of the White House’s thinking told me Trump made his proclamation Thursday to meet a statutory 90-day deadline between the release of the Commerce Department’s findings in its Section 232 investigation. If Trump failed to acknowledge the conclusions of the probe within that three-month notice period, the source said, the president would lose the legal right to act on the findings. Instead, the proclamation represents what the source called “the minimum viable product” to maintain the option to impose tariffs based on the Commerce Department investigation at a later date. Trump followed a similar approach in July, when he declined to impose tariffs on imported aircraft parts despite the threat the administration warned the foreign dependence posed.
2. China is tightening its grip over global wind energy supply chains
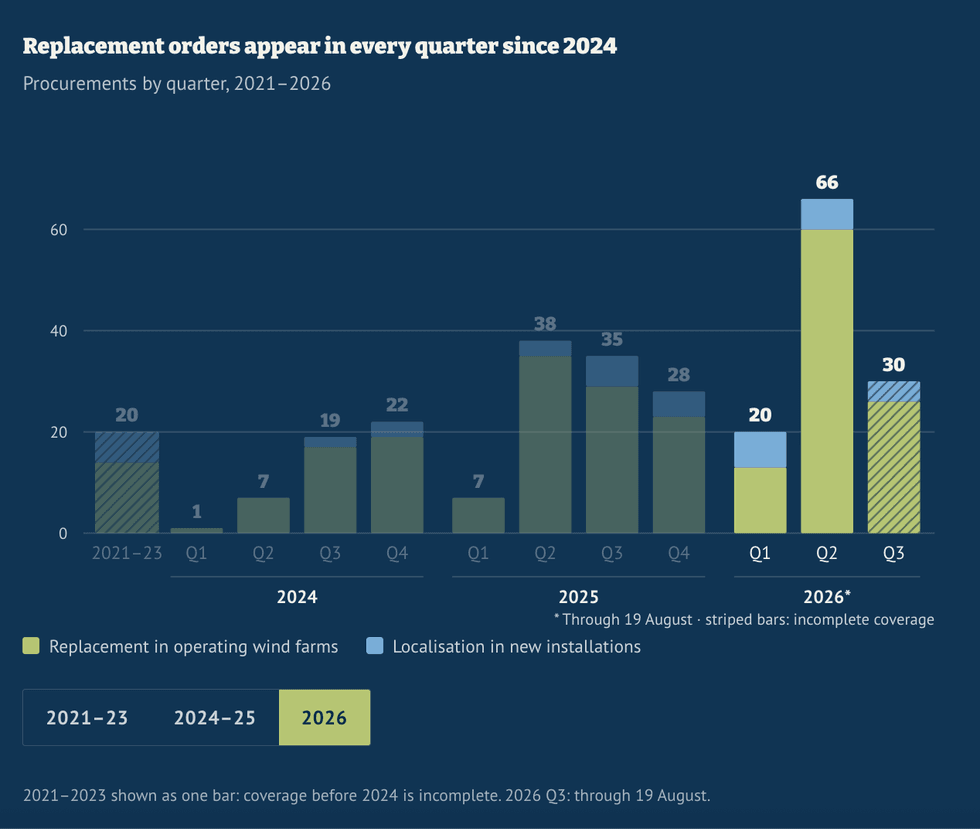
 The great localization push of 2026. OSW
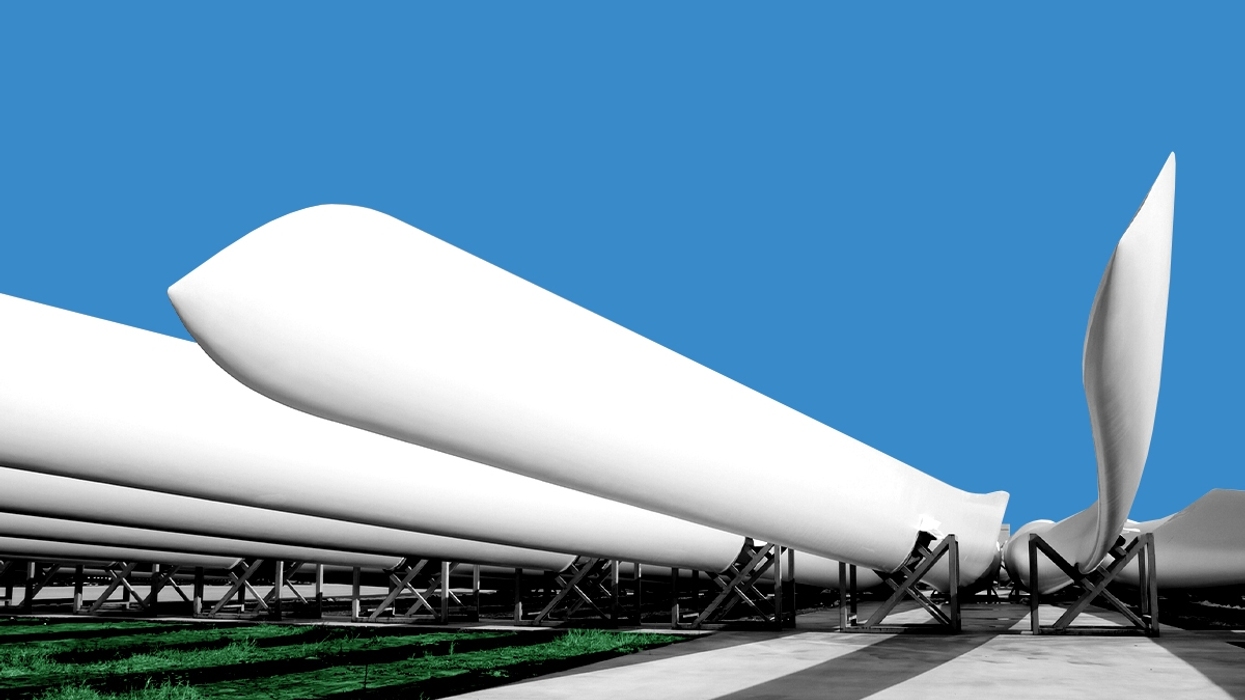
Chinese turbine companies already dominate the global wind industry. But as firms such as Goldwind and Mingyang Smart Energy make a push into the European market, where countries are increasingly building out turbines to ease demand for fossil fuels, Beijing is ordering its Chinese companies to stick to Chinese-made parts. Until now, Chinese turbine companies relied on components made in Europe and elsewhere. But an investigation published this week by Poland’s state-backed Ośrodek Studiów Wschodnich found that Chinese utilities are racing to replace foreign technology with domestic alternatives in hundreds of operating wind farms. The Warsaw-based think tank, known in English by the acronym OSW or as the Centre for Eastern Studies, analyzed 1,686 wind-sector procurement documents issued by Chinese utilities and their subsidiaries, “and found 293 that call for foreign technology to be replaced with Chinese alternatives, or impose domestic-localization requirements on new installations.” Of these, 251 covered replacements for wind farms that are currently online, and 42 imposed domestic requirements on new installations. That “localization drive,” OSW noted, includes grid equipment, solar panels, batteries, and coal-fired power plants.
The localization drive doesn’t stem from any one government mandate, “It works through a collection of opaque administrative measures, which is why procurement records are the place to uncover it,” OSW wrote. “But those records sit on fragmented platforms and older notices are often deleted, so what follows is the visible portion of something likely larger. Wind is also one area among many.” So, why focus on wind? “Europe has not yet decided how to treat Chinese suppliers in this sector,” the organization argued. “Chinese manufacturers are just beginning to establish a presence in the European market, while Europe is actively debating the conditions that should apply to their access. China’s treatment of foreign suppliers therefore has direct relevance for European debates over the future of the economic and trade relationship.” While Poland is internally divided in a culture war that many Americans would find recognizable, the country has long found unity in its skepticism of Europe’s embrace of Russian gas throughout the opening decades of this century. That proved to be keen foresight, as we all learned when Russian tanks rolled into Ukraine in 2022. So when a country that’s rapidly building out wind power both on and offshore raises concern over Beijing’s grip over a supply chain, it’s worth paying attention.
3. NRC gives a boost to reactor startups that win other agencies’ approval
Last year, the Department of Energy and the Department of Defense established new programs to help startups developing novel nuclear reactors build prototypes and run tests, with several companies splitting atoms for the first time earlier this year. Now the data collected from those trial runs can count on the companies’ formal applications for commercial licenses. On Thursday, the Nuclear Regulatory Commission finalized a rule allowing reactor developers who took part in those programs to apply their results, saving potentially millions of dollars by avoiding steps already approved by other federal experts. While the rule amends two of the main licensing pathways for reactors — known as Parts 50 and 53 — to allow information gathered at the Energy Department and the Pentagon to count, companies must “still demonstrate compliance with NRC requirements” and point out the differences between the demonstration project and a proposed commercial plant. Describing it as an “expedited path” for alumni of the other agencies’ programs, NRC Chairman Ho Nieh said “high-quality applications showing how DOE and DOW results apply to NRC requirements will help us review them more efficiently.” The move is part of a shift at the NRC that began before Trump returned to office. Former President Joe Biden signed the ADVANCE Act into law in 2024, explicitly directing the NRC to broaden its mission to include weighing both the risk of building nuclear reactors and not constructing them. Trump accelerated the change with executive orders calling on the NRC to speed up approvals for new reactors. He also tightened his control over the agency by successfully challenging the traditional interpretation of the agency’s independence to mean that presidents can appoint new commissioners but not fire existing ones in the middle of their terms.
Finland, meanwhile, just permitted the world’s first permanent repository for nuclear waste. I visited the facility in western Finland, known as Onkalo, back in 2022. Dug more than 1,300 feet into the bedrock that geologists say hasn’t moved in billions of years, the site has already inspired Sweden and Canada to pursue similar projects. The U.S., on the other hand, is moving away from its long stalled plan to bury nuclear waste in Nevada’s Yucca Mountain. Instead, it’s embracing technology to reprocess spent fuel into fresh fuel. That isn’t to say there aren’t some key links between nuclear industries on opposite sides of the Atlantic. A subsidiary of Canada’s Ontario Power Generation, the state-owned utility in the country’s most populous province that’s building the first small modular reactor in North America, just inked a deal to develop that same technology in the United Kingdom, World Nuclear News reported. All good news for Arnold Schwarzenegger. The former California governor and clean energy advocate told the Financial Times on Thursday that he wants more nuclear power to “terminate pollution.”
Sign up to receive Heatmap AM in your inbox every morning:
4. The data center boom is taxing an already stressed mineral supply
Copper is hitting record highs as the U.S. stockpiles the metal and Chile’s mine output contracts. Aluminum is dealing with the shock of the Iran War shutting down a key smelter. Nickel is facing new export restrictions from Indonesia, the world’s top supplier. The lithium shortage is driving demand for hundreds of billions in new investment. That’s the backdrop of the global mineral market right as the artificial intelligence boom is adding new demand, according to a report the consultancy Wood Mackenzie published Thursday. “Data centers represent an economy-wide power infrastructure challenge, but the bigger story is the collision between accelerating demand and increasingly complex supply delivery,” Lindsay Grant, Wood Mackenzie’s vice president of metals and mining research, said in the report. “High prices should trigger investment, yet project sanctioning remains below expectations. Without faster approvals and investment commitments, the industry cannot deliver the mine supply needed to support future growth.”
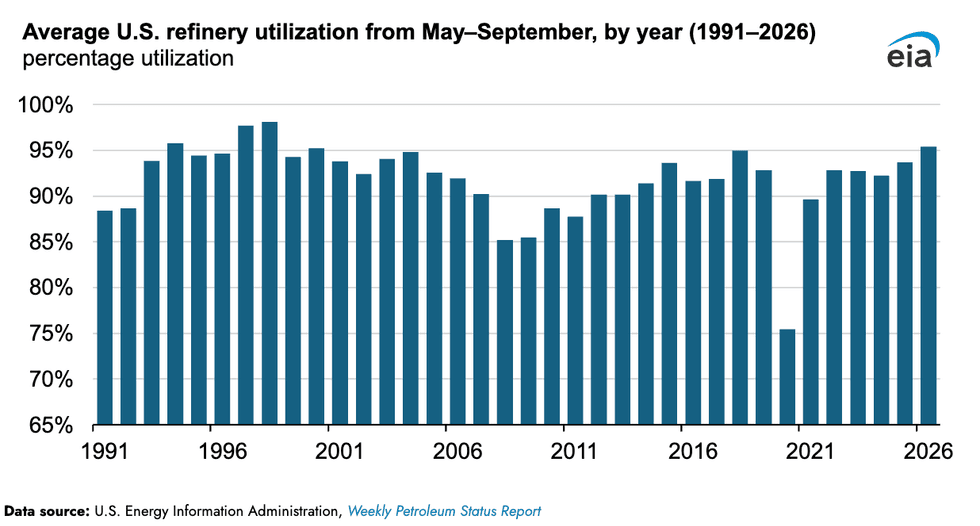
 The 1990s are back. EIA
Market chaos is driving long- and short-term shortages abound. U.S. refineries are working overtime to meet soaring gas prices. The facilities averaged more than 95% of capacity from May to September, the highest output for those months since 1998, according to an analysis the U.S. Energy Information Administration published Thursday. During a speech in Iowa on Thursday night, Trump said he would direct $150 million in Defense Production Act money toward beefing up refineries further.
5. Commerce Department invests in Helion, taking an equity stake in the Trump-linked fusion startup
The Commerce Department is investing $175 million into the fusion startup Helion. The company — which the Financial Times described as a “speculative” venture backed by Josh Kushner, the brother of Trump’s son-in-law; conservative tech billionaire Peter Thiel; and OpenAI founder Sam Altman — will receive the funding from a pool of money the agency had leftover from the CHIPS Act. In exchange, the U.S. government will take an equivalent non-voting equity stake. The deal marks the Commerce Department’s largest commitment yet to a single company in the sector.
The Israeli government, meanwhile, is looking to ramp up its investments into fusion. On Thursday, Israel’s Ministry of Energy and Infrastructure published what The Jerusalem Post described as a strategic report detailing the opportunity to invest now in a fusion market that could be worth hundreds of billions of dollars in the coming decades. Israel has long eschewed fission energy, as establishing a traditional civilian nuclear program would invite the International Atomic Energy Agency’s scrutiny of the country’s nuclear weapons arsenal, which Jerusalem has long refused to confirm. But the decision by U.S. regulators to treat fusion reactors like research and medical reactors rather than fission power plants could set the stage for laxer global oversight of the technology in the future.
THE KICKER
With war tragically raging on between Israel and the Iran-backed Hezbollah militia in Lebanon’s south, financing utility-scale solar and wind projects has proven difficult. The first large solar farm is poised to begin construction before the end of the year. But Lebanon’s small-scale distributed solar is booming. In 2020, Renewables Now reported, the country had less than 100 megawatts of peak solar generating capacity installed. Now that figure has risen to 1.5 gigawatts, the Lebanese Center for Energy Conservation told the trade publication. Even before the war, Lebanon’s grid repeatedly failed, spurring Lebanese to install more rooftop solar panels and batteries to keep the lights on.





 The great localization push of 2026. OSW
  The 1990s are back. EIA