The problem is not a lack of startups or capital. European firms raised $61 billion for climate-focused funds last year, far outpacing those in the U.S., which brought in $37 billion, according to Sightline Climate. The problem is that almost all of that European money flows to infrastructure and private equity investors backing more mature technologies. Early-stage startups also enjoy relatively strong backing, but the market starves the growth-stage middle.
The issue is both cultural and structural: Most of the bloc’s investors are unaccustomed to making the high-risk, high-reward bets required to scale climate tech. They also often can’t access tools like loan and equity guarantees, which remain limited in Europe, nor are there the institutional limited partners and growth-stage co-investors that could help de-risk those investments.
“It’s got nothing to do with technology. It’s nothing to do with execution capability. It’s purely due to access to capital,” Craig Douglas, a founding partner at the Berlin-based multi-stage venture firm World Fund, told me. That means companies that have outgrown early-stage financing but are still considered too small or too risky for larger institutional investors often either shutter or seek capital abroad. Logically, if given the chance, most startups choose the latter.
“You’re allowing U.S. investors to cherry pick European assets,” Douglas told me. The result? “European technologies and European companies that are successful end up enriching American pension funds rather than European pension funds.”
Ioannis Ioannou, an associate professor of strategy and entrepreneurship at the London Business School, told me that the consequences extend beyond the purely financial, emphasizing that Europe runs a strategic risk by relying on foreign capital for its climate tech scale-up. “It means you lose the supply chains. You lose the skills. You lose the fine manufacturing capabilities. You lose the so-called green jobs.”
Douglas and the other specialists in European climate finance I spoke with emphasized that the ever-ominous “missing middle” funding gap is particularly pronounced in Europe. A report Douglas co-authored earlier this year, aptly titled “The Series B Funding Gap In European Climate Tech,” quantifies the problem. While 25% of U.S. climate tech companies that raised a seed round from 2010 to 2020 had moved on to secure a Series B by the first half of last year — regardless of what country the capital came from — only 15% of European companies were able to do the same. That has created a growing backlog of startups stuck in a financing limbo: The lineup of European companies looking to raise a Series B grew from 220 in 2020 to 533 in the first half of last year.
While smaller climate tech funds in Europe and the U.S. have raised similar amounts of funding for early-stage startups — $18.5 billion in Europe versus $20.2 billion in the U.S. from 2020 through the first half of 2025 — the gap at the larger end of the market is stark. The U.S closed 29 funds of at least $500 million or more, compared with just 11 in Europe. These larger funds are the ones capable of writing the $25 million to $100 million checks companies desperately need to commercialize and scale. As Douglas’ report notes, fewer than 20% of European climate funds are pursuing a growth strategy, with over 70% making early-stage investments only.
“When we raised World Fund One, we were the largest [debut] climate fund in Europe, and we’re a €300 million fund. That’s nuts,” Douglas told me. World Fund aims to help companies “reach growth-investor readiness” by supporting startups from their seed through Series B, a model Douglas would like to see replicated throughout the region. “We need another 20 World Funds out there in the market to start filling this capital shortfall,” he told me. The firm announced last February that it’s raising a second, €500 million fund, but that’s yet to close.
One of the primary reasons European growth-stage investors have less capital to deploy comes down to the structure of European financial markets, which remain heavily reliant on bank lending rather than higher-risk equity investments. As a result, institutional investors like pension funds, insurers, and endowments never built the habit of investing in venture capital, which shows up when comparing the LP bases across the two regions: In the U.S., about 72% of VC funding comes from private institutional investors, compared with just 30% in Europe. Public money, much of it from the European Investment Fund, helps bridge the gap, but it simply cannot match the scale of private institutions.
Pension funds are a telling case. They’re among the largest sources of venture capital in the U.S., allocating nearly 2% of their assets to VC. But in the EU, they allot just 0.018% — roughly 100 times less. And because the U.S. also has far more money sitting in pension funds than Europe does, this makes the gap in actual dollars reaching startups wider still. Without that deep pool of institutional funding, Europe struggles to support the $500 million- to $1 billion-plus funds that would have the wherewithal to lead growth-stage rounds.
The result is a self-reinforcing cycle. Large growth funds require large institutional backers, but precisely because European pension funds and other institutional investors haven’t stepped up, the venture market remains too small to absorb the kinds of $100 million-plus commitments pension investors managing billions of dollars typically want to make. “They don’t see [venture] as an asset class that they can invest in,” Douglas told me. “But the reason that it doesn’t exist is because they’re not investing themselves in that asset class.”
If there’s one thing I learned from my reporting, it’s that white these problems run deep, Europe is hardly standing still. Policymakers and investors are well aware of the disconnect and are now experimenting with strategies to close the scale-up gap and affirm the region’s position as a leader in climate innovation.
To attract more institutional investment, for example, a growing number of initiatives aim to create “funds of funds” and other government-backed structures that pool money from pension funds, insurers, banks, foundations, and other large investors. The fund-of-funds structure lets an institution make a single, large commitment; then, intermediary asset managers break that capital into smaller chunks and invest it across multiple venture funds. This gives large-ticket investors the scale and diversification they want without requiring them to conduct due diligence on dozens of small venture funds; venture managers, in turn, gain access to much larger pools of capital.
Germany’s Wachstumsfonds Deutschland, for example, is a €1 billion fund-of-funds backed by more than 20 investors — including insurers, pension funds, and large family offices — that invests across the German and broader European VC ecosystem, with a focus on growth-stage capital. The EU’s European Tech Champions Initiative follows a similar model. The European Investment Bank and six member-states launched the initiative in 2023 with €3.9 billion to back regional growth-stage VC funds. Now it’s raising a second tranche of money — targeting €15 billion — and is bringing in private institutional capital for the first time.
Europe’s member states have also pushed institutional investors toward coordinated capital commitments in recent years, with France’s Tibi initiative serving as the model. Launched in 2019, it tasks the French government with vetting venture and growth funds, with those that qualify becoming eligible for backing from initiative’s signatories, primarily insurers and some pension funds. The program has attracted about €31 billion in commitments to date. Germany adopted a similar approach with its WIN initiative, which has now secured €12 billion in pledges from more than 30 major corporations — including Deutsche Bank, BlackRock, and Henkel — to invest in the country’s venture ecosystem by 2030.
The Irish Venture Capital Association has proposed a similar model, while Tibi’s founder — the economist Philippe Tibi himself — has been on a tour essentially pitching the idea across the bloc. But Ioannou isn’t convinced that creating country-specific Tibi-style commitments is the most efficient way for the region to scale climate tech.
“I’m not sure that fragmentation will actually solve the problem,” he told me. “Maybe it will be better if all that capital came into one larger fund, whereby the scale-ups wouldn’t have to deal with country level fragmentation, regulations, jurisdictions, legal, and all that kind of stuff.”
That’s the idea behind the new €5 billion pan-EU Scaleup Europe Fund, which is designed to invest directly in European deep-tech startups — climate tech very much included — rather than through venture funds. Announced last year, the fund has already secured roughly €2.5 billion in capital commitments from both the European Commission and private institutional investors, with a second fundraising round planned for the second half of this year. EQT, Europe’s largest private-markets investor, will manage the funds, ultimately deciding which growth-stage companies to back.
“Everything happened so quickly, from agreeing to it to executing on it to allocating it,” Douglas told me. “In effect, it happened in less than a year, which in the European context is crazy.”
The idea is to replicate what the combination of U.S. federal support and deep private capital markets has accomplished, Dimitri Colin, a policy officer at the cleantech policy and advocacy group Cleantech for Europe, told me. “The whole idea is to bring what worked in the U.S. into European public financing policies,” he said. Colin extolled the virtues of the Biden-era Loan Programs Office, as well as the efficacy of other Inflation Reduction Act-fueled efforts such as generous production tax credits when it comes to derisking investment in first-of-a-kind tech.
In our interview as well as in a recent report, Colin argued that EU funding should move from prioritizing grants to loan and equity guarantees in its forthcoming budget for the years 2028 through 2034. That’s because guarantees have proven far more effective than government grants at bringing private investors into climate tech, Colin told me. According to his report, every euro of grants or equity capital channeled through the VC arm of the European Innovation Council yields about €3 in additional investment. That’s nothing to scoff at, but it pales in comparison with InvestEU, the bloc’s €26.2 billion investment guarantee program. Every euro of guarantees from the latter attracts nearly €14.80 in private follow-on capital.
“The main idea behind the whole budget should be to focus on the leverage effect,” Colin told me, referring to how much additional private funding government backing generates. “How can the little public money that we have in Europe — because the fiscal environment is, of course, very constrained — more easily mobilize private money? That’s what the LPO did well.”
Colin also wants to change the EU’s public funding rules to make it easier to subsidize ongoing operational expenses for early-stage cleantech facilities, similar in effect to U.S. production tax credits. Currently, European policymakers often structure public support for these projects as capex grants paid out after construction is complete. This type of support is more difficult for private investors to underwrite since it doesn’t directly improve the plant’s ongoing operating economics, one of the risks investors care about most.
Getting these financing structures right is a matter of life or death for many of Europe’s most promising climate tech industries. Douglas points to batteries, critical minerals, semiconductors, and green molecules as sectors with the technological readiness to scale domestically — but not yet the capital. “One of the major risks in every sector we know is who’s going to be there, who’s going to be able to go with us on that journey to make sure the company has the capital to be successful,” he told me. Still, he sees reason for optimism. Because if there’s one thing that can be said about the E.U. at this moment, it’s that “they’re definitely taking it seriously.”
“The perfect solution doesn’t exist,” Colin told me. “We need to align the funding models, we need public de-risking tools, but we need also a true industrial strategy, China has done that, the US has done that with the IRA,” he explained. Now it’s Europe’s turn.


 DOE
DOE Google Earth
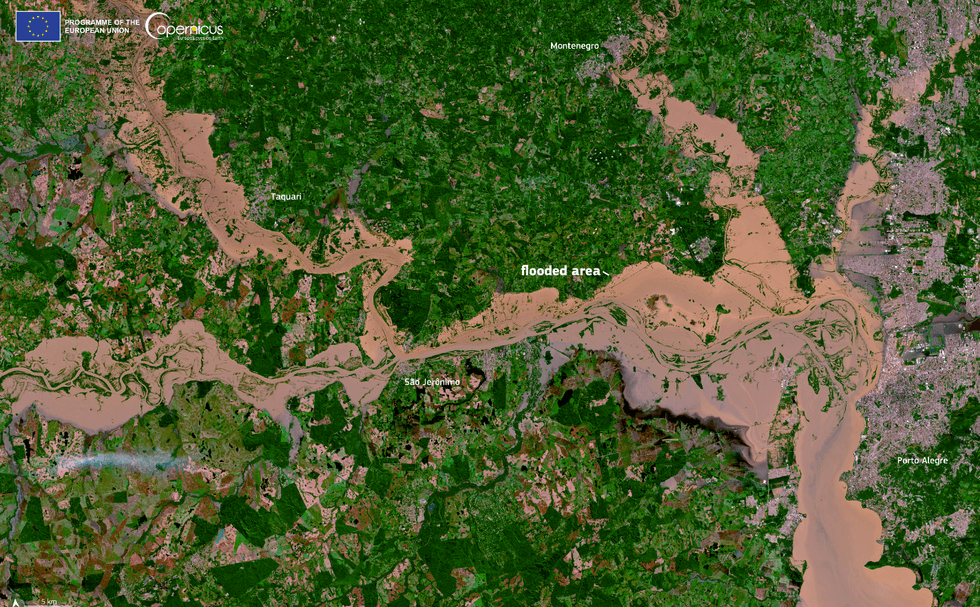 European Union, Copernicus Sentinel-2 imagery