You’re out of free articles.
Log in
To continue reading, log in to your account.
Create a Free Account
To unlock more free articles, please create a free account.
Sign In or Create an Account.
By continuing, you agree to the Terms of Service and acknowledge our Privacy Policy
Welcome to Heatmap
Thank you for registering with Heatmap. Climate change is one of the greatest challenges of our lives, a force reshaping our economy, our politics, and our culture. We hope to be your trusted, friendly, and insightful guide to that transformation. Please enjoy your free articles. You can check your profile here .
subscribe to get Unlimited access
Offer for a Heatmap News Unlimited Access subscription; please note that your subscription will renew automatically unless you cancel prior to renewal. Cancellation takes effect at the end of your current billing period. We will let you know in advance of any price changes. Taxes may apply. Offer terms are subject to change.
Subscribe to get unlimited Access
Hey, you are out of free articles but you are only a few clicks away from full access. Subscribe below and take advantage of our introductory offer.
subscribe to get Unlimited access
Offer for a Heatmap News Unlimited Access subscription; please note that your subscription will renew automatically unless you cancel prior to renewal. Cancellation takes effect at the end of your current billing period. We will let you know in advance of any price changes. Taxes may apply. Offer terms are subject to change.
Create Your Account
Please Enter Your Password
Forgot your password?
Please enter the email address you use for your account so we can send you a link to reset your password:
The state has made itself into a model of relief policy for manufactured homeowners.
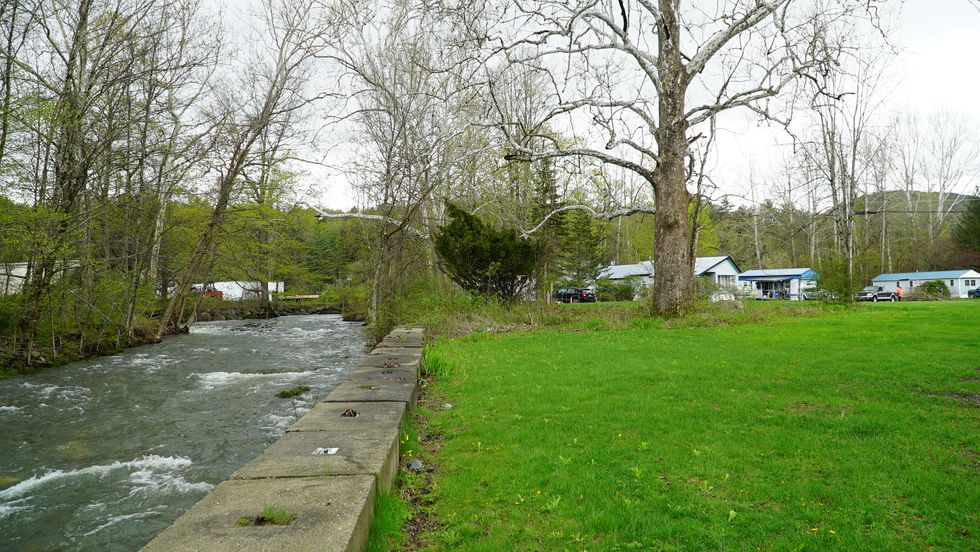
There’s a brook that runs along the Mountain Home Park in Brattleboro, Vermont, providing the sort of pleasant babbling sound people play at night to help them fall asleep. On a typical morning, the water moves quickly and is shallow enough that you can see the rocks under the surface.
But when a storm comes through, long-time resident Angela Johnson warns, this steady stream can turn treacherous.
“We watch it every day when it’s raining — it doesn’t matter if it’s a heavy storm, the brook rises quite quickly,” Johnson told me. “It has and it will continue to break out of its space and cause flooding.”
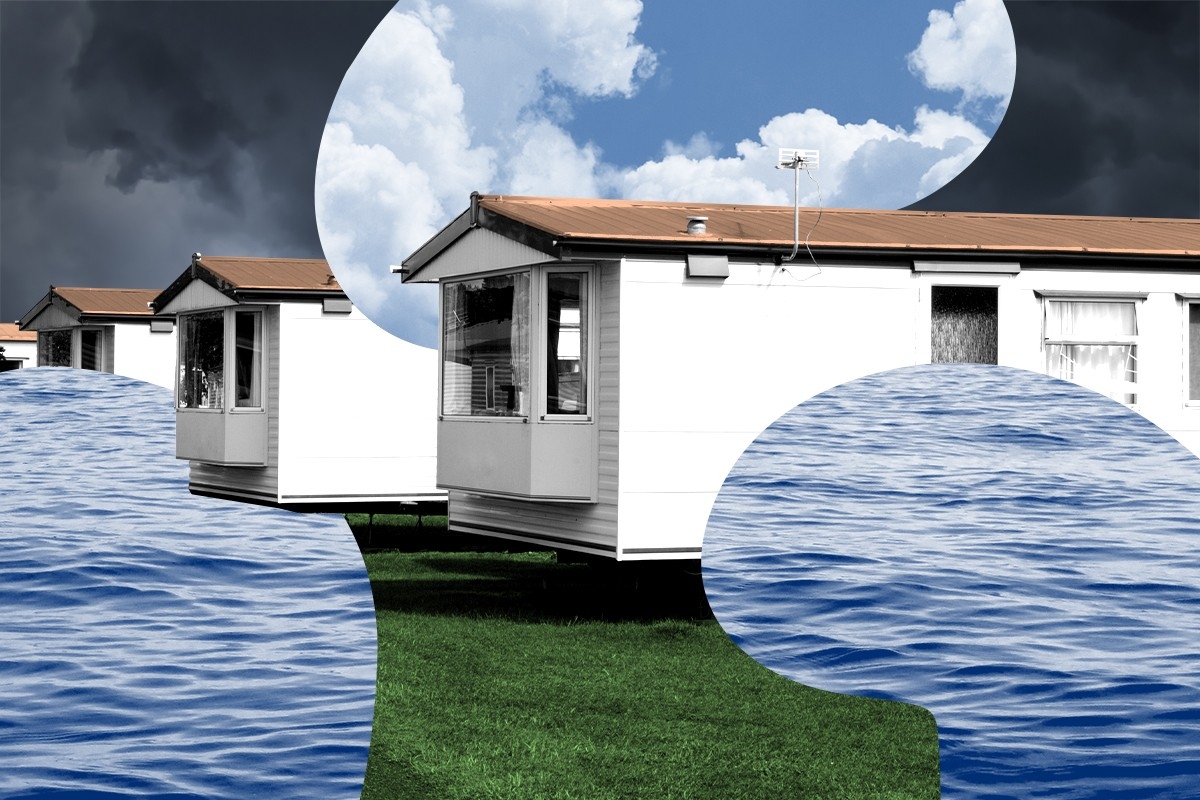
That’s what happened four years ago, when an ice jam caused the brook to burst, flooding into the houses in the low-lying surrounding area. Or during Tropical Storm Irene in 2011, which destroyed 29 homes in the greater Tri-Park Housing Cooperative, of which Mountain Home is a member. The rushing water lifted some structures right off their foundations, damaged roadways, and left a trail of debris, photos, and furniture among the wreckage in its wake.
Manufactured homes (which the state of Vermont uses interchangeably with mobile homes, though that term that refers only to models made before 1976) were disproportionately impacted during Irene, making up 7% of the state’s housing stock but 15% of housing damaged during the storm. Across the U.S., one of seven manufactured homes is in a neighborhood with high flood risk, according to a Headwaters Economics analysis, a figure that is only expected to rise due to climate change.
Vermont has recognized this risk, making changes at the state, local, and community levels that have earned it national recognition as a model for mitigating flood risk in these particularly vulnerable neighborhoods. To better understand what some of these strategies looked like, I went to Vermont earlier this year and met with residents, officials, and researchers who shared their experiences working or living — or both — in manufactured home parks.
Or rather, I tried to. On my first attempt to visit, I made it about 45 minutes into my four-hour drive before I had to turn around due to flooding, an irony that was certainly not lost on me. When I finally made it up to Tri-Park the next day, there was still water pooled in front of homes and alongside the road, hinting at the areas that might be particularly vulnerable to the next storm.
Mountain Home Brook.Colleen Hagerty
Weeks later, Vermont was in the headlines for flooding once again. An unnamed storm drenched the state in July, causing “catastrophic” impacts and earning quick comparisons to Tropical Storm Irene. More than 2,900 homes were damaged across the state, hundreds of them significantly, including dozens of manufactured homes. “Flooding had outsized impact on 4 Vermont mobile home communities,” announced the headline from one local news organization, which placed the loss at more than 60 manufactured homes.
So, did any of the changes implemented after Irene make a difference? It’s a tricky question, said Kelly Hamshaw, a researcher with the University of Vermont. She’s been visiting and interviewing residents in manufactured housing communities since 2011 and is currently working to identify needs in areas impacted by this summer’s storm.
For starters, the flooding footprints of the two storms were different, meaning those hardest-hit by one were not necessarily as impacted by the other. The flooded areas are still in the early stages of recovery, so it’s difficult to step back and make clear comparisons. Other less visible interventions, though, have certainly paid off, she told me.
Take accessing aid — researchers say the specific needs of manufactured homeowners are often overlooked in laws dealing with flood damage. Typically, owners of manufactured homes buy the structure they live in but not the land beneath it, which they rent from a distinct owner or corporation. Since most government assistance is aimed at either single-family homeowners or renters, Headwaters Economics research found that manufactured homeowners are “more likely to face barriers in accessing federal and state assistance, more likely to experience long-term recovery problems, and more likely to be permanently displaced.”
In the aftermath of Irene, for instance, most damaged manufactured homes had to be condemned to receive a full payout from the Federal Emergency Management Agency; those payouts often amounted to less than the value of the homes and left their owners without anywhere to live. Other types of homes did not require condemnation for their owners to receive that full payout.
This was a discrepancy the state recognized more readily this time, though it still has required additional interventions to address. In response to this summer’s storm, Vermont has rolled out new programs specifically aimed at damaged manufactured home removal and funding for those who received insufficient payouts from FEMA. A state legislative task force is also working to better understand the economics and issues related to manufactured housing in hopes of addressing policy gaps.
Because it’s not just a challenge accessing aid. Other types of homeowners also have more options when they’re ready to start moving on.
Stephanie Smith, hazard mitigation officer for Vermont Emergency Management, said buyouts were a key tool when it came to single-family homes after Irene. In those cases, the typical model was to pay 75% of the value of a property, an amount that was often significantly higher than the maximum FEMA payout, and gave the homeowner funds towards purchasing a new property. But this approach wasn’t feasible for manufactured homeowners, Smith told me. While many single-family homes appreciate in value over time, Smith said the value of a manufactured home often diminishes over time due to age and wear. And unlike single-family homes, in which the entire property goes into the valuation, manufactured home owners typically own just the structure they live in, paying rent on the actual land beneath it to a landlord.
So, based on just the value of that building, the payout these homeowners would receive would not be “anywhere near enough” to cover purchasing a new structure and paying lot rent, according to Smith.
Aging infrastructure is an issue in Tri-Park, from older homes to public offerings like the bridges and sewage systems, all of which can make the community more vulnerable to flooding. To address these compounding challenges, Tri-Park, where Johnson lives, developed a multimillion-dollar master plan with the input of government officials, residents, board members, and developers. It calls for funding infrastructure upgrades, including fixing up sewers and bridges over the brook, and proposes a new approach to buyouts. Instead of paying the 25 residents living in floodplains a percentage for their homes, Tri-Park will offer them new, eco-friendly manufactured homes located at a higher elevation within the same community.
The plan has multiple public and private supporters, including Smith’s department, which is providing the park with $2 million to purchase those new homes through the state’s Flood Resilient Communities Fund. At this point, both the plans and the funds to make this idea a reality are largely in place.
What’s still missing: Fewer than half of the minimum 25 households necessary to move forward have agreed to move. Residents have been hearing about the plan as a hypothetical for years while the board worked with partners and looked for capital. But board members and residents alike acknowledge there is a lot of skepticism around the plan’s promises. One challenge is that the new lots are expected to be smaller, and residents might not be able to have the same sort of layouts or amenities they currently enjoy.
To address these concerns, the Tri-Park board — which is open for residents to join — has hosted resident meetings and is offering a chance to tour models of the new types of homes they will be building. Which brings up another resiliency strategy more than a dozen parks have adopted since Irene: becoming resident-owned. Vermont law requires landowners of manufactured home parks to give notice to all lessees if they intend to sell the property, giving residents first dibs on purchasing the land. To do so, homeowners often opt to work with a nonprofit or establish a resident-owned cooperative, in which the residents become shareholders. Tri-Park is the largest of the 67 nonprofit or resident-owned manufactured home parks in the state, giving its residents an opportunity to have a voice in these larger park decisions.
Help from Cooperative Development Institute and Resident-Owned Communities has been a key part of this movement, local officials said. Julia Curry, who works for CDI in Vermont, says the biggest benefit in switching to a resident-owned model is security, as things like lot rent cannot be changed without resident input.
“Now the residents themselves — the members of the co-op — are setting their annual budgets,” Curry explained.
Aside from ensuring prices remain reasonable, that can also allow for prioritizing and accounting for risks like flooding. Last Christmas, a winter storm sent Sandy Jarvis’s Christmas into chaos. A mixture of high winds, rain, and snow over Northwestern Vermont caused the St. George Community Cooperative, where Jarvis has lived for nearly a decade, to lose power. Like Mountain Home, even an average storm causes large puddles to form in the low-lying neighborhood. But the Christmas flood sprang from another source — frozen pipes that cracked and leaked, draining the community’s well system.
For Jarvis, this was a warning sign. Since then, she’s been working to establish an emergency plan in the community and budget for a generator that could keep the water supply running during power outages. When the heavy rains came through this summer, she said, they were mostly spared, though they did lose power again and dealt with some flooding.
“Most mobile home communities in the state are old, and there's a lot of aging infrastructure,” Jarvis told me. Reflecting on their luck compared to other communities in the state, she later added, “We came out of it fairly well.”
Bill Dunton, another resident of the St. George development, has lived there nearly 25 years, through the transition to a cooperative; he’s witnessed flooding and the aftermath. Making changes can be difficult, he acknowledges, particularly in a neighborhood that has “118 families — and 118 different attitudes.” Still, Dunton believes the co-op model is ultimately supportive for residents, as it eliminates the fear of losing their homes or getting priced out with no notice, something Hamshaw from the University of Vermont said is not unusual in the state’s “bonkers” housing market, even after disasters.
Concerns over lot rent, which manufactured housing residents can still be charged after being displaced, and accessing aid are among the issues Hamshaw has heard since the summer storm. With the ground now frosting over at night as winter weather settles in, Hamshaw worries about the residents still in the thick of post-disaster bureaucracy. She’s currently interviewing displaced residents, many of whom are couch surfing or living in campers as they await aid. Even once they receive funds, she stressed that the housing market is significantly different now than it was after Irene, with everything from rent to repairs costing more, let alone new housing units.
That’s why Dunton, sitting inside his warm home as a light drizzle fell outside, said he hopes the state can come to see communities like St. George the way he does: as one of the last vestiges of actually affordable housing. And that, he believes, is well worth investing in for the long haul.
Support for this story was provided by The Neal Peirce Foundation, a non-profit organization dedicated to supporting journalism on ways to make cities and their larger regions work better for all people.
Log in
To continue reading, log in to your account.
Create a Free Account
To unlock more free articles, please create a free account.
Here at Heatmap, we write a lot about decarbonization — that is, the process of transitioning the global economy away from fossil fuels and toward long-term sustainable technologies for generating energy. What we don’t usually write about is what those technologies actually do. Sure, solar panels convert energy from the sun into electricity — but how, exactly? Why do wind turbines have to be that tall? What’s the difference between carbon capture, carbon offsets, and carbon removal, and why does it matter?
So today, we’re bringing you Climate 101, a primer on some of the key technologies of the energy transition. In this series, we’ll cover everything from what makes silicon a perfect material for solar panels (and computer chips), to what’s going on inside a lithium-ion battery, to the difference between advanced and enhanced geothermal.
There’s something here for everyone, whether you’re already an industry expert or merely climate curious. For instance, did you know that contemporary 17th century readers might have understood Don Quixote’s famous “tilting at windmills” to be an expression of NIMYBism? I sure didn’t! But I do now that I’ve read Jeva Lange’s 101 guide to wind energy.
That said, I’d like to extend an especial welcome to those who’ve come here feeling lost in the climate conversation and looking for a way to make sense of it. All of us at Heatmap have been there at some point or another, and we know how confusing — even scary — it can be. The constant drumbeat of news about heatwaves and floods and net-zero this and parts per million that is a lot to take in. We hope this information will help you start to see the bigger picture — because the sooner you do, the sooner you can join the transition, yourself.
Without further ado, here’s your Climate 101 syllabus:
Once you feel ready to go deeper, here are some more Heatmap stories to check out:
The basics on the world’s fastest-growing source of renewable energy.
Solar power is already the backbone of the energy transition. But while the basic technology has been around for decades, in more recent years, installations have proceeded at a record pace. In the United States, solar capacity has grown at an average annual rate of 28% over the past decade. Over a longer timeline, the growth is even more extraordinary — from an stalled capacity base of under 1 gigawatt with virtually no utility-scale solar in 2010, to over 60 gigawatts of utility-scale solar in 2020, and almost 175 gigawatts today. Solar is the fastest-growing source of renewable energy in both the U.S. and the world.
There are some drawbacks to solar, of course. The sun, famously, does not always shine, nor does it illuminate all places on Earth to an equal extent. Placing solar where it’s sunniest can sometimes mean more expense and complexity to connect to the grid. But combined with batteries — especially as energy storage systems develop beyond the four hours of storage offered by existing lithium-ion technology — solar power could be the core of a decarbonized grid.
Solar power can be thought of as a kind of cousin of the semiconductors that power all digital technology. As Princeton energy systems professor and Heatmap contributor Jesse Jenkins has explained, certain materials allow for electrons to flow more easily between molecules, carrying an electrical charge. On one end of the spectrum are your classic conductors, like copper, which are used in transmission lines; on the other end are insulators, like rubber, which limit electrical charges.
In between on that spectrum are semiconductors, which require some amount of energy to be used as a conductor. In the computing context these are used to make transistors, and in the energy context they’re used to make — you guessed it — solar panels.
In a solar panel, the semiconductor material absorbs heat and light from the sun, allowing electrons to flow. The best materials for solar panels, explained Jenkins, have just the right properties so that when they absorb light, all of that energy is used to get the electrons flowing and not turned into wasteful heat. Silicon fits the bill.
When you layer silicon with other materials, you can force the electrons to flow in a single direction consistently; add on a conductive material to siphon off those subatomic particles, and voilà, you’ve got direct current. Combine a bunch of these layers, and you’ve got a photovoltaic panel.
Globally, solar generation capacity stood at over 2,100 terawatt-hours in 2024, according to Our World in Data and the Energy Institute, growing by more than a quarter from the previous year. A huge portion of that growth has been in China, which has almost half of the world’s total installed solar capacity. Installations there have grown at around 40% per year in the past decade.
Solar is still a relatively small share of total electricity generation, however, let alone all energy usage, which includes sectors like transportation and industry. Solar is the sixth largest producer of electricity in the world, behind coal, gas, hydropower, nuclear power, and wind. It’s the fourth largest non-carbon-emitting generation source and the third largest renewable power source, after wind and hydropower.
Solar has taken off in the United States, too, where utility-scale installations make up almost 4% of all electricity generated.
While that doesn’t seem like much, overall growth in generation has been tremendous. In 2024, solar hit just over 300 terawatt-hours of generation in the U.S., compared to about 240 terawatt-hours in 2023 and just under 30 in 2014.
Looking forward, there’s even more solar installation planned. Developers plan to add some 63 gigawatts of capacity to the grid this year, following an additional 30 gigawatts in 2024, making up just over half of the total planned capacity additions, according to Energy information Administration.
Solar is cheap compared to other energy sources, and especially other renewable sources. The world has a lot of practice dealing with silicon at industrial scale, and China especially has rapidly advanced manufacturing processes for photovoltaic cells. Once the solar panel is manufactured, it’s relatively simple to install compared to a wind turbine. And compared to a gas- or coal-fired power plant, the fuel is free.
From 1975 to 2022, solar module costs fell from over $100 per watt to below $0.50, according to Our World In Data. From 2012 to 2022 alone, costs fell by about 90%, and have fallen by “around 20% every time the global cumulative capacity doubles,” writes OWID analyst Hannah Ritchie. Much of the decline in cost has been attributed to “Wright’s Law,” which says that unit costs fall as production increases.
While construction costs have flat-lined or slightly increased recently due to supply chain issues and overall inflation, the overall trend is one of cost declines, with solar construction costs declining from around $3,700 per kilowatt-hour in 2013, to around $1,600 in 2023.
There are solar panels at extreme latitudes — Alaska, for instance, has seen solar growth in the past few years. But there are obvious challenges with the low amount of sunlight for large stretches of the year. At higher latitudes, irradiance, a measure of how much power is transmitted from the sun to a specific area, is lower (although that also varies based on climate and elevation). Then there are also more day-to-day issues, such as the effect of snow and ice on panels, which can cause issues in turning sunlight into power (they literally block the panel from the sun). High latitudes can see wild swings in solar generation: In Tromso, in northern Norway, solar generation in summer months can be three times as high as the annual average, with a stretch of literally zero production in December and January.
While many Nordic countries have been leaders in decarbonizing their electricity grids, they tend not to rely on solar in that project. In Sweden, nuclear and hydropower are its largest non-carbon-emitting fuel sources for electricity; in Norway, electricity comes almost exclusively from hydropower.
There has been some kind of policy support for solar power since 1978, when the Energy Tax Act provided tax credits for solar power investment. Since then, the investment tax credit has been the workhorse of American solar policy. The tax credit as it was first established was worth 10% of the system’s upfront cost “for business energy property and equipment using energy resources other than oil or natural gas,” according to the Congressional Research Service.
But above that baseline consistency has been a fair amount of higher-level turmoil, especially recently. The Energy Policy Act of 2005 kicked up the value of that credit to 30% through 2007; Congress kept extending that timeline, with the ITC eventually scheduled to come down to 10% for utility-scale and zero for residential projects by 2024.
Then came the 2022 Inflation Reduction Act, which re-instituted the 30% investment tax credit, with bonuses for domestic manufacturing and installing solar in designated “energy communities,” which were supposed to be areas traditionally economically dependent on fossil fuels. The tax then transitioned into a “technology neutral” investment tax credit that applied across non-carbon-emitting energy sources, including solar, beginning in 2024.
This year, Congress overhauled the tax incentives for solar (and wind) yet again. Under the One Big Beautiful Bill Act, signed in July, solar projects have to start construction by July 2026, or complete construction by the end of 2027 to qualify for the tax credit. The Internal Revenue Service later tightened up its definition of what it means for a project to start construction, emphasizing continuing actual physical construction activities as opposed to upfront expenditures, which could imperil future solar development.
At the same time, the Trump administration is applying a vise to renewables projects on public lands and for which the federal government plays a role in permitting. Renewable industry trade groups have said that the highest levels of the Department of Interior are obstructing permitting for solar projects on public lands, which are now subject to a much closer level of review than non-renewable energy projects.
Massachusetts Institute of Technology Researchers attributed the falling cost of solar this century to “scale economies.” Much of this scale has been achieved in China, which dominates the market for solar panel production, especially for export, even though much of the technology was developed in the United States.
At this point, however, the cost of an actual solar system is increasingly made up of “soft costs” like labor and permitting, at least in the United States. According to data from the National Renewables Energy Laboratory, a utility-scale system costs $1.20 per watt, of which soft costs make up a third, $0.40. Ten years ago, a utility-scale system cost $2.90 per watt, of which soft costs was $1.20, or less than half.
Beyond working to make existing technology even cheaper, there are other materials-based advances that promise higher efficiency for solar panels.
The most prominent is “perovskite,” the name for a group of compounds with similar structures that absorb certain frequencies of light particularly well and, when stacked with silicon, can enable more output for a given amount of solar radiation. Perovskite cells have seen measured efficiencies upwards of 34% when combined with silicon, whereas typical solar cells top out around 20%.
The issue with perovskite is that it’s not particularly durable, partially due to weaker chemical bonds within the layers of the cell. It’s also more expensive than existing solar, although much of that comes down inefficient manufacturing processes. If those problems can be solved, perovskite could promise more output for the same level of soft costs as silicon-based solar panels.
The country’s largest source of renewable energy has a long history.
Was Don Quixote a NIMBY?
Miguel de Cervantes’ hero admittedly wasn’t tilting at turbines in 1605, but for some of his contemporary readers in 17th-century Spain, windmills for grinding wheat into flour were viewed as a “dangerous new technology,” author Simon Winchester writes in his forthcoming book, The Breath of the Gods: The History and Future of the Wind. One interpretation of Cervantes’ novel might be that Quixote was “actually doing battle with progress.”
Nearly four and a half centuries later, harnessing the energy of the wind remains controversial, even if the breeze is one of humankind’s longest-utilized resources. While wind is the largest source of renewable electricity generation in the United States today, high construction costs and local opposition have more recently stymied the industry’s continued expansion. The new presidential administration — suspicious of wind’s reliability and place in the American energy mix — has also been doing its very best to stunt any future growth in the sector.
Whether you’re catching up on Trump’s latest regulatory moves, you have your own concerns about the safety of the technology, or this is your first time even thinking about this energy resource, here is the blow-by-blow — sorry! — on wind power in the U.S.
At their most basic conceptual level, wind turbines work by converting kinetic energy — the energy of an object in motion; in this case, air particles — into electrical energy that can be used to power homes, buildings, factories, and data centers.
Like hydroelectric dams, turbines do this by first converting kinetic energy into mechanical energy. The wind turns the turbine blades, which spin a rotor that is connected to a generator. Inside the generator are magnets that rotate around coils of copper wire, creating a magnetic field that pushes and pulls the electrons within the copper. Voilà — and with gratitude to Michael Faraday — now you have an electrical current that can be distributed to the grid.
Turbines typically require an average wind speed of about 9 miles per hour to generate electricity, which is why they are constructed in deserts, mountain passes, on top of hills, or in shallow coastal waters offshore, where there is less in the way to obstruct the flow of wind. Higher elevations are also windier, so utility-scale wind turbines are frequently around 330 feet tall (though the largest turbines tower 600 feet or higher).
It depends on the size of the turbine and also the wind speed. The average capacity of a new land-based wind turbine in the U.S. was 3.4 megawatts in 2023 — but that’s the “nameplate capacity,” or what the turbine would generate if it ran at optimal capacity around the clock.
U.S. Department of Energy
In the U.S., the average capacity factor (i.e. the actual energy output) for a turbine is more like 42%, or close to two-fifths of its theoretical maximum output. The general rule of thumb is that one commercial turbine in the U.S. can power nearly 1,000 homes per month. In 2023, the latest year of data available, land-based and offshore wind turbines in the U.S. generated 425,235 gigawatt-hours of electricity, or enough to power 39 million American homes per year.
A common criticism of wind power is that it “stops working” if the wind isn’t blowing. While it’s true that wind is an intermittent resource, grid operators are used to coping with this. A renewables-heavy grid should combine different energy sources and utilize offline backup generators to prevent service interruptions during doldrums. Battery storage can also help handle fluctuations in demand and increase reliability.
At the same time, wind power is indeed dependent on, well, the wind. In 2023, for example, U.S. wind power generation dropped below 2022 levels due to lower-than-average wind speeds in parts of the Midwest. When you see a turbine that isn’t spinning, though, it isn’t necessarily because there isn’t enough wind. Turbines also have a “cut out” point at which they stop turning if it gets too windy, which protects the structural integrity of the blades and prevents Twisters-like mishaps, as well as keeps the rotor from over-spinning, which could strain or break the turbine’s internal rotating components used to generate electricity.
Though Americans have used wind power in various forms since the late 1800s, the oil crisis of the 1970s brought new interest, development, and investment in wind energy. “The American industry really got going after the suggestion from the Finns, the Swedes, the Danes,” who’d already been making advances in the technology, albeit on single-turbine scales, Winchester, the author of the forthcoming history of wind power, The Breath of the Gods, told me.
In the early 1970s, the Department of Energy issued a grant to William Heronemus, a professor at the University of Massachusetts, Amherst, to explore the potential of wind energy. Heronemus became “really enthusiastic and built wind generators on the campus,” helping to modernize turbines into the more familiar construction we see widely today, Winchester said.
Some of Heronemus’ former students helped build the world’s first multi-turbine wind farm in New Hampshire in 1981. Though the blades of that farm interfered with nearby television reception — they had to be paused during prime time — the technology “seemed to everyone to make sense,” Winchester said. The Energy Policy Act of 1992, which introduced production tax credits for renewables, spurred further development through the end of the millennium.
Heronemus, a former Naval architect, had dreamed in the 1970s of building a flotilla of floating turbines mounted on “wind ships” that were powered by converting seawater into hydrogen fuel. Early experiments in offshore wind by the Energy Research and Development Administration, the progenitor of the Department of Energy, weren’t promising due to the technological limitations of the era — even commercial onshore wind was still in its infancy, and Heronemus’ plans looked like science-fiction.
In 1991, though, the Danes — ever the leaders in wind energy — successfully constructed the Vindeby Offshore Wind Farm, complete with 11 turbines and a total installed capacity of 5 megawatts. The Blyth offshore wind farm in northern Wales soon followed, with the United States finally constructing its first grid-connected offshore wind turbines off of Maine in 2013. The Block Island wind farm, with a capacity of 30 megawatts, is frequently cited as the first true offshore wind farm in the U.S., and began operating off the coast of Rhode Island in 2016.
Though offshore wind taps into higher and more consistent wind speeds off the ocean — and, as a result, is generally considered more efficient than onshore wind — building turbines at sea comes with its own set of challenges. Due to increased installation costs and the greater wear-and-tear of enduring saltwater and storms at sea, offshore wind is generally calculated to be about twice as expensive as onshore wind. “It’s unclear if offshore wind will ever be as cheap as onshore — even the most optimistic projections documented by the National Renewable Energy Laboratory have offshore wind more expensive than the current price of onshore in 2035,” according to Brian Potter in his newsletter, Construction Physics, though he notes that “past projections have underestimated the future cost reductions of wind turbines.”
Scott Eisen/Getty Images
In the decade from 2014 to 2023, total wind capacity in the U.S. doubled. Onshore and offshore wind power is now responsible for over 10% of utility-scale electricity generation in the U.S., and has been the highest-producing renewable energy source in the nation since 2019. (Hydropower, the next highest-producing renewable energy source, is responsible for about 5.7% of the energy mix, by comparison.) In six states — Iowa, Kansas, Oklahoma, New Mexico, South Dakota, and North Dakota — onshore wind makes up more than a third of the current electricity mix, Climate Central reports.
Offshore wind has been slower to grow in the U.S. Even during the Biden administration, when the government targeted developing 30 gigawatts of offshore wind capacity by 2030, the industry faced financing challenges, transmission and integration obstacles, and limits in access to a skilled workforce, per a 2024 paper in Energy Research & Social Science. That same year, the Department of Energy reported that the nation had a total of 80,523 megawatts for offshore wind in operation and in the pipeline, which, under ideal conditions, could power 26 million homes. Many of those offshore projects and plans now face an uncertain future under the Trump administration.
Though we’re far removed from the 1880s, when suspicious Scots dismissed wind energy pioneer James Blyth’s home turbine as “the devil’s work,” there are still plenty of persistent concerns about the safety of wind power to people and animals.
Some worry about onshore wind turbines’ effects on people, including the perceived dangers of electromagnetic fields, shadow flicker from the turning blades, and sleep disturbance or stress. Per a 2014 systematic review of 60 peer-reviewed studies on wind turbines and human health by the National Institutes of Health, while there was “evidence to suggest that wind turbines can be a source of annoyance to some people, there was no evidence demonstrating a direct causal link between living in proximity to wind turbines and more serious physiological health effects.” The topic has since been extensively studied, with no reputable research concluding that turbines have poor health impacts on those who live near them.
Last year, the blade of a turbine at Vineyard Wind 1 broke and fell into the water, causing the temporary closure of beaches in Nantucket to protect people from the fiberglass debris. While no one was ultimately injured, GE Vernova, which owns Vineyard Wind, agreed earlier this year to settle with the town for $10.5 million to compensate for the tourism and business losses that resulted from the failure. Thankfully, as my colleague Jael Holzman has written, “major errors like blade failures are incredibly rare.”
There are also concerns about the dangers of wind turbines to some wildlife. Turbines do kill birds, including endangered golden eagles, which has led to opposition from environmental and local activist groups. But context is also important: The U.S. Fish & Wildlife Service has found that wind farms “represent just 0.03% of all human-related bird deaths in the U.S.” (Illegal shootings, for example, are the greatest cause of golden eagle deaths.) The continued use of fossil fuels and the ecological impacts of climate change also pose a far graver threat to birds than wind farms do. Still, there is room for discussion and improvement: The California Department of Fish and Wildlife issued a call earlier this year for proposals to help protect golden eagles from turbine collisions in its major wind resource areas.
Perhaps the strongest objection to offshore wind has come from concern for whales. Though there has been an ongoing “unusual mortality event” for whales off the East Coast dating back to 2016 — about the same time the burgeoning offshore wind industry took off in the United States — the two have been falsely correlated (especially by groups with ties to the fossil fuel industry). A recent government impact report ordered by Republicans even found that “NOAA Fisheries does not anticipate any death or serious injury to whales from offshore wind-related actions and has not recorded marine mammal deaths from offshore wind activities.” Still, that hasn’t stopped Republican leaders — including the president — from claiming offshore wind is making whales “a little batty.”
Polling by Heatmap has found that potential harm to wildlife is a top concern of both Democrats and Republicans when it comes to the deployment of renewable energy. Although there has been “no evidence to date that the offshore wind build-out off the Atlantic coast has harmed a single whale … studies have shown that activities related to offshore wind could harm a whale, which appears to be enough to override the benefits for some people,” my colleague Jael has explained. A number of environmental groups are attempting to prevent offshore and land-based wind development on conservationist grounds, to varying degrees of success. Despite these reservations, though, our polling has found that Americans on the coast largely support offshore wind development.
Aesthetic concerns are another reason wind faces opposition. The proposed Lava Ridge wind farm in Idaho, which was Heatmap’s most imperiled renewable energy project last year, faced intense opposition, ostensibly due to the visibility of the turbines from the Minidoka National Historic Site, the site of a Japanese internment camp. Coastal homeowners have raised the same complaint about offshore wind that would be visible from the beach, like the Skipjack offshore wind project, which would be situated off the coast of Maryland.
Not good. As one of President Trump’s first acts in office, he issued an executive order that the government “shall not issue new or renewed approvals, rights of way, permits, leases, or loans for onshore or offshore wind projects” until the completion of a “comprehensive assessment” of the industry’s impacts on the economy and the environment. Eight months later, federal agencies were still not processing applications for onshore wind projects.
Offshore wind is in even more trouble because such projects are sited entirely in federal waters. As of late July, the Bureau of Ocean Energy Management had rescinded all designated wind energy areas — a decision that applies to some 3.5 million acres of federal waters, including the Central Atlantic, California, and Oregon. The Department of the Interior has also made moves to end what it calls the “special treatment for unreliable energy sources, such as wind,” including by “evaluating whether to stop onshore wind development on some federal lands and halting future offshore wind lease sales.” The Interior Department will also look into how “constructing and operating wind turbines might affect migratory bird populations.”
The One Big Beautiful Bill Act, meanwhile, put strict restrictions on tax credits available to wind developers. Per Cleanview, the bill jeopardizes some 114 gigawatts of wind energy projects, while the Center for American Progress writes that “more than 17,000 jobs are connected to offshore wind power projects that are already canceled, on hold, or at risk from the Trump administration’s attacks on wind power.”
The year 2024 marked a record for new wind power capacity, with 117 gigawatts of wind energy installed globally. China in particular has taken a keen interest in constructing new wind farms, installing 26 gigawatts worth, or about 5,300 turbines, between January and May of last year alone.
Still, there are significant obstacles to the buildout of wind energy even outside of the United States, including competition from solar, which is now the cheapest and most widely deployed renewable energy resource in the world. High initial construction costs, deepened by inflation and supply-chain issues, have also stymied wind development.
There are an estimated 424 terawatts worth of wind energy available on the planet, and current wind turbines tap into just half a percent of that. According to Columbia Business School’s accounting, if maximized, wind has the potential to “abate 10% to 20% of CO2 emissions by 2050, through the clean electrification of power, heat, and road transport.”
Wind is also a heavy player in the Net Zero Emissions by 2050 Scenario, which aims for
7,100 terawatt hours of wind electricity generation worldwide by the end of the decade, per the International Energy Agency. But current annual growth would need to increase annual capacity additions from about 115 gigawatts in 2023 to 340 gigawatts in 2030. “Far greater policy and private-sector efforts are needed to achieve this level of capacity growth,” IEA notes, “with the most important areas for improvement being facilitating permitting for onshore wind and cost reductions for offshore wind.”
Wind turbines continue to become more efficient and more economical. Many of the advances have come in the form of bigger turbines, with the average height of a hub for a land-based turbine increasing 83% since the late 1990s. The world’s most powerful offshore turbine, Vestas’ V236-15.0 megawatt prototype, is, not coincidentally, also the world’s tallest, at 919 feet.
Advanced manufacturing techniques, such as the use of carbon fiber composites in rotor blades and 3D printed materials, could also lead to increases in efficiency. In a 2024 report, NREL anticipated that such innovations could potentially “unlock 80% more economically viable wind energy capacity within the contiguous United States.”
Floating offshore wind farms are another area of active innovation. Unlike the fixed-foundation turbines mainly used offshore today, floating turbines could be installed in deep waters and allow for development on trickier coastlines like off of Oregon and Washington state. Though there are no floating offshore wind farms in the United States yet, there are an estimated 266 gigawatts of floating turbine capacity in the pipeline globally.