By the end of August, scientists were already beginning to predict that 2023 would be the hottest year on record. June, July, and August had been the hottest consecutive summer months of all time. And then September happened.
Last week, Berkeley Earth climate scientist Zeke Hausfather took a look at daily global average temperature data for September and made a startling observation. It was on track to be the most anomalously hot month on record, period.
On September 17, as tens of thousands of climate activists took to the streets in Midtown Manhattan to demand an end to fossil fuels, the global average temperature was surging. The mercury rose to more than 1.8 degrees Fahrenheit above the average temperatures registered between 1991 and 2020. And those recent three decades were already unusually hot relative to pre-industrial temperatures. Compared to pre-industrial times, the day was 3.4 to 3.6 degrees hotter.
Numbers like this always sound laughably small, but when you take a look at the chart below, it's clear how exceptionally, worryingly hot this month has been.
 Daily global surface temperature anomalies in JRA-55 between 1958 and 2023, relative to the 1991-2020 baseline period used by the dataset.Courtesy of Zeke Hausfather / The Climate Brink
The lines represent daily temperature anomalies, or the difference between the temperature on a given day and the average temperature between 1991-2020 on that day. The red line shows temperature anomalies in 2016, the prior hottest year on record. The black line shows 2023, with September highlighted in blue. (The data comes from an analysis tool by the Japanese Meteorological Agency.)
Here’s the same data, but displayed in our favorite form of visualization, the *heatmap.* While global warming has clearly been ramping up in the last decade, September 2023 jumps off the map for sustained high temperatures.
 Heatmap of daily global mean surface temperature anomalies back to 1958 relative to the 1991-2020 baseline period.Courtesy of Zeke Hausfather / The Climate Brink
“It’s hard to overstate just how exceptionally high global temperatures are at the moment. They have blown past anything we’ve previously experienced by a huge margin,” Hausfather wrote on X this morning. He has more charts and information contextualizing the data over on the Substack he co-writes with Texas A&M professor Andrew Dessler, The Climate Brink.


 Daily global surface temperature anomalies in JRA-55 between 1958 and 2023, relative to the 1991-2020 baseline period used by the dataset.Courtesy of Zeke Hausfather / The Climate Brink
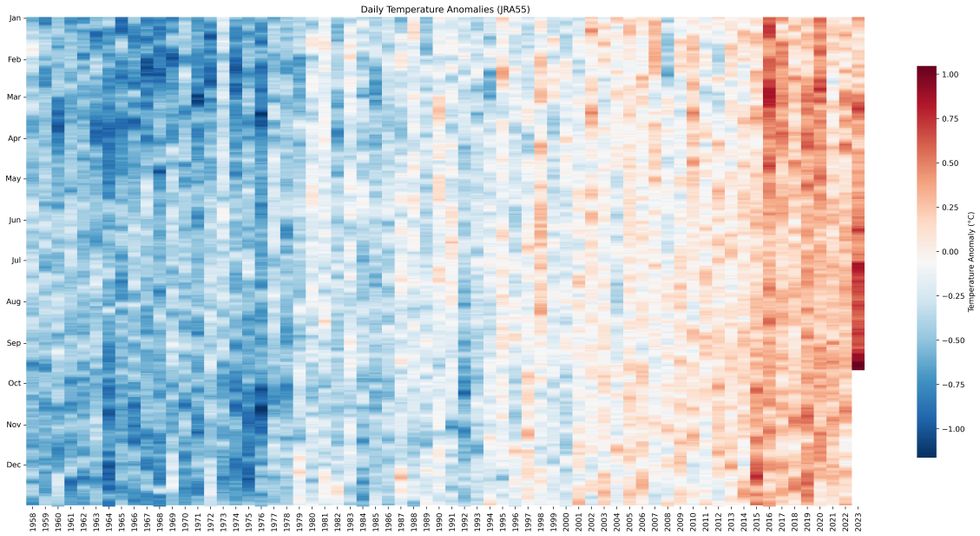 Heatmap of daily global mean surface temperature anomalies back to 1958 relative to the 1991-2020 baseline period.Courtesy of Zeke Hausfather / The Climate Brink