The federal government has become an increasingly unreliable partner to climate tech innovators. Now venture capitalists, nonprofits, and academics are embracing a new plan to survive.
On Thursday, an interdisciplinary coalition — including Breakthrough Energy, McKinsey, and Stanford University’s Doerr School of Sustainability — unveiled the Climate Tech Atlas, a new plan to map out opportunities in the sector and define innovation imperatives critical to the energy transition.
The goal is to serve as a resource for stakeholders across the industry, drawing their focus toward the technological frontiers the alliance sees as the most viable pathways to economy-wide decarbonization. The idea is not to eliminate potential solutions, but rather “to enable the next generation of innovators, entrepreneurs, researchers, policymakers, and investors to really focus on where we felt there was the largest opportunity for exploration and for innovation to impact our path to net zero through the lens of technology,” Cooper Rinzler, a key collaborator on the initiative and a partner at the venture capital firm Breakthrough Energy Ventures, told me.
Other core contributors include the nonprofit investor Elemental Impact, John Doerr’s climate initiative Speed & Scale, and the policy think tank Energy Innovation. The Atlas has been a year in the making, Ryan Panchadsaram of Speed & Scale told me. “We’ve had maybe close to 20 to 30 working sessions with 80 different contributors, all focused on the big question of what innovations are needed to decarbonize our economy.”
The website, which launched today, lays out 24 opportunity areas across buildings, manufacturing, transportation, food, agriculture and nature, electricity, and greenhouse gas removal. Diving into “buildings,” for example, one can then drill down into an opportunity area such as “sustainable construction and design,” which lists three innovation imperatives: creating new design tools to improve materials efficiency and carbon intensity, improving building insulation and self-cooling, and industrializing construction to make it faster and more modular.
Then there are the moonshots — 39 in total, and two for this opportunity in particular. The first is developing carbon-negative building coatings and surface materials, and the second is inventing low-carbon building materials that can outperform steel and cement. It’s these types of moonshots, Rinzler told me, where much of the “residual uncertainty” and thus “opportunity for surprise” lies.
Each core collaborator, Panchadsaram said, naturally came into this exercise with their own internal lists and ideas about what types of tech and basic research were needed most. The idea, he told me, was to share “an open source version of what we each had.”
As Dawn Lippert, founder and CEO of Elemental Impact, put it to me, the Atlas “can help accelerate any conversation.” Her firm meets with over 1,000 entrepreneurs per year, she explained, on top of numerous philanthropists trying to figure out where to direct their capital. The Atlas can serve as a one-stop-shop to help them channel their efforts — and dollars — into the most investable and salient opportunities.
The same can be said for research priorities among university faculty, Charlotte Pera, the executive director of Stanford’s Sustainability Accelerator, told me. That then trickles down to help determine what classes, internships, and career paths students interested in the intersection of sustainability and technology ultimately choose.
The coalition members — and the project itself — speak to the prudence of this type of industry-wide level-setting amidst a chaotic political and economic environment. Referencing the accelerants Speed & Scale identifies as critical to achieving net-zero emissions — policy, grassroots and global movements, innovation, and investment — Panchadsaram told me that “when one is not performing in the way that you want, you have to lean in more into the others.”
These days, of course, it’s U.S. policy that’s falling short. “In this moment in time, at least domestically, innovation and investment is one that can start to fill in that gap,” he said.
This isn’t the first effort to meticulously map out where climate funding, innovation, and research efforts should be directed. Biden’s Department of Energy launched the Earthshots Initiative, which laid out innovation goals and pathways to scale for emergent technologies such as clean hydrogen, long-duration energy storage, and floating offshore wind. But while it’s safe to say that Trump isn’t pursuing the coordinated funding and research that Earthshots intended to catalyze, the private sector has a long and enthusiastic history with strategic mapping.
Breakthrough Energy, for example, had already pinpointed what it calls the “Five Grand Challenges” in reaching net-zero emissions: electricity, transportation, manufacturing, buildings, and agriculture. It then measures the “green premium” of specific technologies — that is, the added cost of doing a thing cleanly — to pinpoint what to prioritize for near-term deployment and where more research and development funding should be directed. Breakthrough's grand challenges closely mirror the sectors identified in the Atlas, which ultimately goes into far greater depth regarding specific subcategories.
Perhaps the pioneer of climate tech mapping is Kleiner Perkins, the storied venture capital firm, where Doerr was a longtime leader and currently serves as chairman; Panchadsaram is also an advisor there. During what investors often refer to as Clean Tech 1.0 — a boom-and-bust cycle that unfolded from roughly 2006 to 2012 — the firm created a “map of grand challenges.” While it appears to have no internet footprint today, in 2009, Bloomberg described it as a “chart of multicolored squares” tracking the firm’s investment across key climate technologies, with blank spots for tech with the potential to be viable — and investable — in the future.
Many of these opportunities failed to pay off, however. The 2008 financial crisis, the U.S. oil and natural gas boom, and slow development timelines for clean tech contributed to a number of high-profile failures, causing investors to sour on clean tech — a precedent the Atlas coalition would like to avoid.
These days, investors tend to tell me that Clean Tech 1.0 taught them to be realistic about long commercialization timelines for climate tech. Breakthrough Energy Ventures, for example, has funds with lengthy 20-year investment horizons. In a follow-up email, Rinzler also noted that even considering the current political landscape, “there’s a far more robust capital, corporate, and policy environment for climate tech than there was in the 2000s.” Now, he said, investors are more likely to consider the broader landscape across tech, finance, and policy when gauging whether a company can compete in the marketplace. And that often translates to a decreased reliance on government support.
“There are quite a few solutions that are embodied here that really don’t have an obligate dependence on policy in any way,” Rinzler told me. “You don’t have to care about climate to think that this is an amazing opportunity for an entrepreneur to come in and tackle a trillion-dollar industry with a pure profit incentive.”
The Atlas also seeks to offer a realistic perspective on its targets’ commercial maturity via a “Tech Category Index.” For example, the Atlas identifies seven technology categories relevant to the buildings sector: deconstruction, disposal and reuse, green materials, appliances, heating and cooling, smart buildings, and construction. While the first three are deemed “pilot” stage, the rest are “commercial.” More nascent technologies such as fusion, as well as many carbon dioxide removal methods are categorized as “lab” stage.
But the Atlas isn’t yet complete, its creators emphasized. Even now they’re contemplating ways to expand, based on what will provide the most value to the sector. “Is it more details on commercial status? Is it the companies that are working on it? Is it the researchers that are doing this in their lab?” Panchadsaram mused. “We are asking those questions right now.”
There’s even a form where citizen contributors can suggest new innovation imperatives and moonshots, or provide feedback on existing ones. “We do really hope that people, when they see this, collaborate on it, build on it, duplicate it, replicate it,” Panchadsaram told me. “This is truly a starting point.”


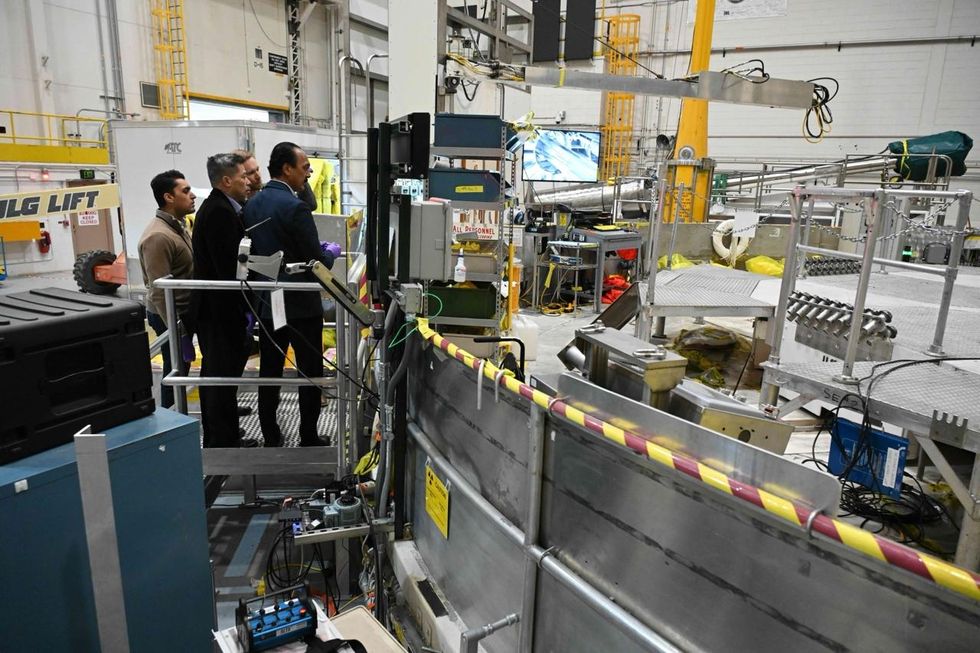 The startup team observes the test reactor at the Idaho National Lab. Clean Core Thorium Energy
