You’re out of free articles.
Log in
To continue reading, log in to your account.
Create a Free Account
To unlock more free articles, please create a free account.
Sign In or Create an Account.
By continuing, you agree to the Terms of Service and acknowledge our Privacy Policy
Welcome to Heatmap
Thank you for registering with Heatmap. Climate change is one of the greatest challenges of our lives, a force reshaping our economy, our politics, and our culture. We hope to be your trusted, friendly, and insightful guide to that transformation. Please enjoy your free articles. You can check your profile here .
subscribe to get Unlimited access
Offer for a Heatmap News Unlimited Access subscription; please note that your subscription will renew automatically unless you cancel prior to renewal. Cancellation takes effect at the end of your current billing period. We will let you know in advance of any price changes. Taxes may apply. Offer terms are subject to change.
Subscribe to get unlimited Access
Hey, you are out of free articles but you are only a few clicks away from full access. Subscribe below and take advantage of our introductory offer.
subscribe to get Unlimited access
Offer for a Heatmap News Unlimited Access subscription; please note that your subscription will renew automatically unless you cancel prior to renewal. Cancellation takes effect at the end of your current billing period. We will let you know in advance of any price changes. Taxes may apply. Offer terms are subject to change.
Create Your Account
Please Enter Your Password
Forgot your password?
Please enter the email address you use for your account so we can send you a link to reset your password:
Same goes for the Midwest, according to Stanford air quality researcher Marshall Burke.

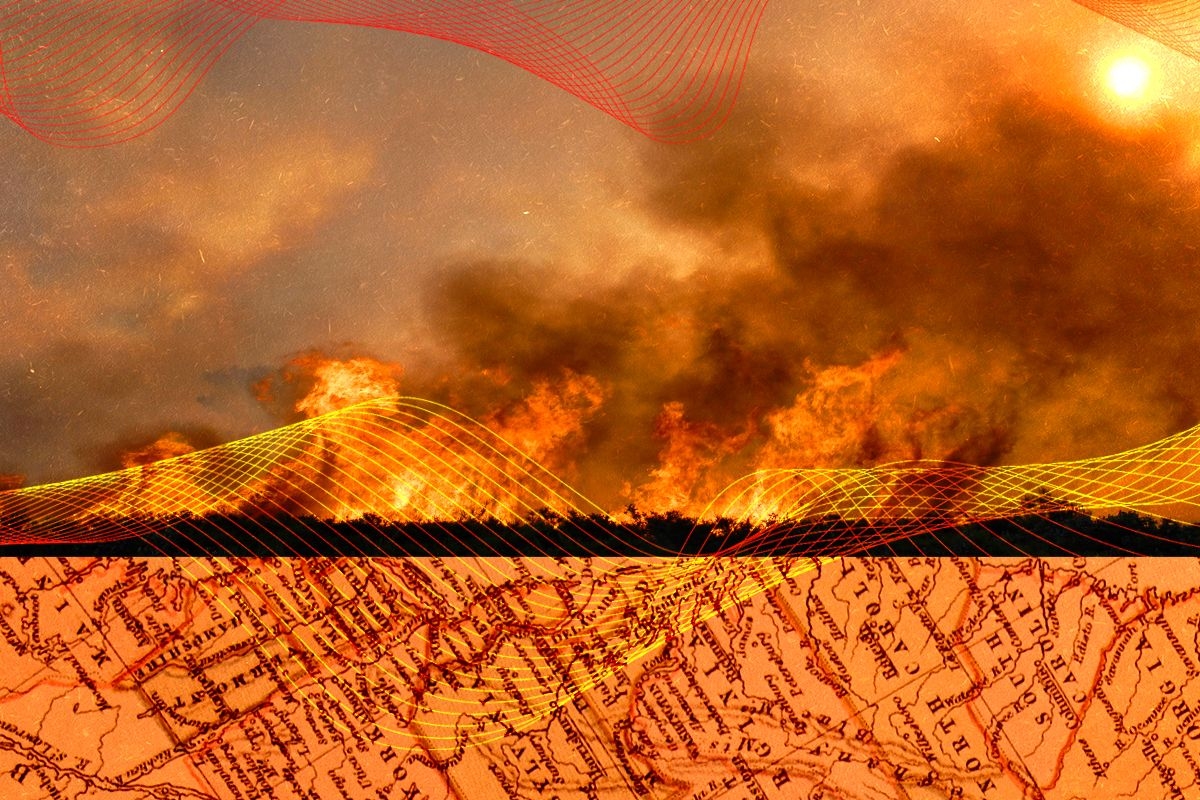
It’s not just you: Summers are getting smokier.
For the third year in a row, cities like Detroit, Minneapolis, Boston, and New York are experiencing dangerously polluted air for days at a time as smoke drifts into the U.S. from wildfires in Canada.
Smoke has traveled to these places in the past, Stanford University researcher Marshall Burke told me. But the data is clear that the haze is becoming more severe.
“The worst days are worse,” said Burke, “and you can see that in the averages, the last couple of years are much, much higher across the Midwest and the East Coast than we’ve observed in the past many decades.”
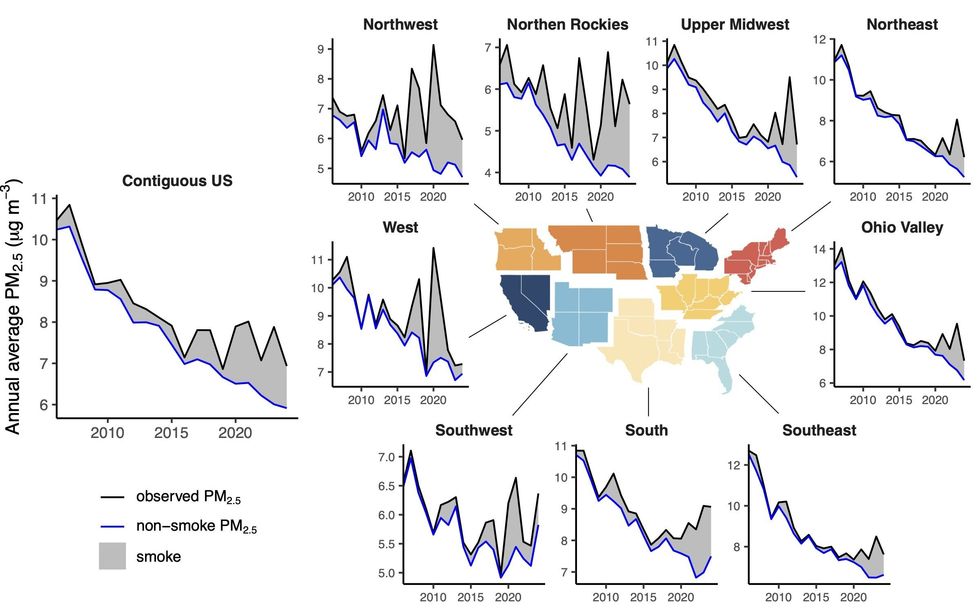
Burke is one of the leading scholars studying wildfire smoke, investigating everything from its effect on air quality, public health, and behavior, to preventative and adaptive public policy responses. In one of his most recent papers, which has not yet been peer reviewed, he and his co-authors analyzed the influence of smoke on air quality over the past two decades, using satellite imagery of smoke plumes to disentangle how much of the fine particulate matter, or PM2.5, measured by air monitoring stations came from fires versus more typical sources like cars and furnaces.
The study shows a sharp increase in the amount of smoke in the air around the U.S. in just the past few years. From 2020 to 2023, the average American breathed in concentrations of smoke-related PM2.5 that were between 2.6 and 6.7 times higher than the 2006 to 2019 average.
The paper also contains a stunning set of charts that show that wildfires are eroding decades of air quality gains — and the efficacy of air quality regulation in general — and that without these smoke events, PM2.5 levels would have been significantly lower.

I caught up with Burke to better understand what we know about this seemingly sudden escalation of smoke events, and what we can do to better protect ourselves from them moving forward. Our conversation has been lightly edited for clarity.
Given the smoke events we’ve seen in the last three years, can we say anything about the next three years?
I don’t think you want to make bets on any specific years. The long run trend, unfortunately, suggests that the last few years are going to be more representative than the sorts of years we got 10 to 15 to 20 years ago. And that is due to the underlying physical climate that’s warming and drying out fuels and making fire spread faster and fires much larger. Larger fires generate more smoke.
Has it all been driven by Canadian wildfires?
No. The East Coast and the Midwest will get exposure from fires as far as California, often in the Northern Rockies. But the recent very bad exposure — 2023 was by far the worst year in the Midwest and East Coast — that was nearly all from Canadian fires. This year, again, it’s nearly all from Canadian fires.
Why is that?
The reason we’ve seen a lot more Canadian fires is the same reason we’ve seen a lot more fires in the U.S. West — increasing fuel aridity. As temperatures warm, forests dry out. And so when you get lightning strikes, which tend to start most of the large fires in Canada, you get faster fire spread and much larger fires.
Interestingly, we’ve seen in Canada fewer total fires over time. Often I see people posting this on Twitter — Climate change is not a problem, we’re getting fewer fires in Canada — and that’s true. I think they’ve reduced other sources of ignitions. But you still get lightning ignitions.
Burned area has gone the other way — you’ve seen an increase in burned area. So, fewer fires, but much larger fires, and these larger fires are the ones that put out a lot more smoke, and the smoke gets pushed into population centers in Canada and into the U.S.
There were really large wildfires in California before 2023. Why weren’t places on the East Coast having smoky days as a result of those?
It’s the way the wind blows and how far it has to go. In the large 2020 and 2021 fire seasons we had in the U.S. West, some of that smoke certainly was making it to the East Coast, but given the prevailing wind patterns and the distance the smoke had to travel, the influence of those fires on air quality was not as big as the recent Canadian fires.
Are there other events that cause comparable air quality degradation to wildfires?
You can get really specific things — if a train crashes and lights on fire and a given town is exposed to really high levels of whatever pollutant for a few days. Sometimes you can get dust events that have broad scale exposure. But basically never do you reach the AQI levels that we see in wildfires. Wildfires are pretty unique in their ability to expose very large numbers of people to a very high level of pollutants for days, or unfortunately now, weeks, at a time. Nothing else compares in the U.S.
If you go to other parts of the world where you have large anthropogenic sources — Indian cities, Chinese cities — it can be quite different. There’s some exceptions. Salt Lake City and places where you get inversions and you get pollution trapped for many days, you can get pretty high levels of exposure, but typically nowhere close to what you get during these acute wildfire events.
When the AQI goes back down to levels that are more common in a city after a smoke event and people feel safer going outside, are you able to measure how much of the PM2.5 remaining in the air is from a wildfire? Does it matter?
We try to measure that directly — on any given day, how much of the PM that you’re experiencing is from wildfires versus from other sources. What you see is these events can turn on really quickly, and they can also turn off really quickly, either because the wind direction changes or because it rains — if it rains, you rain out a lot of these pollutants, and then you’re breathing mostly clean air right away.
We also try to measure, how does human health respond? One thing that science doesn’t give us a crisp answer to yet is, is one day of 100 micrograms better or worse than 10 days of 10 micrograms of exposure? We don’t actually really know. What we do see is people respond very differently to those two scenarios in ways that likely affect health outcomes. On really bad days, people tend to stay inside. In California, total emergency department visits go down instead of up, and that’s because people are not getting in their cars, they’re not getting in car accidents, they’re not spraining their ankle playing football or whatever because they’re staying at home.
On lower smoke days, we see emergency department visits go up. That’s probably because people are not changing their behavior. But, maybe surprisingly, we still don’t have a crisp answer if you’re thinking about asthma or mortality or other cardiovascular outcomes.
What are some of the other questions researchers are trying to answer as this becomes more of a national issue?
All sorts of things. The immediate health impacts that you think about — respiratory outcomes have been the one that’s been measured best in a lot of different settings. Cardiovascular outcomes, I would say the evidence is surprisingly more mixed on that. There’s a long-standing literature that shows cardiovascular mortality impacts of exposure to PM, but for wildfire PM, specifically, that evidence is less clear. Sorting that out and trying to understand whether there are differences is important.
Cognitive outcomes — does it increase your risk of dementia? Does student learning go down? Does it reduce cognitive performance at work? I think there’s emerging evidence that smoke is pretty important. Exposure to air pollution, more broadly, is important, but wildfire smoke, specifically, can impact these outcomes.
Birth outcomes is another one we and others have looked at. You see a pretty clear signature of wildfire smoke in birth outcomes — increases to the risk of pre-term birth, for instance. We used to just think about sensitive populations as elderly populations or people with pre-existing conditions. And basically what the research is showing is, no, actually, everyone is sensitive in some way. The list of people who are likely affected probably includes most, if not all of us.
What are the potential policy responses to this in places that haven’t had to deal with it in the past?
I think there’s three policy buckets. This is more true in the U.S. than Canada, but our fire problem is a combination of a warming climate and a century of fire suppression that has left abundant fuel in our landscapes, so number one is dealing with climate change as best we can, and two is doing something about the accumulated fuel loads. There’s a lot we can do there — prescribed burning is one approach that we and others are studying a lot; mechanical thinning, where you go out and actually remove the fuel. Understanding when and where to do that and what the benefits are is an ongoing scientific challenge, but I think most of the evidence would suggest we’re going to need a lot more of that than we’ve done, historically.
But even if we do a lot of that, we’re going to get more of these smoke events, unfortunately. And so we need to protect ourselves when these events happen. Indoor air filtration works really well, so we need to make sure people have access to filters of various types. The evidence would suggest that we see health impacts even at pretty low levels of exposure, and so if you have a portable filter — I drive my family crazy, I’m turning ours on all the time. You should basically just be running them all the time.
What about in terms of messaging? I’m thinking about city officials or state officials, when a smoke event is coming — and maybe this is still an active area of research — but what’s the current thinking on what message to send to people?
Yeah, I think it is an ongoing area, in terms of exactly how to do this and who to target with the information. The way we typically do this is to set these thresholds, right? So, above some threshold, you get a notice, and below, you don’t. That is understandable.
But what we see in the data is that there’s not some level below which you’re fine and above which you’re screwed. What we see is the more smoke you’re exposed to, the worse off you are, and so our goal should just be to reduce our exposure as best we can. How to message that effectively is not something we have a crisp social scientific answer to yet.
A lot of the advice has historically been that you should stay at home with your windows and doors closed. In California homes that is not very protective because California homes tend to be not very tight. In my view, just telling people to close their windows and doors is not sufficient for protecting health. They need some sort of active filtration — portable air filter, central air — to do that.
The other thing that’s happened in California, and I’ve seen this with my own kids — should we cancel school on really bad days? The assumption is that kids are better protected at home than they would be in the school environment, and that’s just not obviously true. It could be the case that for many kids, schools are better. We don’t know, because we do not have comprehensive measurement of indoor air quality, and this is a huge failing that we need to fix. Just as we measure it pretty comprehensively outside, we’ve got to do the same thing inside, and we just haven’t done this.
Log in
To continue reading, log in to your account.
Create a Free Account
To unlock more free articles, please create a free account.
Agriculture startups are suddenly some of the hottest bets in climate tech, according to the results of our Insiders Survey.
Innovations in agriculture can seem like the neglected stepchild of the climate tech world. While food and agriculture account for about a quarter of global emissions, there’s not a lot of investment in the space — or splashy breakthroughs to make the industry seem that investible in the first place. In transportation and energy, “there is a Tesla, there is an EnPhase,” Cooper Rinzler, a partner at Breakthrough Energy Ventures, told me. “Whereas in ag tech, tell me when the last IPO that was exciting was?”
That may be changing, however. Multiple participants in Heatmap’s Insiders Survey cited ag tech companies Pivot Bio and Nitricity — both of which are pursuing alternate approaches to conventional ammonia-based fertilizers — as among the most exciting climate tech companies working today.
Studies estimate that fertilizer production and use alone account for roughly 5% of global emissions. That includes emissions from the energy-intensive Haber–Bosch process, which synthesizes ammonia by combining nitrogen from the air with hydrogen at extremely high temperatures, as well as nitrous oxide released from the soil after fertilizer is applied. N2O is about 265 times more potent than carbon dioxide over a 100-year timeframe and accounts for roughly 70% of fertilizer-related emissions, as soil microbes convert excess nitrogen that crops can’t immediately absorb into nitrous oxide.
“If we don’t solve nitrous oxide, it on its own is enough of a radiative force that we can’t meet all of our goals,” Rinzler said, referring to global climate targets at large.
Enter what some consider one of the most promising agricultural innovations, perhaps since the invention of the Haber–Bosch process itself over a century ago — Pivot Bio. This startup, founded 15 years ago, engineers soil microbes to convert about 400 times more atmospheric nitrogen into ammonia than non-engineered microbe strains naturally would. “They are mini Haber–Bosch facilities, for all intents and purposes,” Pivot Bio’s CEO Chris Abbott told me, referring to the engineered microbes themselves.
The startup has now raised over $600 million in total funding and is valued at over $2 billion. And after toiling in the ag tech trenches for a decade and a half, this will be the first full year the company’s biological fertilizers — which are applied to either the soil or seed itself — will undercut the price of traditional fertilizers.
“Farmers pay 20% to 25% less for nitrogen from our product than they do for synthetic nitrogen,” Abbott told me. “Prices [for traditional fertilizers] are going up again this spring, like they did last year. So that gap is actually widening, not shrinking.”
Peer reviewed studies also show that Pivot’s treatments boost yields for corn — its flagship crop — while preliminary data indicates that the same is true forcotton, which Pivot expanded into last year. The company also makes fertilizers for wheat, sorghum, and other small grains.
Pivot is now selling these products in stores where farmers already pick up seeds and crop treatments, rather than solely through its independent network of sales representatives, making the microbes more likely to become the default option for growers. But they won’t completely replace traditional fertilizer anytime soon, as Pivot’s treatments can still meet only about 20% to 25% of a large-scale crop’s nitrogen demand, especially during the early stages of plant growth, though it’s developing products that could push that number to 50% or higher, Abbott told me.
All this could have an astronomical environmental impact if deployed successfully at scale. “From a water perspective, we use about 1/1000th the water to produce the same amount of nitrogen,” Abbott said. From an emissions perspective, replacing a ton of synthetic nitrogen fertilizer with Pivot Bio’s product prevents the equivalent of around 11 tons of carbon dioxide from entering the atmosphere. Given the quantity of Pivot’s fertilizer that has been deployed since 2022, Abbott estimates that scales to approximately 1.5 million tons of cumulative avoided CO2 equivalent.
“It’s one of the very few cases that I’ve ever come across in climate tech where you have this giant existing commodity market that’s worth more than $100 billion and you’ve found a solution that offers a cheaper product that is also higher value,” Rinzler told me. BEV led the company’s Series B round back in 2018, and has participated in its two subsequent rounds as well.
Meanwhile, Nitricity — a startup spun out of Stanford University in 2018 — is also aiming to circumvent the Haber–Bosch process and replace ammonia-based and organic animal-based fertilizers such as manure with a plant-based mixture made from air, water, almond shells, and renewable energy. The company said that its proprietary process converts nitrogen and other essential nutrients derived from combusted almond shells into nitrate — the form of nitrogen that plants can absorb. It then “brews” that into an organic liquid fertilizer that Nitricity’s CEO, Nico Pinkowski, describes as looking like a “rich rooibos tea,” capable of being applied to crops through standard irrigation systems.
For confidentiality reasons, the company was unable to provide more precise technical details regarding how it sources and converts sufficient nitrogen into a usable form via only air, water, and almond shells, given that shells don’t contain much nitrogen, and turning atmospheric nitrogen into a plant-ready form typically involves the dreaded Haber–Bosch process.
But investors have bought in, and the company is currently in the midst of construction on its first commercial-scale fertilizer factory in Central California, which is expected to begin production this year. Funding for the first-of-a-kind plant came from Trellis Climate and Elemental Impact, both of which direct philanthropic capital toward early-stage, capital-intensive climate projects. The facility will operate on 100% renewable power through a utility-run program that allows customers to opt into renewable-only electricity by purchasing renewable energy certificates,
Pinkowski told me the new plant will represent a 100‑fold increase in Nitricity’s production capacity, which currently sits at 80 tons per year from its pilot plant. “In comparison to premium conventional fertilizers, we see about a 10x reduction in emissions,” Pinkowski told me, factoring in greenhouse gases from both production and on-field use. “In comparison to the most standard organic fertilizers, we see about a 5x reduction in emissions.”
The company says trial data indicates that its fertilizer allows for more efficient nitrogen uptake, thus lowering nitrous oxide emissions and allowing farmers to cut costs by simply applying less product. According to Pinkowski, Nitricity’s current prices are at parity or slightly lower than most liquid organic fertilizers on the market. And that has farmers really excited — the new plant’s entire output is already sold through 2028.
“Being able to mitigate emissions certainly helps, but it’s not what closes the deal,” he told me. “It’s kind of like the icing on the cake.”
Initially, the startup is targeting the premium organic and sustainable agriculture market, setting it apart from Pivot Bio’s focus on large commodity staple crops. “You saw with the electrification of vehicles, there was a high value beachhead product, which was a sports car,” Pinkowski told me. “In the ag space, that opportunity is organics.”
But while big-name backers have lined up behind Pivot and Nitricity, the broader ag tech sector hasn’t been as fortunate in its friends, with funding and successful scale-up slowing for many companies working in areas such as automation, indoor farming, agricultural methane mitigation, and lab-grown meat.
Everyone’s got their theories for why this could be, with Lara Pierpoint of Trellis telling me that part of the issue is “the way the federal government is structured around this work.” The Department of Agriculture allocates relatively few resources to technological innovation compared to the Department of Energy, which in turn does little to support agricultural work outside of its energy-specific mandate. That ends up meaning that, as Pierpoint put it, ”this set of activities sort of falls through the cracks” of the government funding options, leaving agricultural communities and companies alike struggling to find federal programs and grant opportunities.
“There’s also a mismatch between farmers and the culture of farming and agriculture in the United States, and just even geographically where the innovation ecosystems are,” Emily Lewis O’Brien, a principal at Trellis who led the team’s investment in Nitricity, told me of the social and regional divides between entrepreneurs, tech investors and rural growers. “Bridging that gap has been a little bit tricky.”
Still, investors remain optimistic that one big win will help kick the money machines into motion, and with Pivot Bio and Nitricity, there are finally some real contenders poised to transform the sector. “We’re going to wake up one day and someone’s going to go, holy shit, that was fast,” Abbott told me. “And it’s like, well you should have been here for the decade of hard work before. It’s always fast at the end.”
The most popular scope 3 models assume an entirely American supply chain. That doesn’t square with reality.
“You can’t manage what you don’t measure,” the adage goes. But despite valiant efforts by companies to measure their supply chain emissions, the majority are missing a big part of the picture.
Widely used models for estimating supply chain emissions simplify the process by assuming that companies source all of their goods from a single country or region. This is obviously not how the world works, and manufacturing in the United States is often cleaner than in countries with coal-heavy grids, like China, where many of the world’s manufactured goods actually come from. A study published in the journal Nature Communications this week found that companies using a U.S.-centric model may be undercounting their emissions by as much as 10%.
“We find very large differences in not only the magnitude of the upstream carbon footprint for a given business, but the hot spots, like where there are more or less emissions happening, and thus where a company would want to gather better data and focus on reducing,” said Steven Davis, a professor of Earth system science in the Stanford Doerr School of Sustainability and lead author of the paper.
Several of the authors of the paper, including Davis, are affiliated with the software startup Watershed, which helps companies measure and reduce their emissions. Watershed already encourages its clients to use its own proprietary multi-region model, but the company is now working with Stanford and the consulting firm ERG to build a new and improved tool called Cornerstone that will be freely available for anyone to use.
“Our hope is that with the release of scientific papers like this one and with the launch of Cornerstone, we can help the ecosystem transition to higher quality open access datasets,” Yohanna Maldonado, Watershed’s Head of Climate Data told me in an email.
The study arrives as the Greenhouse Gas Protocol, a nonprofit that publishes carbon accounting standards that most companies voluntarily abide by, is in the process of revising its guidance for calculating “scope 3” emissions. Scope 3 encompasses the carbon that a company is indirectly responsible for, such as from its supply chain and from the use of its products by customers. Watershed is advocating that the new standard recommend companies use a multi-region modeling approach, whether Watershed’s or someone else’s.
Davis walked me through a hypothetical example to illustrate how these models work in practice. Imagine a company that manufactures exercise bikes — it assembles the final product in a factory in the U.S., but sources screws and other components from China. The typical way this company would estimate the carbon footprint of its supply chain would be to use a dataset published by the U.S. Environmental Protection Agency that estimates the average emissions per dollar of output for about 400 sectors of the U.S. economy. The EPA data doesn’t get down to the level of detail of a specific screw, but it does provide an estimate of emissions per dollar of output for, say, hardware manufacturing. The company would then multiply the amount of money it spent on screws by that emissions factor.
Companies take this approach because real measurements of supply chain emissions are rare. It’s not yet common practice for suppliers to provide this information, and supply chains are so complex that a product might pass through several different hands before reaching the company trying to do the calculation. There are emerging efforts to use remote sensing and other digital data collection and monitoring systems to create more accurate, granular datasets, Alexia Kelly, a veteran corporate sustainability executive and current director at the High Tide Foundation, told me. In the meantime, even though sector-level emissions estimates are rough approximations, they can at least give a company an indication of which parts of their supply chain are most problematic.
When those estimates don’t take into account country of origin, however, they don’t give companies an accurate picture of which parts of their supply chains need the most attention.
The new study used Watershed’s multi-region model to look at how different types of companies’ emissions would change if they used supply chain data that better reflected the global nature of supply chains. Davis is the first to admit that the study’s findings of higher emissions are not surprising. The carbon accounting field has long been aware of the shortcomings of single-region models. There hasn’t been a big push to change that, however, because the exercise is already voluntary and taking into account global supply chains is significantly more difficult. Many countries don’t publish emissions and economic data, and those that do use a variety of methods to report it. Reconciling those differences adds to the challenge.
While the overall conclusion isn’t surprising, the study may be the first to show the magnitude of the problem and illustrate how more accurate modeling could redirect corporate sustainability efforts. “As far as I know, there is no similar analysis like this focused on corporate value chain emissions,” Derik Broekhoff, a senior scientist at the Stockholm Environment Institute, told me in an email. “The research is an important reminder for companies (and standard setters like the Greenhouse Gas Protocol), who in practice appear to be overlooking foreign supply chain emissions in large numbers.”
Broekhoff said Watershed’s upcoming open-source model “could provide a really useful solution.” At the same time, he said, it’s worth noting that this whole approach of calculating emissions based on dollars spent is subject to significant uncertainty. “Using spending data to estimate supply chain emissions provides only a first-order approximation at best!”
The decision marks the Trump administration’s second offshore wind defeat this week.
A federal court has lifted Trump’s stop work order on the Empire Wind offshore wind project, the second defeat in court this week for the president as he struggles to stall turbines off the East Coast.
In a brief order read in court Thursday morning, District Judge Carl Nichols — a Trump appointee — sided with Equinor, the Norwegian energy developer building Empire Wind off the coast of New York, granting its request to lift a stop work order issued by the Interior Department just before Christmas.
Interior had cited classified national security concerns to justify a work stoppage. Now, for the second time this week, a court has ruled the risks alleged by the Trump administration are insufficient to halt an already-permitted project midway through construction.
Anti-offshore wind activists are imploring the Trump administration to appeal this week’s injunctions on the stop work orders. “We are urging Secretary Burgum and the Department of Interior to immediately appeal this week’s adverse federal district court rulings and seek an order halting all work pending appellate review,” Robin Shaffer, president of Protect Our Coast New Jersey, said in a statement texted to me after the ruling came down.
Any additional delays may be fatal for some of the offshore wind projects affected by Trump’s stop work orders, irrespective of the rulings in an appeal. Both Equinor and Orsted, developer of the Revolution Wind project, argued for their preliminary injunctions because even days of delay would potentially jeopardize access to vessels necessary for construction. Equinor even told the court that if the stop work order wasn’t lifted by Friday — that is, January 16 — it would cancel Empire Wind. Though Equinor won today, it is nowhere near out of the woods.
More court action is coming: Dominion will present arguments on Friday in federal court against the stop work order halting construction of its Coastal Virginia offshore wind project.