You’re out of free articles.
Log in
To continue reading, log in to your account.
Create a Free Account
To unlock more free articles, please create a free account.
Sign In or Create an Account.
By continuing, you agree to the Terms of Service and acknowledge our Privacy Policy
Welcome to Heatmap
Thank you for registering with Heatmap. Climate change is one of the greatest challenges of our lives, a force reshaping our economy, our politics, and our culture. We hope to be your trusted, friendly, and insightful guide to that transformation. Please enjoy your free articles. You can check your profile here .
subscribe to get Unlimited access
Offer for a Heatmap News Unlimited Access subscription; please note that your subscription will renew automatically unless you cancel prior to renewal. Cancellation takes effect at the end of your current billing period. We will let you know in advance of any price changes. Taxes may apply. Offer terms are subject to change.
Subscribe to get unlimited Access
Hey, you are out of free articles but you are only a few clicks away from full access. Subscribe below and take advantage of our introductory offer.
subscribe to get Unlimited access
Offer for a Heatmap News Unlimited Access subscription; please note that your subscription will renew automatically unless you cancel prior to renewal. Cancellation takes effect at the end of your current billing period. We will let you know in advance of any price changes. Taxes may apply. Offer terms are subject to change.
Create Your Account
Please Enter Your Password
Forgot your password?
Please enter the email address you use for your account so we can send you a link to reset your password:
A new report from Rhodium Group takes stock of how Trump’s policies will affect America’s emissions future.

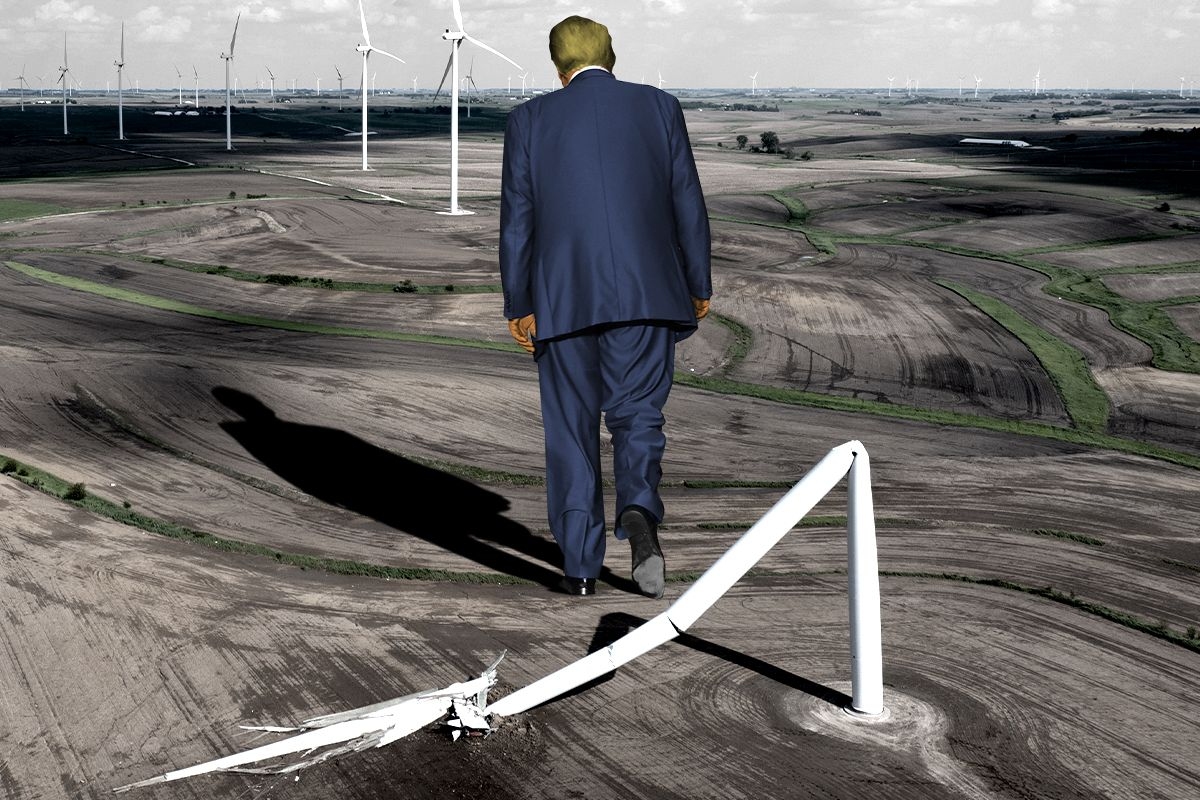
In less than a year, the Trump administration has fully transformed U.S. climate and energy policy. The changes have come through the tax code, regulatory repeals, and sweeping but fickle tariffs. Taken together, it means that the worst-case scenario for climate action under Biden has now become the best-case scenario under Trump.
That’s one of the key findings of the Rhodium Group’s latest Taking Stock report, an annual look at how U.S. policies will shape our energy system and emissions trajectory. It’s the first comprehensive assessment of the degree to which Trump’s second term, early as it is, could impede the energy transition. While total U.S. emissions are not expected to go up in the coming decade, the report projects greatly diminished progress compared to the path we were on a year ago.
That point is most clearly illustrated by the following finding: For the past two decades, the U.S. has been reducing emissions by an average of 1% per year. In the coming decade, Rhodium projects that Trump’s policies could reduce this rate by more than half.
Last year’s report, produced at the absolute peak of U.S. climate policy, modeled the effect of clean energy tax credits in the Inflation Reduction Act, new regulations on cars, trucks, power plants, and oil and gas operations, Biden’s freeze on new liquified natural gas export facilities, and a number of state-level policies. While these actions were not expected to be enough to fulfill Biden’s promise to the rest of the world under the Paris Agreement to cut emissions by 50% to 52% by 2030 compared to 2005, they represented America’s first credible show of climate leadership on the global stage. The report estimated that by 2035, we would be able to reduce greenhouse gas emissions 38% to 56%.
Now the low end of that spectrum has become overly optimistic. Rhodium has revised its estimate downwards to reflect revisions to the tax credits in the One Big Beautiful Bill Act — namely, the early end of subsidies for wind, solar, and EVs. The new report also takes into account tariffs, which primarily serve to reduce industrial activity in the U.S. in the near term, Congress’ cancellation of California’s vehicle emissions waivers, and Trump’s efforts to roll back greenhouse gas regulations. The result is that Rhodium expects emissions to decline by 26% to 35% by 2035.
The gap between this projection and last year’s represents about 800 million to 1.3 billion metric tons of carbon. On the high end, that’s roughly equivalent to the emissions from California, Texas, and Michigan combined.
The estimates are expressed as a range because the report looks at what would happen under three different scenarios. The highest emissions scenario models a world where oil and gas prices remain low, clean technology costs remain high, and the economy grows faster than current projections. The low emissions scenario is the opposite — it shows how Trump’s policies will affect our trajectory if oil and gas prices are higher, clean technologies see steeper cost declines and performance improvements, and economic growth is more aligned with current projections. The mid-emissions scenario splits the difference.
The most significant policies for shifting our emissions trajectory, according to Ben King, one of the report’s authors, are the combination of tax credits and regulations affecting the power sector. The regulations, in particular, mean the difference between having almost no coal plants on the grid by 2040 and retaining as many as 77 gigawatts of coal power by that date. “That’s still a massive decline in the amount of coal relative to what we have today,” King said, “but it is a very different-looking grid than if those regulations were to stay in place.”
Whether coal plants are replaced by clean energy or natural gas largely depends on the cost of each. Somewhat counterintuitively, the report projects less coal in the high emissions scenario because low natural gas prices mean that gas plants supplant both coal and renewables.
Even the forms of clean energy that the Trump administration supports, such as nuclear and geothermal, are not expected to play a significant role in reducing emissions over the next 15 years. For example, in the low emissions scenario, where oil and gas prices are high, about 2 gigawatts of new advanced nuclear is added to the grid in the 2030s. But because the tax credit for existing nuclear plants is set to expire in 2032, the models project that 2 gigawatts to 5 gigawatts of nuclear power will shut down in the 2030s, more than canceling out the additions.
The effect of unwinding transportation-related regulations and incentives is more straightforward — fewer EVs, higher emissions. Last year’s report projected that up to 72% of all light duty vehicle sales would be electric by 2032. The new report expects light duty EV sales to make up just 43% of the total, at most, by 2040. This is almost entirely due to the loss of greenhouse gas rules. If those remained in place, EV sales could reach 71% by 2040.
Perhaps the only bright side in the report is a section on household energy costs. The loss of tax credits for renewables and home efficiency upgrades will raise electricity bills compared to the projections in last year’s report. But despite that, Rhodium expects overall household energy costs to decrease in the coming decades — in all scenarios. That’s primarily due to the switch to electric vehicles, which lowers transportation costs for EV drivers and puts downward pressure on the cost of gasoline for everyone else.
No modeling exercise is perfect, and this one contains a number of caveats. One of the biggest points of uncertainty right now is how much energy demand from data centers will grow. The authors modeled just one pathway for data centers, with power demand nearly doubling by 2030 and more than tripling by 2040. But they note that analyst estimates fall as much as 80% higher or 80% lower. If demand turns out to be higher, “it would effectively turn up the dial on the trends that we’re seeing already,” King said.
Another area of uncertainty is that the Trump administration is working overtime to find creative new ways to stymie wind and solar development, as my colleague Jael Holzman has documented. It could turn out that these moves are even more effective than what Rhodium has captured in this report, King told me. With tariffs changing on a weekly, sometimes even daily basis, it was also difficult to capture how much of an impact they will have on technology prices, he said. Lastly, there’s a human behavior element that’s difficult for models to project.
“In the absence of government support, this is all going to happen on the basis of what private investors see as wise moves moving forward,” King said. “I don’t know the extent to which they might look at the uncertainty that the Trump administration is introducing for some of these technologies, and say, ‘Gosh, I’m going to avoid that for the foreseeable future, and maybe even beyond.’”
Log in
To continue reading, log in to your account.
Create a Free Account
To unlock more free articles, please create a free account.
Senator Martin Heinrich’s new bill, which would make it easier to hook up new power plants in much of the U.S., is an encouraging sign for bipartisan permitting reform.
An important part of a bipartisan permitting reform deal may be falling into place.
Senator Martin Heinrich of New Mexico introduced a bill on Thursday that would make it easier for new power plants to hook up to electricity markets across the country.
The legislation, which applies to all types of generation, would allow new power plants to connect to the grid without waiting for the arduous technical studies — and without paying the exorbitant equipment upgrade fees — now required in much of the country.
Instead, the bill would let power plants opt into a much faster safety study and offer what it cheekily dubs “basic access service for energy-only delivery” — that is, BASED service — to the local electricity market.
A similar approach is already used in Texas, which has added more new generation than any other U.S. power market in recent years. In effect, Heinrich hopes to bring that cheaper, faster, and more laissez-faire method to the rest of the country.
“As electricity demand grows, we need to find better, faster ways to add more affordable, reliable power to the grid,” Heinrich said in a statement. “Right now, unnecessary delays are slowing projects that could help lower energy costs and deliver the low-cost energy we need.”
Outside experts have pushed for wider adoption of Texas’s approach, which is dubbed “connect and manage,” for some time. Although Heinrich’s proposal would apply to all kinds of power plants, Texas has been particularly successful at bringing new solar, battery, and natural gas power plants online in recent years — and it has done so while keeping connection costs lower than other markets.
“We’re seeing the success of the free market in Texas,” Sarah Toth Kotwiss, an electricity researcher at the energy and climate think tank RMI, told me, noting the state has added far more generation in recent years than much bigger and more populous U.S. grid zones. “They’re leading the way, and replicating that free market attitude could go a long way in the rest of the U.S.”
More broadly, the proposal is the kind of legislation that would slot into the bipartisan permitting package expected later this year — and as soon as next month. Heinrich’s proposal may be a sign that the senator, the ranking Democratic member of the natural resources committee, takes the prospect of reaching a deal seriously.
Across much of the country, a new power plant can only connect to the power grid after the local grid operator completes what’s called an “interconnection study” — an intensive technical account of how that new plant will affect the overall system.
These studies examine a slew of worst-case scenarios, simulating how the plant would behave at full capacity under extremely congested grid conditions, such as during a heat wave. The new plant’s developer is then required to pay for the grid and transmission line upgrades that would allow their project to run at full blast at those moments of maximum stress.
In theory, that approach maximizes the amount of money a developer can make on a new power plant. But because the grid is a big, interconnected system, that method can cause long delays and rippling costs in practice. In one case, a new 300-megawatt plant in North Dakota near the Canadian border could not start operating until it paid nearly $3 million to upgrade power lines and transformers in Missouri — more than 1,000 miles away.
And because interconnection studies try to model a proposed power plant’s influence on the power grid for years into the future, a single cancellation can have a cascading effect. When a power plant pulls out of the interconnection queue, every project in line behind it sometimes needs to be studied again, causing delays and costs to spiral even further.
In one famous example, a solar and battery plant in Maryland was initially told that it needed to pay for $1.25 million to connect to the local grid. But after a series of cancellations and new rounds of study, that figure was revised — to nearly $72 million. The solar project got shelved.
While interconnection queues used to be relatively quick, the process of hooking up a new power plant to the grid can now regularly take eight years, Kotwiss said.
As I discussed with the electricity researchers Tyler Norris and Claire Waymer on Heatmap’s podcast Shift Key in 2024, these lengthening wait times have changed how power plant developers behave. Many developers now “spam the queue,” filing study requests for any project that they could ever conceivably want to build. That has led delays to spiral even further.
The end result of all this spamming is that the total capacity of power plants asking to connect to the grid now exceeds the size of the U.S. grid itself. At the end of 2025, more than 2,000 gigawatts of new generation or storage projects were waiting in interconnection queues, according to the Lawrence Berkeley National Lab. The country’s operating power plant fleet is only about 1,400 gigawatts.
To be clear, most of those proposed projects will never be built — they are hypothetical queries submitted by developers who are trying to claim a place in line. Yet even switching on a small set of plants could transform the power grid.
These long wait times aren’t the norm in Texas. In the Lone Star state, it takes less than four years to bring a new plant online.
That’s because new power plants in Texas can hook up to the grid — and start generating power — as soon as the local grid operator completes a more rudimentary engineering and safety study. Then during moments of peak grid congestion, power plants must curtail their own generation, reducing their electricity production to the level that the overall grid can support. While this means that a given solar farm or natural gas plant might not run at full bore all the time, the overall approach gets that plant up and running much sooner, allowing it to sell energy into the grid during most of the year.
Heinrich’s law would order electricity markets and grid operators to make this faster option available to new power plants across the country. It would let power plants opt into receiving a much simpler and faster study, one that checks only that adding the new power plant will be safe for the immediate grid.
A power plant that opts into the new BASED service would still have the option of entering the traditional interconnection queue. Doing so would let it eventually increase its operation over time, paying for grid upgrades so that it can participate in capacity markets and other auctions.
Expanding Texas’s approach to other states could help cut costs for electricity consumers by bringing more energy onto the market faster, Kotwiss said. Even in complicated power markets that include additional auctions — for capacity, for instance, or reliability — energy still makes up most wholesale costs.
It could also help ease the strains on the grid — especially in congested regions like the Mid-Atlantic — caused by artificial intelligence data centers and new factories.
The Texas-inspired technique could help the solar and battery industries, because it keeps a given project’s upfront expenses low and allows those technologies’ low costs to dominate their economics. Solar has boomed in Texas in recent years, and the state now has more utility-scale solar installed than California does.
But the BASED approach would likely help natural gas plants and other forms of newer, cheaper generation, too, because it strengthens new entrants as compared to incumbents. Jacob Mays, a Cornell engineering professor, has studied how slow and wonky interconnection queues can prevent electricity markets from functioning well. The existing interconnection approach used in most of the country “amounts to a significant barrier on new entry to new generation,” he told me, and it has “some anticompetitive impacts.”
Heinrich has said that he plans on introducing more electricity system reforms soon, including a bill to push utilities to adopt technologies that get more capacity out of their existing equipment.
I think it’s an encouraging sign for permitting reform advocates that ranking Senate Democrats are advancing these kinds of technology-neutral power market bills. An eventual deal will likely ultimately rest on Democrats’ willingness to support policy like this — and whether they can strike a deal with Republicans to rewrite parts of long-standing environmental or permitting laws, including the National Historic Preservation Act and Clean Water Act.
But just as importantly, it will depend on Republicans — and the White House — reining in President Trump’s powers to kill energy projects by fiat. With this bill, Democrats are suggesting they’re willing to be, well, a little BASED. Whether the president will join them remains to be seen.
Your mileage may vary — but you’ll probably want to keep the outdoor runs to a minimum.
I became a runner in the spring of 2020. My run streak was my sourdough starter. Those were the Wild West days of respiratory spray warnings, when I’d get dirty looks from strangers even if I passed them while wearing my Under Armour running mask. But I wasn’t about to let a deadly pandemic — much less the wildfire smoke that descended on New York that fall — get in the way of logging my miles.
These days, I am at least a little bit older and wiser. I’ve also learned a lot about wildfire smoke in the interim — how it kills more than 20,000 people in the U.S. every year, how there’s a lot of freaky stuff in it that you don’t want in your body, and how there’s no safe threshold for exposure. But while it’s clearly a bad idea to go for a run right now if you live in Milwaukee, where the air is literally yellow due to the fires in Minnesota and Ontario, it’s maybe less clear if you’re somewhere where the AQI is still only moderate or “unhealthy for sensitive groups.” Do you really, actually need to skip your run in those conditions? Can you just go to the gym instead?
At the end of the day, everyone should make decisions based on their own risk tolerance. But John C. Quindry — a professor of integrative physiology and athletic training at the University of Montana, who described his team as “first to the party” when it comes to understanding the risks of exercising in the smoke — said his research shows that not only is exercising in the smoke hazardous to otherwise healthy individuals, there’s also a class of people for whom it might be extra dangerous, and they might not even know it.
Our conversation has been edited and condensed for clarity.
Why is exercising in the smoke worse than, say, commuting in the smoke?
If you exercise, you take more breaths per minute, and you take deeper breaths, so the total volume of air you breathe at a given time is greater.
Inhaling wildfire smoke is sometimes compared to smoking cigarettes. Some back-of-the-envelope math puts a run in Chicago this morning at the equivalent of smoking a couple of cigarettes, which sounds pretty minimal. Why take this seriously?
We don’t know for sure that when you exercise outside, it’s equivalent to, in this case, smoking a couple of cigarettes or a pack. We’ve been working for years trying to actually figure out how bad it is, and we just don’t know.
One of the things that complicates this is that not all smoke is created equal. Wildfire smoke in the West is different from wildfire smoke east of the Mississippi, where there are many different types of vegetation. And separately, if a wildfire consumes a house and all the plastics, organic solvents, and things in the roof, that’s certainly worse than just biomass burning — and that is all separate from cigarette smoke. So the chemicals that you inhale are part of it; it’s not just the particulate.
I don’t think it’s inappropriate to say we know how much particulate a filtered cigarette is going to deliver on a puff-by-puff basis and try to equate it to inhaling wood smoke or being downwind of a fire event. Those back-of-the-envelope calculations can make it one-to-one. But what is the impact on health? We don’t know.
Going back to something you said, is smoke in the West or East worse? Why?
We don’t really know, and one reason is that smoke that starts in the West goes east. There are some really good studies that look at the rates of emergency room visits and deaths downwind of fires. You can apply some pretty fancy math, and it’s clearly demonstrated by multiple research groups that whatever the source of the smoke is, there are people who are extra sensitive to it, and they show up in the emergency room more frequently. Tragically, to a smaller degree, they also occasionally die more frequently.
But if we put those data aside and say, “What does the smoke look like from Western biomass versus Eastern biomass?” We know the Western biomass, at least this time of year, is much drier. And when it’s dry, it tends to burn a little “cleaner,” which is to say, if you were to take a certain number of grams of pine wood — which burns fairly cleanly — how much PM 2.5 do you get? You’re going to get a higher PM 2.5 from wet wood. That’s the effect when you start to move to the middle or eastern part of the country. Deciduous trees, even when they’re dry, put out more PM 2.5 unit by unit.
Now, is that worse for the body in the short or long term? We really don’t know. Once you breathe in the smoke, it’s pretty easy to measure what’s in the blood: You just take a blood sample before and after the exposure. You can try to gauge how bad the smoke is by looking at what appears in the blood. Do you get oxidative stress? Do you get inflammation? Is there something else there? Has it changed metabolism?
We also look at exhaled breath condensate. It’s the immune cells, which are the first line of defense when you’re exposed to particulates, that are really sounding the alarm. In some people, that alarm gets sounded more than in others. So we’ve been trying to figure out what are these subtle but important biochemical and physiologic signals? How do they go together? They tell us how bad the smoke is, but it’s taken us years to unfold this story.
I saw in your 2025 study that half of your participants had a heightened response to physiological stress, and that you selected them for that reason. I was hoping you could tell me what a “heightened response to physiological stress” means and why it was important to include those candidates.
This is critical. Let me give you the backstory. When we would do these studies, we would put participants in the lab and burn Western locally sourced pine dried out to 15% humidity. We’d burn it carefully, measure the dose of PM 2.5, and have people breathe it in. We’d conduct studies before and after exercise, whether on a bike or a treadmill, and we varied the intensity and duration. And we didn’t find very much when we looked at the blood and exhaled breath condensate for how well the blood vessels constrict or how reactive the body’s autonomic nervous system was in controlling cardiovascular function. We’d find subtle changes, but statistically speaking, we could never really draw firm conclusions.
But we would notice that, on a person-by-person basis, there would be notable spikes in what we were looking at. We’d see, “Oh, these three or four people really seem to have this notable response, and everybody else really didn’t.” We’d publish our studies and essentially say, “Yeah, we didn’t find much.” It was honest data, and people believe it when you publish negative data that says, “We went through that much trouble, we spent $100,000, and we found nothing.” But we found these people who were a little bit different than the others.
So we’d sit around and spitball. These were normal people, by the way; we were not taking asthmatics or people with [chronic obstructive pulmonary disease]. They were not diabetic. There are people we know full well will have an exaggerated response, and we didn’t look at any of them. We looked at what are called “apparently healthy people” — the people who go to the physician and are told nothing’s wrong with them.
My doctorate was not in exercise science; it was in biomedical science, from a medical school environment. Somewhere along the line, I was exposed to something called the cold pressor test. It has been around longer than both of us. Physicians 80 years ago would have somebody come into their lab or clinic, and they’d say, “Hey, we’re going to put your hand in a bucket of ice water for two minutes and see what that does to your blood pressure.” It almost sounds like a fourth-grade sleepover prank for the first kid to fall asleep.
But we started doing the test, and we took a pretty conservative approach, meaning that if we put someone’s hand in the ice water and their systolic blood pressure — that’s the top number, 120 over 80 is sort of the high end for good blood pressure — and if their systolic number went to at least 20 millimeters of mercury, then we call them cold pressure test positive, or CPT positive.
None of these were people who were hypertensive. They had normal blood pressure. Nothing was wrong with them as far as their medical team could observe. But how many of these [CPT positive] people are sitting around? If you take the average population, 10% to 15% will be cold pressor test positive. We don’t necessarily know if this is a bad thing. It may be contextual, but these are people we can verifiably measure with something as simple as a blood pressure cuff and a bucket of ice water. You can verify their physiology is more reactive within a couple of minutes than someone else’s.
We suspected that if we took these people and then exercised them in the smoke, they would have an exaggerated response compared with people who weren’t CPT positive. And so that’s what we did, and that’s what we found.
That’s fascinating. So the practical takeaway is, unless you’ve done this test yourself, you don’t know if you’re one of these people who’s particularly reactive to wildfire smoke?
You have to always be careful that you don’t make big, broad, blanket applications from one study. We would need to confirm or refute it with additional studies, and that’s a matter of getting grant money and conducting those next-generation investigations.
But here’s something we can glean: We know that people who have an exaggerated response to a cold pressor test are more likely to have hypertension. And they’re more likely to have it earlier — instead of getting high blood pressure at 50, 60, or 70, they’re going to get it at 30 or 40. We know they’re more likely to eventually suffer from heart failure; it seems to develop more in people who have this sort of reactive response. While the cold pressor test response is not predictive in and of itself of anything — future diabetes, heart failure, heart attacks, hypertension, none of that — people with all of those conditions are more likely to be cold pressor test positive.
The way I would take it is, if you are somebody who is not in great health, isn’t fit, or if you have creeping blood pressure or a family history of heart disease, blood pressure, or metabolic derangement like diabetes, you are the kind of person who needs to be a little bit more careful [in the smoke].
Is there an air quality level at which you would tell a young, healthy person “Don’t go for your morning run?”
An educated guess is the best we can do right now. Every study is a brick in the bigger metaphorical wall of understanding this. What we can say is: If you are young and apparently healthy, the threshold would be maybe even up into the “unhealthy for sensitive groups” number. They’re probably okay. But then again, how hard are they working? How long are they outside? If you’re working very hard, your ventilatory rate is much, much higher. And how long are you staying out? What is the long-term impact year after year?
There are epidemiologic studies that can demonstrate that if you’ve lived downwind from major wildfire events for decades, it’s going to impact your health. That’s not debated. But what is the short-term impact? We don’t know.
Indoor air pollution is a major issue during these events, too. Would you advise someone to skip the gym on a particularly smoky day?
When it’s smoky outside, it makes sense to say, “Let’s just stay indoors.” But then the question is, is some of that smoke getting indoors? Sure enough, it is. Then the question is, how much? And the answer is, it depends on the air handling systems in the building; how many people are coming in and out; whether the windows open; how many doors are there; are they left open; what are they using to heat and cool the place; do they have high-volume HEPA filtration; and are they changing that filtration?
But let’s dial back. We have two ends of a spectrum. You have a leaky building. Doors are open. Windows are open. Lots of people are coming in and out. In that scenario, the air inside is only about 20% or 30% better than the air outside. And that’s not very good.
But then let’s go to the other end of the spectrum, to a building that is being kept shut. They’re controlling who can come in and out, and there are two sets of doors to help buffer that. Which is better in a smoky situation? The places with the HEPA filtration, high-volume air turnover, and where they change the filters. But in that case, you’re still going to have 25% of that particulate matter inside, even if you can’t perceive that it’s there. That’s not good news.
What are the health risks? How can I protect myself? And will my plants be okay?
If you live anywhere near the Great Lakes or Mid-Atlantic (or certain parts of the Mountain West), odds are it’s smoky where you live. Wildfires raging in western Ontario are sending smoke cascading south and east across the U.S., prompting widespread air quality alerts affecting millions of Americans.
The good and — very bad — news is that we’ve been here before. Here’s a look back at some of Heatmap’s coverage from the summer of 2023, when smoke produced by forest fires in Quebec blanketed 128 million people in a murky haze and turned the New York City skyline an ominous shade of orange.
One day — even just one hour — of smoke inhalation can exacerbate pre-existing health conditions and increase an individual’s chance of premature death by 12%. To stay safe, Jeva Lange recommends avoiding prolonged outdoor exposure and masking up when you go outside.
Wildfire smoke is full of tiny pollutants that can leak into your apartment even when the windows and doors are sealed tight. That’s where air purifiers come in, Matthew Zeitlin writes.
Tinted skies are now a rare, remarkable event. But decades ago, before targeted policy interventions, this was everyday life for New Yorkers. Here’s Jeva with more on the legacy of the Clean Air Act.
Before you step out for a run, read Emily Pontecorvo’s guide to what the Air Quality Index is and isn’t telling you.
People should not inhale smoke because of its dangerous health effects. But plants, interestingly, may actually thrive. Allow Jeva to explain.