On December 8, 1953 — just eight years after the United States demonstrated the destructive power of splitting atoms in the form of a mushroom cloud over Hiroshima — then-President Dwight D. Eisenhower pledged to lead the world in harnessing fission to constructive ends. In his famed “Atoms for Peace” speech, he vowed to help other nations build nuclear power stations that he believed would bring about a new era of global prosperity built atop a foundation of abundant electricity. Under the law Congress passed the next year to lay the groundwork for a nuclear buildout, Washington didn’t make it easy for foreign countries to import American technology. Before any U.S. nuclear company can sell its wares abroad, the Senate needs to approve what’s known as a 123 Agreement, essentially a treaty in which the partner nation agrees not to use the technology for weapons proliferation. When Abu Dhabi set out to build the Arab world’s first nuclear power station, the U.S. struck a new, special 123 Agreement with the United Arab Emirates in 2009, in which the Gulf monarchy swore off ever enriching or recycling its own fuel. That deal became the gold standard for U.S. nuclear pacts — and one Washington had planned to make a requirement for any other countries in the region. Saudi Arabia, however, wasn’t happy with those restrictions, particularly as its rival Iran pressed ahead with construction of its second and third reactors at its debut Russian-made nuclear station. With the Biden administration putting up resistance, Riyadh began flaunting talks with Beijing to buy Chinese reactors, in what would mark a major entry of the People’s Republic into the nuclear export market.
All of which you needed to know to appreciate what a huge deal the latest news is. On Wednesday, The Wall Street Journal, The New York Times, and the Associated Press confirmed that Saudi Arabia had reached a deal with the Trump administration that would likely allow Riyadh to enrich and recycle its own fuel on its soil. While a formal announcement is expected this week, Secretary of State Marco Rubio already acknowledged the deal by telling reporters any such agreement would not lead to weapons proliferation. On the face of it, the deal is a major win for the U.S. over its arch adversaries. Russia dominates global nuclear exports, and is currently building the debut plants in Bangladesh, Egypt, and Turkey. China, meanwhile, has dramatically brought down the cost and time it takes to build its own domestic reactors, which are based on the leading American design, and Beijing is widely expected to make an export push in the coming years. The U.S. has managed to win deals in Eastern Europe to build Poland’s first nuclear plant. But so far, American technology has struggled to compete on both price and construction competence. A moment when Iran is firing missiles at America’s Arab allies may seem ill-suited to embarking on a civilian nuclear program, but the Atlantic Council researcher Allison Minor, who previously served as a U.S. deputy special envoy to Yemen, said the war had added urgency to brokering the Saudi-U.S. deal. “By keeping the door open for uranium enrichment inside Saudi Arabia, the nuclear deal sends a powerful message to Tehran,” she wrote in a blog post. “By securing a 123 agreement that appears to have more preferable terms than the United Arab Emirates and dozens of other U.S. partners have committed to, Riyadh also signals its role as a major global player, even if it is not among the ranks of nuclear-armed nations.”
2. Utilities are signing onto Trump’s power pledge for data centers
In March, the White House organized a voluntary industry pledge in which hyperscalers and data centers developers promised to pay above and beyond the normal rate for electricity to ease the strain on Americans. On Thursday, the Trump administration plans to announce a vast expansion of the pact to include the nation’s largest utilities, Reuters reported. Utilities NextEra Energy and Duke Energy joined data center developers Equinix and Digital Realty along with roughly 200 other entities on a list of signatories The Wall Street Journal obtained.
The move comes a day after ratepayer advocates accused the Federal Energy Regulatory Commission of failing to address the cost of upgrading infrastructure in its latest order meant to ease the impacts of data centers, Utility Dive reported. Polling from Heatmap Pro has shown repeatedly that public support for data centers is collapsing.
3. Trump poised to step in as Colorado River reservoirs drop to record lows
The Colorado River’s largest reservoirs, Lake Mead and Lake Powell, hit record lows in what experts described to the Los Angeles Times this week as a “five-alarm fire.” On Tuesday, Secretary of the Interior Doug Burgum met with the governors of seven states virtually ahead of his agency’s anticipated release of a plan to cut back on water use to ease shortages. That states appear to be welcoming a federal intervention marks a break with more than a century of Western states fighting to manage their water supplies among themselves with minimal oversight from Washington. Yet “far from a brash commandeering of the system,” E&E News reported, Burgum’s plan “is effectively a kick-the-can exercise for managing the drought-riddled river that supplies water” for one in 10 Americans. “At best, the Trump administration’s plan will leave economies — from the bucolic ranches of the Rocky Mountains to the mansions of Los Angeles, the tech hub of Phoenix and the powerhouse farms along the border with Mexico — in a state of limbo, without clear rules for who will have access to vital supplies in the years to come,” reporter Annie Snider wrote. “At worst, it dares the region’s political leaders — most especially Arizona Governor Katie Hobbs, who is facing one of the country’s closest gubernatorial races in the fall — to launch a destabilizing court fight.” As former Heatmap reporter Neel Dhanesha wrote in 2023, sometimes plans can at least buy some time.
Sign up to receive Heatmap AM in your inbox every morning:
4. The U.S. is preparing for offshore nuclear energy projects
Russia officially kicked off the global race for small modular reactors in 2019 with the launch of its first floating nuclear station, which is still pumping out power in an Arctic port today. Since then, dozens of companies have proposed small reactors on land, and a handful of startups has looked to build nuclear-propelled civilian ships. But no one has really attempted any major offshore nuclear energy projects yet. Still, the Trump administration is preparing for the potential new sector. On Wednesday, the Department of the Interior’s Marine Minerals Administration — the agency recently formed out of combining the Bureau of Ocean Energy Management with the Bureau of Safety and Environmental Enforcement — signed a memorandum of understanding with the Nuclear Regulatory Commission to “responsibly respond to industry requests” and support new technologies.
“Submerged reactor systems have been safely deployed in naval applications for decades, demonstrating their potential as a reliable source of energy in demanding marine environments,” Matt Giacona, the acting director of the Marine Minerals Administration, said in a statement. “While no commercial deployment on the Outer Continental Shelf is planned or approved at this time, it could greatly strengthen America’s energy security in the future.”
5. China’s new solar regulations seek to upgrade the supply chain
China unveiled a new set of rules for the solar industry last week that are expected to “do a good job in cutting out low-cost, outdated technology across the value chain,” according to a new report from the research division at the magazine PV Tech. The new national regulations, set to take effect on January 1, 2027, phase out weaker panels and conventional polysilicon products. “These new restrictions are very interesting as the Chinese government now sees a need to stop the oversupply, maybe coming from lowered deployment in China in the first half of the year,” Joe Hennessy, co-author of the report and analyst at PV Tech Research, told PV Tech. “This will affect the smaller producers the most, as they are less likely to have upgraded lines during the period of losses.” Larger solar manufacturers are already producing panels with efficiency rates of up to 24%, the report found.
This is a story I’m planning to keep a close eye on, given the forthcoming results of the Department of Commerce’s 232 investigation into whether domestic U.S. producers of polysilicon need new tariffs to protect them against Chinese imports. My best-placed sources say the agency is on track to release its findings by next month, though others close to the process say the 74-day government shutdown could give the administration until early September to meet its legal deadlines.”
THE KICKER
Koloma, the startup seeking to tap into naturally occurring hydrogen deposits, has a third exploration deal in the Philippines. On Thursday, Heatmap editorial fellow Ameya Hadap broke news that the company has inked an agreement for exclusive rights to a roughly 817-square-mile area of Luzon’s Zambales Province. The Colorado-based firm now has the rights to more than 1,600 square miles of the country.


 Jeep/Stellantis
 Jeep/Stellantis


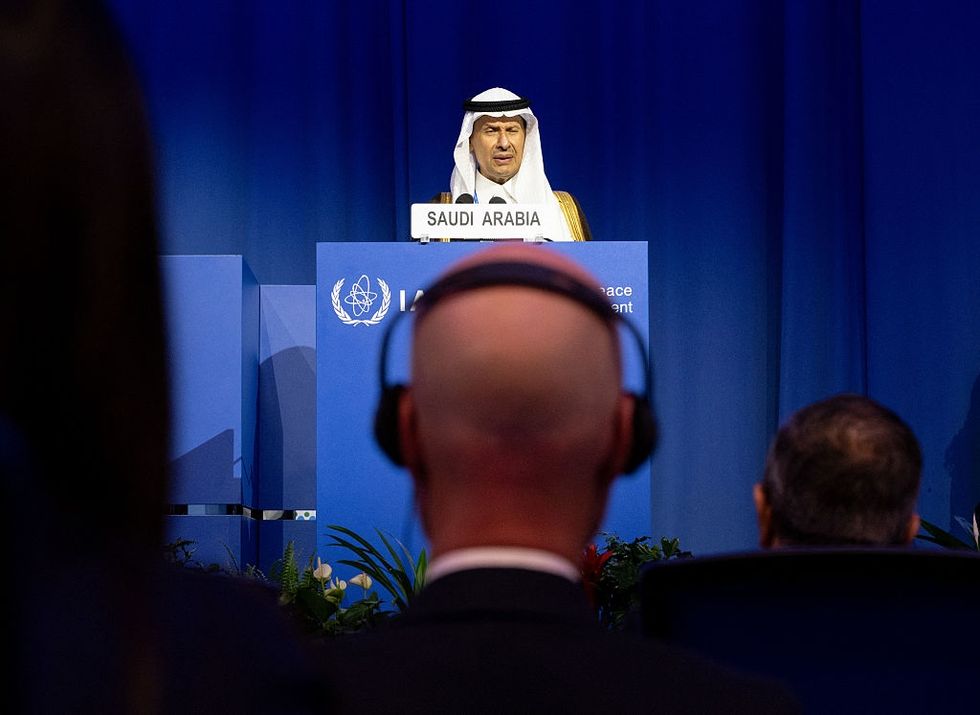 Saudi Arabia's Minister of Energy Prince Abdulaziz Bin Salman speaks at last year’s International Atomic Energy Agency plenary. JOE KLAMAR/AFP via Getty Images