The United Nations has published its first report card on the world’s progress meeting the climate goals under the Paris Agreement.
Although the agency doesn’t give a letter grade, the overwhelming message is clear: The world is not a pleasure to have in class. Countries are still failing to hit the goals that they set for themselves under the Paris Agreement in 2015.
Despite recent climate initiatives and new laws in the United States, China, and Europe, the world is not on track to limit global warming to 2 degrees Celsius by the end of the century. And it is nowhere close to keeping average temperatures from rising 1.5 degrees, which has become a threshold for near-term climate danger.
The new assessment captures something important but often overlooked about the Paris Agreement. The treaty is largely nonbinding: It imposes no pollution-related restrictions on its members. But what it prescribes, instead, is a process. For the first time ever, that process is about to enter a new stage.
Here is how the Paris process works: Every five years, each country must submit a detailed pledge saying how much it will cut its greenhouse-gas emissions in the years to come. (These are called “Nationally Determined Contributions,” or NDCs.) A few years after that, the world engages in a “global stocktaking,” a review of how much progress has been made toward those goals and how far off humanity is from its climate goals. Then two years later, each country submits a new, more ambitious plan.
The 2023 UN climate conference, which will happen in Dubai, will see the first of these “global stocktakes.” It is meant to set the stage for 2025, when countries will formally update their Paris Agreement plans.
Last week’s report is written largely in UN-ese, a somewhat bland series of pledges and phrases that leave one with the impression that somebody should do something about all the emissions. It emphasizes that “radical decarbonization” is now needed, which will involve a rapid scale-up of renewable energy, the broad electrification of transport, and a phase-out of all “unabated” fossil fuels.
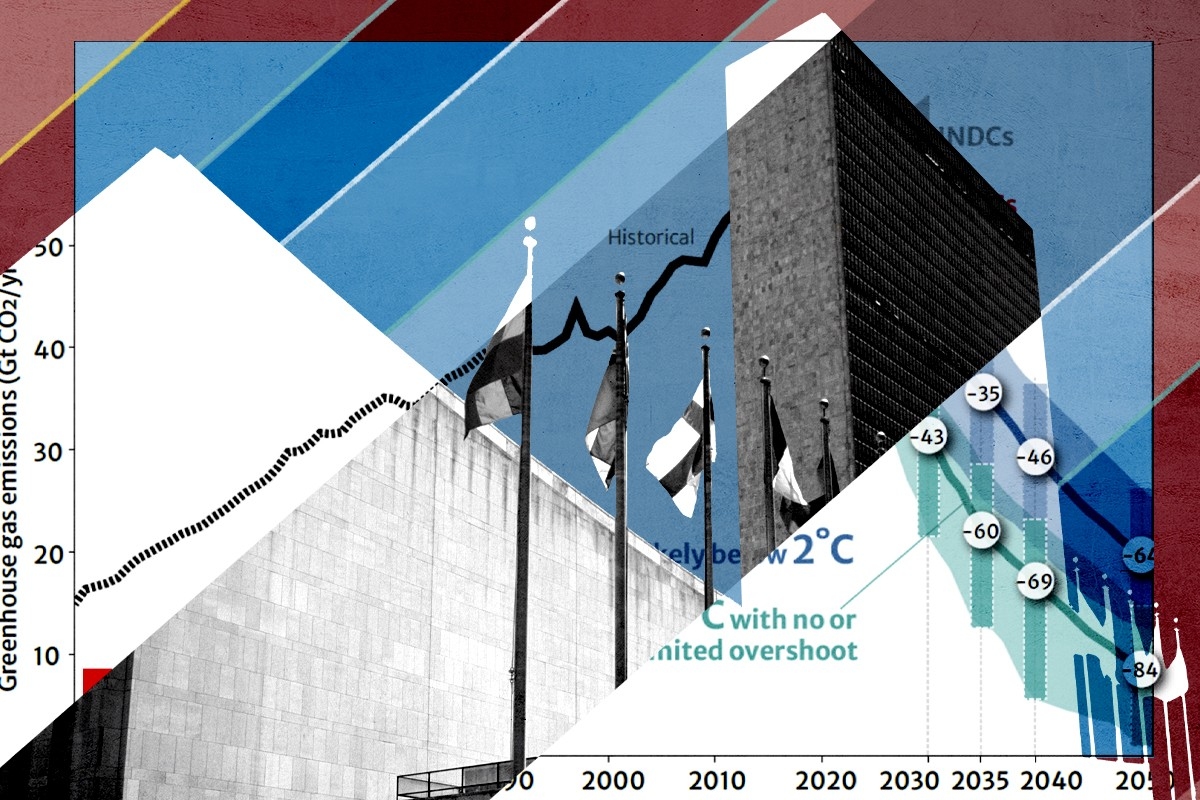
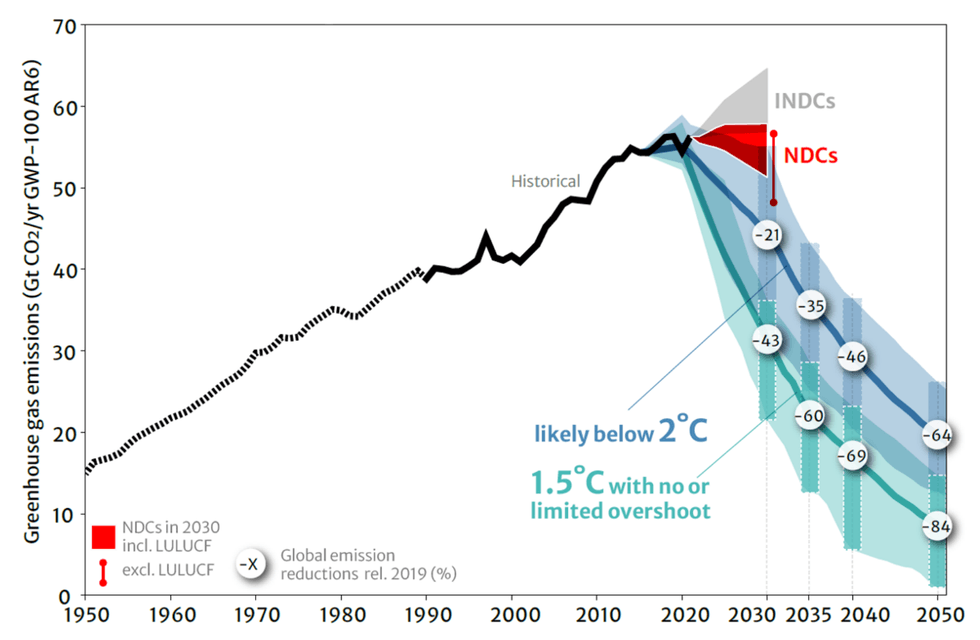
But perhaps most importantly, the report contains a helpful graph that dramatizes just how far the world remains from its most ambitious climate goals.
How climate pollution has risen since 1950 — and how it must soon fall
 Courtesy of the United Nations
There are a few lessons in this chart:
Meeting the Paris Agreement goals will be extremely difficult. Since 1850, the world has steadily put more and more carbon pollution into the air every year. Decade after decade, that trend line has only ever gone up. In 2023, roughly 50 gigatons of carbon dioxide — or about 110 trillion pounds — will stream into the atmosphere from human-related activities.
Yet to meet the Paris Agreement goals, that two-century mega-trend must not only end, but almost immediately reverse itself. To have the best chance of hitting the Paris targets, global greenhouse-gas emissions must peak by the end of 2025 — scarcely more than two years away.
As soon as emissions peak, they must fall precipitously. In order to hit the 1.5 degree goal, for instance, annual global carbon pollution must fall by 48% by 2030, compared to its 2019 level.
Even the world’s most ambitious climate pledges still won’t meet the Paris Agreement goals. The world has made tremendous progress since 2010, when climate change looked likely to cause 3.7 to 4.8 degrees Celsius, equal to about 7 to 9 degrees Fahrenheit, of warming by the end of the century. That would have been catastrophic.
Today, scientists project temperatures to rise to something like 2.5 degrees Celsius, or about 4.5 degrees Fahrenheit, above their pre-industrial levels.
But that still won’t be enough to hit the Paris goals. Look at the red range in the chart labeled “NDCs,” the plans that countries must submit under the Paris Agreement. Although it’s not in the chart, the text of the report provides details about how much these NDCs will actually reduce emissions.
When you take these NDCs together, they suggest that the world could keep global warming to 2.1 degrees Celsius. And if countries’ long-term targets are taken into account, and the most optimistic assumptions are applied, then global temperatures may rise as little as 1.7 degrees Celsius by the end of the century.
But those long-term plans remain speculative, and an “implementation gap” remains between what the world has promised to do and what its policies actually say will happen. And in any case, even those ambitious plans won’t bring the world to the 1.5-degree goal.
Reducing emissions, on a year-over-year basis, will be even harder. Fossil fuels remain the primary industrial energy input to the global economy. As you can see from the chart, global emissions have never seriously plateaued for any length of time, and they remain largely coupled to the global economy. (The most recent big dip in annual emissions was caused by the Covid recession.)
That’s because almost all energy development is additive: Although we think of types of energy as displacing each other — so that renewables replace natural gas, say, or coal replaced wood fires — humanity has largely added energy capacity since the dawn of the Industrial Revolution. The world burned more coal last year than it ever has before. Although statistics are more scarce, biomass consumption — wood-burning — is said to also be at an all-time high.
There are positive signs. As the report notes, 10- and in some cases 100-fold declines in the cost of solar panels, wind turbines, and batteries have seen new renewable technologies get rapidly deployed over the past decade. But the world is not moving fast enough.
And perhaps that’s the most upbeat way to see the report card: The age of planning and innovation has ended, the UN is saying. The world of scaling and deployment is about to begin.


 Courtesy of the United Nations