You’re out of free articles.
Log in
To continue reading, log in to your account.
Create a Free Account
To unlock more free articles, please create a free account.
Sign In or Create an Account.
By continuing, you agree to the Terms of Service and acknowledge our Privacy Policy
Welcome to Heatmap
Thank you for registering with Heatmap. Climate change is one of the greatest challenges of our lives, a force reshaping our economy, our politics, and our culture. We hope to be your trusted, friendly, and insightful guide to that transformation. Please enjoy your free articles. You can check your profile here .
subscribe to get Unlimited access
Offer for a Heatmap News Unlimited Access subscription; please note that your subscription will renew automatically unless you cancel prior to renewal. Cancellation takes effect at the end of your current billing period. We will let you know in advance of any price changes. Taxes may apply. Offer terms are subject to change.
Subscribe to get unlimited Access
Hey, you are out of free articles but you are only a few clicks away from full access. Subscribe below and take advantage of our introductory offer.
subscribe to get Unlimited access
Offer for a Heatmap News Unlimited Access subscription; please note that your subscription will renew automatically unless you cancel prior to renewal. Cancellation takes effect at the end of your current billing period. We will let you know in advance of any price changes. Taxes may apply. Offer terms are subject to change.
Create Your Account
Please Enter Your Password
Forgot your password?
Please enter the email address you use for your account so we can send you a link to reset your password:
On Nationally Determined Contributions, hurricane damage, and PFAS pollution.
Current conditions: Tropical Storm Dana touched down in India with 70 mile-per-hour winds, causing 600,000 people to be evacuated • Parts of the Northwestern U.S. and Canada’s British Columbia may see snow this weekend • Dallas is on track for its second-hottest October on record.
Only dramatic action on emissions over and above existing policy and pledges will keep warming below the targets set in the Paris Agreement,
according to this year’s United Nations Emissions Gap Report released on Thursday.
“Unless global emissions in 2030 are brought below the levels implied by existing policies and current [Nationally Determined Contributions], it will become impossible to reach a pathway that would limit global warming to 1.5°C with no or limited overshoot,” the report said. Policy goals “must deliver a quantum leap in ambition in tandem with accelerated mitigation action in this decade.”
Greenhouse gas emissions rose by 1.2% in 2023, which is faster than the annual average rate of change in the 2010s. Current policies would likely deliver 2.9 degrees of warming by 2100, while warming might be limited to around 2.5 degrees if countries meet the policy commitments they’ve already made.
President Donald Trump withheld disaster aid following devastating wildfires in Washington State in 2020 due to his disagreements with Governor Jay Inslee over climate and Covid-19 policy, E&E News reported. Trump “refused to act on Gov. Jay Inslee’s request for $37 million in federal disaster aid because of a bitter personal dispute with the Democratic governor,” reporters Thomas Frank and Scott Waldman wrote. President Biden approved the request for aid in early February, 2021. The reporters wrote earlier this month that Trump had similarly waffled on disaster aid for California in 2018, only changing his mind after aides showed him how many votes he got in Orange County.
Natural gas production from shale, the “tight” rocks that nearly always require hydraulic fracturing for gas production, has declined in the United States over the first nine months of the year, and may show its first annual decline since the Energy Information Administration started tracking shale production in 2000.
Shale production fell over 1% through September, according to EIA data, to just over 81 billion cubic feet per day. The production declines are specific to geological formations in Texas and Louisiana, as well as the Appalachian Basin. They are likely driven by declining natural gas prices, which fell to record lows earlier this year.
As many as 95 million people in the United States may rely on groundwater contaminated with PFAS, the perfluoroalkyls and polyfluoroalkyls otherwise known as “forever chemicals.”
The United States Geological Survey study published in Science looked at the lower 48 states and used a predictive model to estimate how many people may have exposure to PFAS in their drinking water. The researchers first collected samples from “principal aquifers” — the large geologic formations that contain much of the nation’s groundwater — and then used those samples to predict PFAS concentrations throughout the drinking water system. The highest observed PFAS concentration was found in southern Florida.
PFAS can cause a range of negative health effects, including “kidney and testicular cancer, decreased fertility, elevated cholesterol, weight gain, thyroid disease, the pregnancy complication pre-eclampsia, increased risk of preterm birth and low birth weight, hormone interference, and reduced vaccine response in children,” as my colleague Jeva Lange wrote earlier this year. The model “indicate[s] widespread occurrence of PFAS in groundwater at depths of public and domestic drinking-water supplies,” the USGS researchers write.
Damages from Hurricane Helene in North Carolina alone have added up to $53 billion, the state’s governor Roy Cooper said. The costs are the hurricane-prone state’s largest ever from a storm, and about three times the repairs from Hurricane Florence in 2018. Nearly 100 people were killed by the storm in North Carolina, with some still missing. Cooper requested almost $4 billion from the state legislature “to begin rebuilding critical infrastructure, homes, businesses, schools, and farms damaged during the storm.”
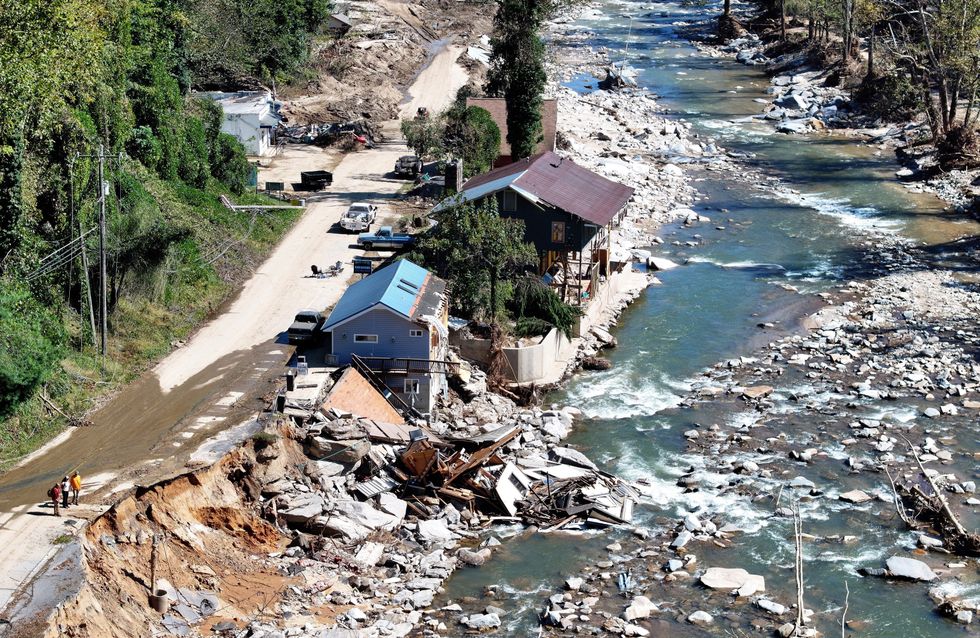
The aftermath of Hurricane Helene in North Carolina. Photo by Mario Tama/Getty Images
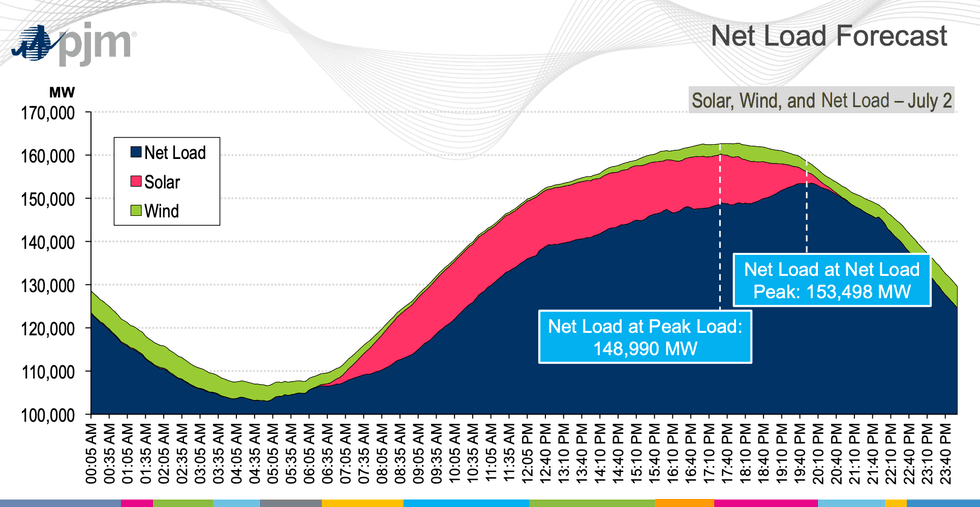
“It is also essential that we continue to cooperate on climate, technology, debt, trade. Climate change and technology are unleashing transformations to the global economy that require global response. Only by working together can we seize the opportunities and mitigate the risks of these great changes.” — International Monetary Fund Managing Director Kristalina Georgieva presenting the organization’s latest Global Policy Agenda on Thursday.
Log in
To continue reading, log in to your account.
Create a Free Account
To unlock more free articles, please create a free account.
Rob and Jesse revisit the basics of the ultra-clogged electricity interconnection queue.
Shift Key is off for Labor Day, so we’re running this classic episode.
The power grid is straining as new data centers, factories, and electric vehicles come online. For the first time in 15 years, American electricity demand is rising again.
The easiest option is to meet that new demand with new supply — new power plants. But in many parts of the country, it can take years to hook up new wind, solar, and batteries to the grid. The reason why is a clogged and broken system called the interconnection queue.
On this week’s episode of Shift Key, which first aired in 2024, Jesse and Rob speak with two experts about how to understand — and how to fix — what is perhaps the biggest obstacle to deploying more renewables on the U.S. power grid.
Tyler Norris is a doctoral student at Duke University’s Nicholas School of the Environment. He was formerly vice president of development at Cypress Creek Renewables, and he served on North Carolina Governor Roy Cooper’s Carbon Policy Working Group. Claire Wayner is a senior associate at RMI’s carbon-free electricity program, where she works on the clean and competitive grids team.
Shift Key is hosted by Robinson Meyer, the founding executive editor of Heatmap, and Jesse Jenkins, a professor of energy systems engineering at Princeton University.
Subscribe to “Shift Key” and find this episode on Apple Podcasts, Spotify, Amazon, YouTube, or wherever you get your podcasts.
You can also add the show’s RSS feed to your podcast app to follow us directly.
Here is an excerpt from our conversation:
Robinson Meyer: So, Tyler, you’ve been proposing on Twitter — or on X, I suppose — kind of one weird trick that would improve the interconnection process and make us deploy a lot more clean energy faster and save people the billions of dollars we were just talking about.
What is it? Please enlighten us.
Tyler Norris: So as mentioned, Texas is adding clean electricity much faster than every other market — and not just clean electricity, every form of generation capacity you can imagine. And the reason they’re able to do that is because they’re not subjecting those generators to all those severe conditions that I mentioned earlier and then allocating the cost of upgrading the grid to those generators upfront.
Instead, they’re attempting to proactively plan the system in response to generators that show up and send that market signal regarding where there may be opportunities to upgrade the grid. And it works, of course, because Texas is an energy-only electricity market, so they’re not studying the projects for their capacity value, so there’s some simplifications that make it more viable.
That said, even outside ERCOT, there’s a lot we could do to make this what we call energy-only interconnection option more viable for generators, and I think it could offer a lot of benefits. It’s much lower cost. It’s much faster to get projects online. It can contribute to production cost savings. It also provides a reserve of generators that can be upgraded to capacity resources if and when network capacity becomes available. And it can actually contribute to reliability and reduce the risk of shedding load during reliability events, even though they’re not formally qualified as what we call capacity resources
Meyer: Can you give us an example of what you mean? What is ERCOT actually doing here?
Norris: So it means that the Texas grid operator is willing to curtail generators as necessary to avoid any reliability impacts on the system. And so they’re basically, they’re managing the system in real time. And this does lead to a higher rate of curtailment on average for especially some of these renewable generators. And so that’s an important dimension of it. But there’s a lot of nuance there, too. Even the capacity resources outside of Texas can be curtailed during congestion events.
So they’re not assigning grid upgrades to the projects upfront. They’re instead looking at where the generators show up and connect to the system and then identifying the most valuable grid upgrades from a cost and a reliability standpoint and prioritizing those.
Mentioned:
Tyler’s study on “energy only” interconnection rules
Matthew Zeitlin on the big problems with PJM — and on Tyler’s research into flexible loads
FERC Order 2023 on Improvements to Generator Interconnection Procedures and Agreements
Advanced Energy United report on “Unlocking America's Energy: How to Efficiently Connect New Generation to the Grid
NRDC: “PJM’s Capacity Auction: The Real Story”
Rob’s downshift; Jesse’s upshift.
This episode of Shift Key is sponsored by …
Accelerate your clean energy career with Yale’s online certificate programs. Gain real-world skills, build strong networks, and keep working while you learn. Explore the year-long Financing and Deploying Clean Energy program or the 5-month Clean and Equitable Energy Development program. Learn more here.
Join clean energy leaders at RE+ 25, September 8–11 in Las Vegas. Explore opportunities to meet rising energy demand with the latest in solar, storage, EVs, and more at North America’s largest energy event. Save 20% with code HEATMAP20 at re-plus.com.
Music for Shift Key is by Adam Kromelow.
On Trump’s latest wind target, new critical minerals, and methane maps
Current conditions: In the Atlantic, Tropical Storm Fernand is heading northward toward Bermuda • In the Pacific, Tropic Storm Juliette is active about 520 miles southwest of Baja California, with winds of up to 65 miles per hour • Temperatures are surging past 100 degrees Fahrenheit in South Korea.
Renewable investments dim in the U.S.Brandon Bell/Getty Images
In the United States, investments in renewable energy fell by 36% — equal to $20.5 billion — compared to the second half of last year, according to new data from the consultancy BloombergNEF. The drop “reflects a rush of construction toward the end of last year as developers sought to lock in lucrative tax credits, followed by a sharp drop this year as policy conditions worsened,” the report stated. The European Union, on the other hand, ratcheted up spending on renewables by 63% — or nearly $30 billion — in the first half of this year compared to the second half of 2024. Drawing an even sharper contrast, investments into both onshore and offshore wind made up the bulk of the growth in Europe as the Trump administration has placed the harshest restrictions on wind turbines of any other energy source.
Overall, global investment into clean energy rose 10% in the first half of 2025 compared to the same period in 2024. That included a worldwide increase in wind investments of 24% and a jump in new solar investment of 5%.
The U.S. Geological Survey released its latest list of critical minerals on Monday. The report highlights some shifts in U.S. production and concerns in Washington over potential supply disruptions from supposedly friendly powers. While the analysis identifies China as the biggest threat to the U.S. economy in 46 of the 84 commodities studied, “Canada and South Africa both show up as potential points of disruption across eight imports,” Farrell Gregory, a non-resident fellow at the Foundation for American Innovation, wrote on X. “Interestingly, Canada is identified as having a high-risk for disruption, more than South Africa and Russia.”
There were new bright spots in the report. The USGS removed tellurium, a silvery brittle metal used in semiconductors, from the list of risk resources it was added to in 2022. That’s because a new Rio Tinto mine transformed the U.S. from an importer into a net exporter in recent years.
It could have been worse. The Treasury guidance issued Friday dictating what wind and solar projects will be eligible for federal tax credits could have effectively banned developers from tapping the write-offs set to start phasing out next July. In the weeks before the Internal Revenue Service released its rules, GOP lawmakers from states with thriving wind and solar industries, including Senators John Curtis of Utah and Chuck Grassley of Iowa, publicly lobbied for laxer rules as part of what they pitched as the all-of-the-above “energy dominance” strategy on which Trump campaigned. Grassley went so far as to block two of Trump’s Treasury nominees “until I can be certain that such rules and regulations adhere to the law and congressional intent,” as Heatmap’s Matthew Zeitlin covered earlier in August.
Since the guidance came out on Friday, both Grassley and Curtis have put out positive statements backing the plan. “I appreciate the work of Secretary [Scott] Bessent and his staff in balancing various concerns and perspectives to address the President’s executive order on wind and solar projects,” Curtis said, according to E&E News. Calling renewables “an essential part of the ‘all of the above’ energy equation,” Grassley’s statement said the guidance “seems to offer a viable path forward for the wind and solar industries to continue to meet increased energy demand” and “reflects some of the concerns Congress and industry leaders have raised.”
Gas power plants are booming in the U.S. as demand surges, but the growth doesn’t yet mark a fundamental shift away from renewables, clean-energy analyst Michael Thomas wrote in a post on his Substack newsletter, Distilled. “If there were to be an unprecedented pivot to gas, you’d expect Texas to be ground zero for it,” he said. “The state has done everything it can to prop up fossil fuel power in recent years. It’s also one of the most permissive when it comes to environmental regulations and permitting.” Despite major growth in the past year, he wrote, gas made up just 10% of proposed new project capacity in Texas so far this year. The remaining 90% of capacity came from solar, wind, and battery projects. Last year alone, renewable and storage developers proposed 100 gigawatts of clean capacity — seven times more than gas developers proposed.
A new map allowing users to track risks from natural gas super-emitters launched Tuesday from the independent energy science and policy institute PSE Healthy Energy. The Methane Risk Map is a web tool with clickable markers representing individual methane super-emitting events throughout the U.S. Selecting one, as Heatmap’s Emily Pontecorvo wrote, “opens up a heatmap and information panel that shows the concentration of benzene, methane, and other pollutants present in that particular plume, the modeled distance each one traveled during the event, the demographics of the population exposed, and whether there were any sensitive facilities, such as schools or hospitals, in the exposure pathway.”
Though methane, the primary component of natural gas, is an extremely potent greenhouse gas and can pose an explosive risk at high concentrations, other components in unrefined natural gas present more direct public health risks. These include carcinogens like benzene and other health-harming substances, including toluene.
The grid-tech startup Splight has raised nearly $13 million to fund the commercial scaling of its breakthrough software. Unlike dynamic line rating, which uses weather and temperature data to open up more space on existing power lines to funnel as much as 30% more electricity, Splight claims its "dynamic congestion management” software can double the amount of room for electrons to flow without building new grid infrastructure.
The Methane Risk Map combines satellite and geologic data to visualize chemical exposure from natural gas plumes.
Methane-sniffing satellites have brought unprecedented visibility to “super-emitter” events, when the planet-warming gas gushes into the atmosphere at alarming rates — often from leaky fossil fuel infrastructure.
But those plumes contain more than just methane. Scientists are now using satellite data to look beyond the climate risks and assess the danger of super-emitting wells, tanks, and other assets to nearby communities.
PSE Healthy Energy, an independent energy science and policy institute, unveiled a “Methane Risk Map” on Tuesday that illustrates the spread of health-harming pollutants like benzene and toluene that also emanate from methane super-emitter events.
“The Methane Risk Map translates methane as a climate problem into methane as an air quality and human health issue,” Seth Shonkoff, PSE’s executive director, said during a briefing last week.
The vast majority of what we call “natural gas” is methane, but when it comes out of the ground, it also contains a host of other compounds, including carcinogens. The exact mix varies by location, and also changes as it moves through the oil and gas supply chain.
The Methane Risk Map is a web tool with clickable markers representing individual methane super-emitter events throughout the U.S. Selecting one opens up a heatmap and information panel that shows the concentration of benzene, methane, and other pollutants present in that particular plume, the modeled distance each one traveled during the event, the demographics of the population exposed, and whether there were any sensitive facilities, such as schools or hospitals, in the exposure pathway. It also gives the date the emission event occurred and what kind of equipment it came from, if available, such as a well or a tank.
Courtesy of PSE Healthy Energy
Underlying the map are two relatively new scientific developments. The first, as mentioned earlier, is satellite data. PSE pulls data released by the nonprofit Carbon Mapper, which launched its premiere satellite a year ago. Carbon Mapper’s sensing tools, developed in collaboration with NASA, essentially point a telephoto lens at oil or gas facilities to detect methane super-emitter events and measure how much of the gas is streaming out.
The problem, however, is that the satellite can only detect methane.
To solve that problem, PSE researchers created a database of the composition of natural gas at more than 4,000 facilities, spanning 19 oil- and gas-producing basins. When oil and gas operators apply for air permits, they have to submit facility-specific gas composition data from laboratory reports, often derived from direct samples of the gas. Researchers from PSE Healthy Energy went through thousands of regulatory documents to compile a database based on these reports. They found hazardous pollutants in more than 99% of the samples.
To build the Methane Risk Map, PSE combined methane emission rates from Carbon Mapper with this site-specific gas composition data, then used an air dispersion model to estimate the peak concentrations of each pollutant in the surrounding area after the release and show the area at risk. The map includes risk benchmarks set by state regulators for each pollutant, and shows that hazardous air pollutant levels from these super-emitters often exceed them.
While methane itself isn’t toxic, it can pose a safety risk at high enough concentrations from explosions or fires. So in addition to information about traditional air pollutants, users can also view the extent to which the methane released by an event posed a threat to the surrounding area.
One of the shortcomings of the project, and of methane-mapping efforts in general, is that the data isn’t accessible in real time. Carbon Mapper takes roughly a month from when its satellite spots a super-emitter to process and release the emissions data publicly — then PSE will have to run its own models and update its map. The satellites also represent only a moment in time — they don’t tell you when a leak started or how long it lasted. While the time delay could improve with technological and other advances, fixing the latter would require a lot more satellites.
The Methane Risk Map can’t yet function as an emergency response tool in a public health context, but that also wasn’t quite the intent behind the project. The PSE researchers envision policymakers, regulators, lawyers, and communities using the tool to push for stronger regulations, such as safer setback distances, stricter air quality monitoring requirements, and leak detection and repair rules.
The Environmental Protection Agency finalized stronger rules regulating methane and air pollution from the oil and gas sector in 2023, under the Biden administration. But after Trump took over the federal apparatus, the agency said it was “reconsidering” those rules. Since then, the EPA has extended compliance deadlines for many of the rules.
“As regulatory rollbacks in the climate and air quality arenas occur in the coming months, having this type of defensible data on the risk of these events and the risks they pose to human health will become increasingly important,” Kelsey Bilsback, the principal investigator for the project, said during the briefing.
Right now the map only includes emissions from the “upstream” oil and gas sector, but PSE plans to expand the project to include leaks from the midstream and downstream, too, such as pipelines and end-users.