Should Democrats take control of the U.S. House of Representatives in the coming midterm elections, as expected, then Huffman is first in line to become chair of the lower chamber’s Natural Resources Committee. This makes him one of the few people able to armchair quarterback permitting talks in Congress right now.
The proposed legislation currently on the table, known as the Bipartisan American Affordability and Jobs Act, or BAAJA, would fundamentally reshape how federal project permitting happens. It would constrain National Environmental Policy Act reviews. It would radically alter transmission approvals. It would let companies sue the government for damages if they can show that an agency was unduly discriminating against them based on fuel type. It would limit state and tribal authority to object against projects under the Clean Water Act. And it would make this whole process more transparent by instituting digital reporting requirements.
Huffman thinks it also gives too much benefit to oil and gas interests, and is an unnecessary capitulation to fossil-friendly Republicans who will likely lose power in this November’s midterm elections, anyway. He wants Democratic lawmakers to wait until after election day to consider what they do with the bill.
I reported on Congress for years and often spoke with Huffman in the Capitol hallways; he knew me on a first-name basis. So last week, when a friend pointed me to a tweet of his criticizing the Senate bill by quoting my writing, I took note. His issue concerned the discrimination provision in the bill, which sets a rolling five-year average for approvals as a baseline for what constitutes normal regulatory behavior. Successful lawsuits under this provision would be paid out of the Judgment Fund, a Justice Department account Trump has used for his offshore wind developer buyouts.
This part of the bill, Huffman wrote, “might pay some clean energy developers money from the judgment fund when they are screwed, but nothing to actually approve their projects. This is potentially a replay of the fake settlements that have bought out offshore wind projects,” he added.
I reached out to Huffman’s team and asked to talk about what he meant by that. What followed was a 20-plus-minute back-and-forth about the future of permitting reform in the U.S. and what may happen after a midterm election defined by public anger over a rush to build another type of large-scale infrastructure: data centers.
The following transcript has been lightly edited for clarity.
So let’s start with your tweet. You quoted a portion of our story about BAAJA that I had written about the “permitting certainty” provisions in the bill, and specifically the fact that developers could be awarded damages under the bill for discriminatory treatment. Could you elaborate on your point?
I don’t want to get too deep into the weeds, but this is the big thing being offered as an end to the war on clean energy, which was always the threshold matter before you get to a bipartisan permitting deal.
It is built on this framework, basically, of cutting checks from the judgment fund. And I believe that requires some close scrutiny and consideration because we have seen this gamed already to the tune of $4 billion to buy out offshore wind developers.
Well I know this can get quite technical, but the underlying point you were making was, this may not be as helpful as people think. I guess I was just wondering if you can you walk me through —
It depends what you want.
If you’re a clean energy developer and you’re worried about your shareholders and your balance sheet, this gives you at least some money when you get screwed. And it may come with some strings attached, like you have to turn around and invest it in [liquified natural gas]. That’s been the playbook from the Trump administration.
If you’re a clean energy CEO — some of them, at least — that helps you mitigate risk. That’s probably better than nothing and will be attractive to some people. But if you care about climate policy [and] whether this is a meaningful assurance of permitting certainty to renewables, I think there’s a lot more to question here.
You also said in your tweet that there’s nothing in the bill to get projects approved. Can you speak to that? Because those who negotiated it clearly say otherwise.
Well, there are shot clocks and all sorts of other things that are designed to speed things up. There’s also broad categories of exemptions — categorical exemptions and other things like that, most of which will benefit fossil fuel projects.
I have no doubt there’s going to be permitting acceleration and certainty for fossil fuel projects. You also have this five-year baseline mechanism being codified here that will further cement a high level of fossil fuel projects for many years to come, and will really operate as a ceiling.
Help me understand what you mean by that, because I’m interested in understanding your concern there.
People are going to want to look at this much more closely and think about how it’ll operate in practice, not just some model. Because in practice, Trump is going to keep doing exactly what he’s done for the last two years. He’s going to find ways not to permit renewables, even if some of them go through this new gauntlet of legal theories and challenges and at the end of the day get a check written to them from the judgment fund.
You make this point about models versus reality. I spent last week trying to understand the implications of the bill for the nation’s buildout of AI data centers and associated energy infrastructure. How do you see that data center conversation weighing on your evaluation of the bill?
It’s part of the context, for sure. It’s driving a lot of this — we have to be honest about that. This is about data centers and pipelines and grid improvements necessary to meet all this surging demand that’s mostly coming from data centers.
That’s not to say we don’t need a more functional and robust grid. We do. Whatever you think about AI and data centers, we do need that. I’m not going to hold up a chance to improve our grid just because I have big concerns about data centers. I am concerned about how all this huge demand for energy in the next few years is going to be met. If we are stacking the deck for fossil fuel to meet a lot of this demand, that is deeply non-responsive to the climate crisis.
In terms of “stacking the deck,” passing the bill or not passing the bill — which reality is a cleaner grid and cleaner buildout of these data centers?
I mean, I would love to give you an absolute answer to that, but it depends. It depends how you assume this is going to play out in practice.
Looking at the conversations around the bill and considerations about federal permitting, as well as the politics, I’m struck by this timeline we’ve found ourselves in. Over the next month, voters will be hearing about data centers, which is something they don’t want in their communities, per polling. They also will be hearing about energy prices, which people want to bring down. Faced with those two different signals, I’m wondering how any kind of lame duck conversation about permitting happens after those two signals land in the ballot box.
It’s going to be very interesting for everyone to take stock after this election and think about what it means.
I was immediately attacked by right-wing Twitter and some of the boosters of this deal for simply saying, let’s see how this election goes. To me, that’s common sense! And no one is going to vote on this until after the election, anyway! The hypersensitivity tells you something.
What does it tell you?
There’s this choreographed attempt to preemptively flood the zone and prevent any kind of serious scrutiny about this.
I think it should be a red flag for my colleagues and serious policymakers to have an attempt to shut down serious scrutiny and debate, or pretend there’ll never be another deal and this one can never be improved, and that it’s now or never or nothing. That’s just fishy and not intellectually honest.
I’m not on the Hill as much anymore, which means I don’t see you as often. But in my many years covering Congress, I can’t tell you how many times I’d ask your late colleague from Arizona, former House Natural Resources Chairman Raul Grijalva, about his conversations with former Senate Energy and Natural Resources Chairman Joe Manchin.
I’m not going to sit here and expect you to read the minds of senators any more than I would expect senators to read the minds of House members. But can you, someone known as a climate champion, speak to how things are going with Senators Sheldon Whitehouse and Martin Heinrich, two people also respected in the climate community, when it comes to your reservations about this legislation?
I mean, it pains me to have a different view of some of this than these two friends of mine I respect enormously. But this may be one of those deals where reasonable minds can differ about tactics, details. That’s what this is coming down to.
I am sure negotiating with the hand they had over the past few months that they did pretty good work. Period. But I am sure with a better hand they and the rest of us could probably get a better deal.
A better deal the president will sign?
Yeah, that’s how it works. Let’s just take the logic of that argument you’re posing, which I hope is a devil’s advocate. Let’s say the president said he’ll agree to this and therefore we have to take the deal. By that reasoning, you should just always do what Trump demands. Always. And I find that absurd.
Any time I hear that kind of reductive reasoning … Has no one been watching Trump his entire life? He’s a bluffer. He’s a threatener. And he changes his mind all of the time.
Yeah I mean, to that effect, we asked Energy Secretary Chris Wright on stage at Climate Week if Trump would publicly post that he will sign off on approving more wind projects, and Wright said we shouldn’t count on that.
I’m very suspicious of the whole thing. There’s so much posturing and choreography going down right now.
They’re going to make it look like they won’t release any hostages, and then they will. It’ll be a very partial release of hostages. It’ll be maybe a dozen or so onshore wind projects that already have all their other approvals and [are] just waiting for the Department of Defense national security hold that is specious to be lifted, even though it’s never going to be held up in court. That’ll be shown as this big breakthrough that lets all this move through at lightspeed.
That’s the charade we’re being walked through right now.
To your point, I checked the court filings this morning, and the Justice Department did just tell the federal court hearing the challenge to the Defense Department that they’re now processing about that number of projects.
But if I can ask you, to that point, I’ve known you almost as long as I’ve been a reporter — almost a decade. I also knew your colleague, the late Raul Grijalva, quite well. I don’t remember a single time when Grijalva was chair of the Natural Resources Committee that he ever supported a bipartisan permitting deal. I remember his opposition to the Barrasso-Manchin bill quite vividly, and a lot of other times that was the case —
Well that might be a difference. I was ready to negotiate improvements in Barrasso-Manchin and try to get to something I could support, in part because I was worried what a Republican Congress and a Trump administration would do if we didn’t try in good faith to get to a deal at that time.
I think we missed an opportunity there. But that was largely because the opportunity was shut down by Republicans. I can’t say what Grijalva would’ve done, but I can say what I would’ve done. I would’ve rolled up my sleeves and tried to get a deal.
Well, I just pulled up a quote from you about that bill, in which you said, “We need to find a way to kill the zombie one more time.”
There was also an opportunity to fix the problematic parts of it.
I guess what I’m asking is, what would you say to people who claim there’s no bipartisan deal in the offing like this bill that you would support? Because any deal like that would obviously have to provide some things to industries like fossil fuels that you don’t want to sign off on.
That’s the problem. If the “deal” has to always get worse, then yeah, that’s a zombie deal we’ve seen time and again, where it’s just the wishlist of the fossil fuel industry or nothing. That is the downward race to the bottom we’ve been on when we talk about permitting reform. But if you want grid improvements, if you want some of the other good provisions in this package — look at the fact I cosponsor Sean Casten and Mike Levin’s bill, [the Energy Bills Relief Act,] to do a lot of these things.
Would you rather that bill is the starting point in the new Congress?
Of course I would. That’s a good transmission bill that doesn’t come with all the other baggage. I’m pointing that out to say I’m not just against things but I’m for things, and you can see that from a longstanding record.
My last question — and I want to ask it because people are raising it — if this bill doesn’t get passed, there are going to be at least some people who point fingers after it fails at the people who stopped it. Those people will say those who stopped it don’t want anything. I know you’re pointing at Levin-Casten and —
No, I know your question, Jael, and I have to run here in just a minute.
If we get to that point and you hear all this whining and recrimination, you know what I will say to those people? Shut up and get in the room and let’s work on a deal. [laughs] I mean honestly it’s just so absurd. If you want permitting reform, you’ve got to be willing to work in a more thoughtful way instead of all these absolutes. This or nothing. Now or never.
I mean, you’ll see. What I can tell you is that you’ll see if we get to that scenario.








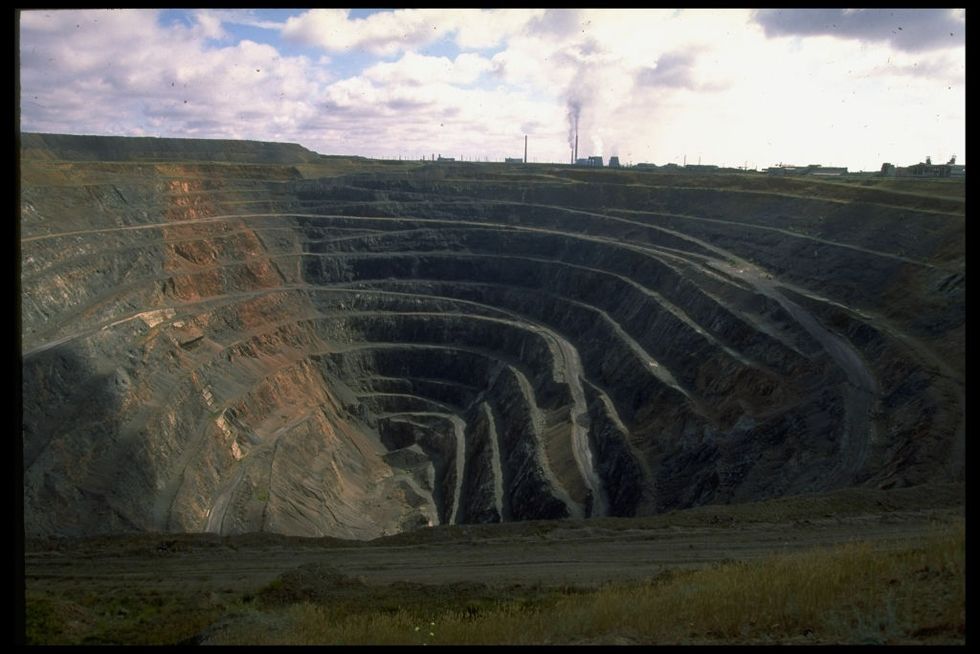 An old uranium mine in Stepnogorsk, Kazakhstan. Robert Nickelsberg/Getty Images
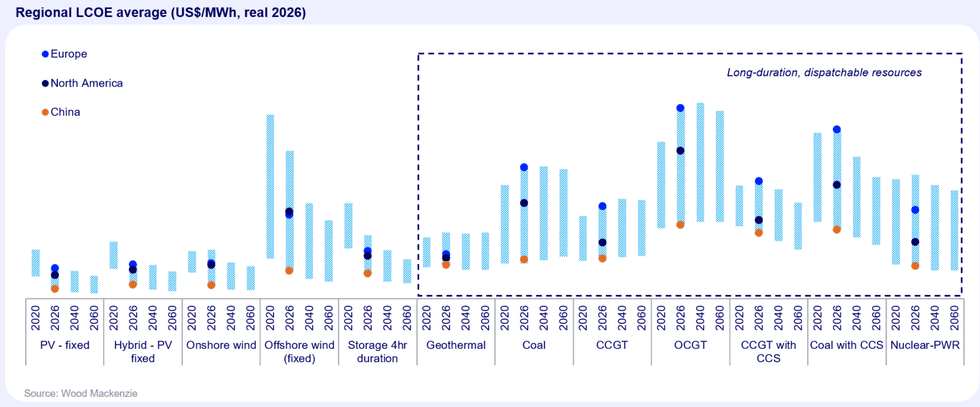 Four-hour stage compares very well to open-cycle gas turbines, labeled OCGT. Wood Mackenzie