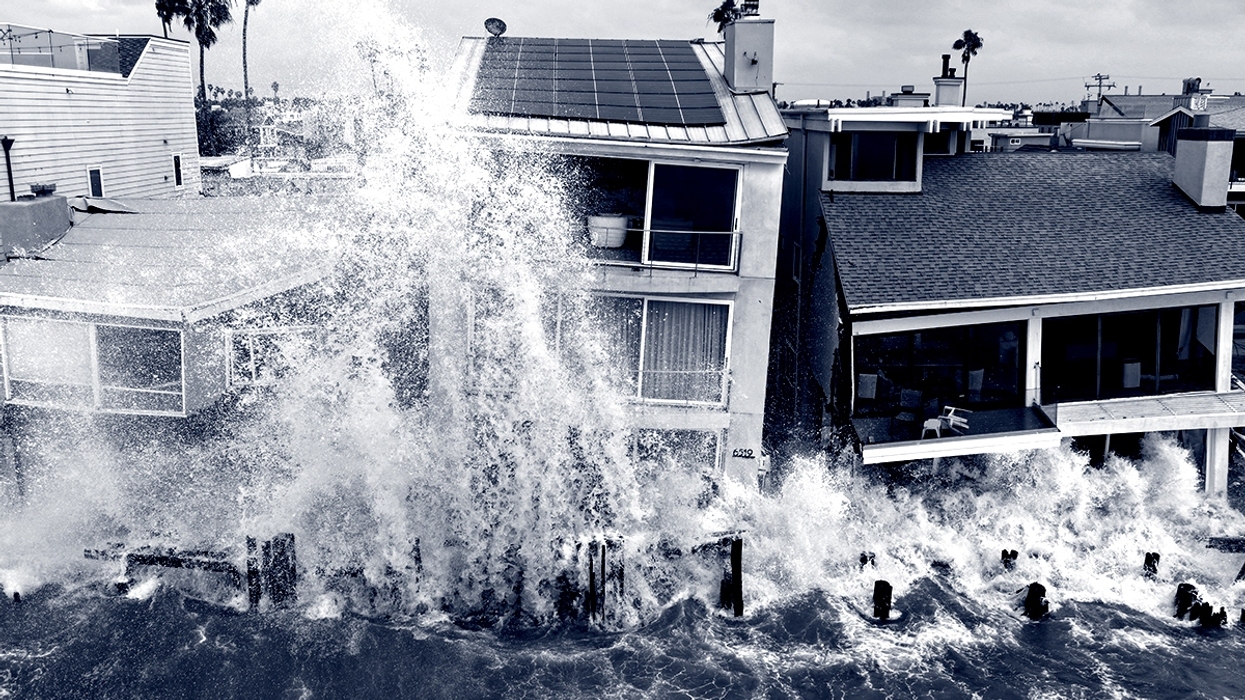
But while things might look bad in California at the moment, they can still get much worse. One disaster modeler recently estimated the state could see as much as $3 billion in flooding and mudslide-related losses alone this winter — not to mention coastal erosion, king tides, and storm swell. Governor Gavin Newsom declared a state of emergency at the end of September, while many cities, including San Diego, have declared their own local emergencies.
El Niño will likely peak in December, meaning that towns and cities across the state have just a few remaining weeks to finalize projects, whether that means improving drainage in landslide-prone environments such as Rancho Palos Verdes or distributing NOAA weather radios in areas likely to lose power, as emergency managers are in Santa Cruz. The approaching winter storms, combined with El Niño, represent “a humbling reminder of the ongoing effects of climate change and the importance of emergency preparedness,” Laath Martin, the public affairs lead for the city of Long Beach, wrote to me in an email.
El Niño is a cyclical phenomenon, occurring when temperatures in a particular stretch of the Pacific Ocean rise half-a-degree Celsius above the average of the preceding 30 years. But there are signs these natural variations are happening less predictably because of climate change, and we know for sure that a warmer atmosphere makes the baseline for its impacts worse: king tides, Kelvin waves, and storm surge piggyback on top of rising sea levels to result in more severe coastal flooding and erosion. A warmer atmosphere also holds more water, which means more rain — perhaps 200% above normal — which, in turn, results in flooding and mudslides further inland, as well.
“Based on what I am seeing now, I am officially concerned,” Daniel Swain, a climate scientist at the University of California Agriculture and Natural Resources, said last week after reviewing the latest outlook. There’s a reason this year’s El Niño is being called a Godzilla.
In general, the weather pattern causes the jet stream to shift south in the winter, bringing wetter and snowier conditions to the lower U.S. while the northern part of the country stays drier and mild. (It’s also responsible for a weaker Atlantic hurricane season, as we’ve already seen this year.) In addition to El Niño-driven Kelvin waves, warm bulges of water that raise the sea level on the coast by as much as 18 inches, the state of California — and particularly southern California — sits directly in a storm track that will deliver “atmospheric rivers” of heavy rain to a region prone to landslides and flash floods.
In many parts of the state, that rain will test the best-made plans in addition to plans deferred. In Los Angeles, the Department of Sanitation and Environment, or LASAN, has told the City Council it has concerns about the ability of the aging wastewater pipes and plants to handle heavy rainfall associated with a supercharged El Niño. In San Diego, which requires some $3.3 billion to upgrade what is in some places a century-old wastewater system, emergency managers are preparing to work with what they have by clearing debris and brush that could back up in the drains, CalMatters reports. In both cases, the time required for systemwide repairs far exceeds the time remaining before the winter’s supercharged atmospheric rivers are due to arrive. (Rezende told me inland flooding affects more businesses and residents in San Diego than coastal flooding, since the population in the city is set further back from the coastline.)
The city of Roseville, northeast of Sacramento, by contrast, is leaning on decades of flood planning to get through the season. After a series of back-to-back storms in 1986 that killed 13 people and caused $400 million in damage, the city and FEMA invested $39 million to upgrade Roseville’s infrastructure, including widening streams and adding levees and stormwater bypass channels. With more accurate floodplain modeling that has “helped keep new construction at higher elevations,” Helen Dyda, the city manager’s public information officer told me that “less than 7% of the city is within a floodplain” today. Dyda added that the city prepares for winter storms every year — it has some 160 miles of creek shoreline, after all — but that the El Niño-specific preparations are, as a result, more similar to routine maintenance: “clearing more dense vegetation and fallen trees from key creek areas.”
Long Beach is caught somewhere in the middle. After swells from Hurricanes Marie and Polo hammered the city in September, Long Beach hastily developed a seven-point plan to strengthen its peninsula in the near and long term. It will also begin a $11.4 million dredging project this fall that will place 415,000 cubic yards of sand on the beach as a buffer zone. “While this effort will achieve a much-desired result, it will not stop the ocean from pulling sand from the peninsula with every wave, especially during the significant weather systems Long Beach continues to experience,” Martin, the city’s public affairs lead, wrote to me. “Back-passing will need to continue to return sand back to the peninsula each day until more permanent, long-term man-made and environmental solutions can be identified, permitted and implemented.”
In certain cities, preparations for the peak of El Niño overlap with ongoing repairs from the last bad storm season. In Santa Cruz County, the 2016 El Niño caused an estimated $9 million in damage, while many in the community of Pajaro are still recovering from the flood damage caused by a series of severe atmospheric rivers in 2023. “We have a list of hazards that the city is vulnerable to, and we plan for all of them not individually, but all together,” Meredith Albert, Santa Cruz’s emergency management manager, told me. She added that many of the city’s preparedness activities and El Niño initiatives, like urging the community to be prepared to spend 72 hours unsupported, overlap with other disasters it works year-round to prepare for, like earthquakes, landslides, and wildfires.
“El Niño turns up the volume a little bit, but it doesn’t necessarily change our hazard landscape,” is how Albert put it to me.
Santa Cruz has not declared a local state of emergency, and Albert told me they won’t until they “run out of resources.” Other cities, like San Diego, have declared one preemptively. “In the past, you’d have to go through a longer review if you wanted to make some headway on projects, and sometimes that would take many weeks or many months of permitting,” Rezende said. “With a state of emergency, we streamline that process and get projects in the queue.”
Both Rezende and Albert told me the governor's statewide emergency declaration mostly helps state agencies position themselves for a faster response or has implications for higher-level permitting processes. (In Carlsbad, for example, which has seven miles of badly eroding beach, just one mile is controlled by the city; the other six are managed by the State Parks.) The state has also teamed up with ICEYE, a satellite imaging company, to receive information about flooding even in the dark or through rain clouds.
No state of emergency, though, can make it so a city can replace a century-old sewer system by Christmas or reengineer a beach by the time January’s storms begin to make landfall. But if a Godzilla analogy fits the onslaught of a super El Niño, it also offers a classic disaster-movie lesson on how to survive it.
Albert’s advice for how to prepare? Ask a neighbor for a cup of sugar. Take their dog for a walk. Build a relationship that could prevent a tragedy. “We know that our city will be cut off for at least a couple of days,” she told me of a hypothetical major disaster, referring back to Santa Cruz’s experience after the 1989 Loma Prieta earthquake, which cut off the city’s power, communication, and supply lines. “And we also know that we can’t build those relationships during the disaster. We’re trying to build them before.”
The city is doing a lot to prepare for the storm, she said. “But the question is also, what are all of us doing?” Albert went on. “You know better than I do, at the city level, who’s not going to receive that alert,” whether that be an elderly or unhoused neighbor or a nonnative English speaker who might not receive or understand emergency communications.
“Check in on a neighbor” is easier said than done — active engagement and connection to one’s community is trending downward in most parts of the U.S. But the people and places that bounce back from disaster and tragedy are almost uniformly the ones that look after each other. Borrowing a cup of sugar, to this introvert, sounds like a nightmare. But there’s never been a better time than a Godzilla El Niño to bake a poorly resourced cake.








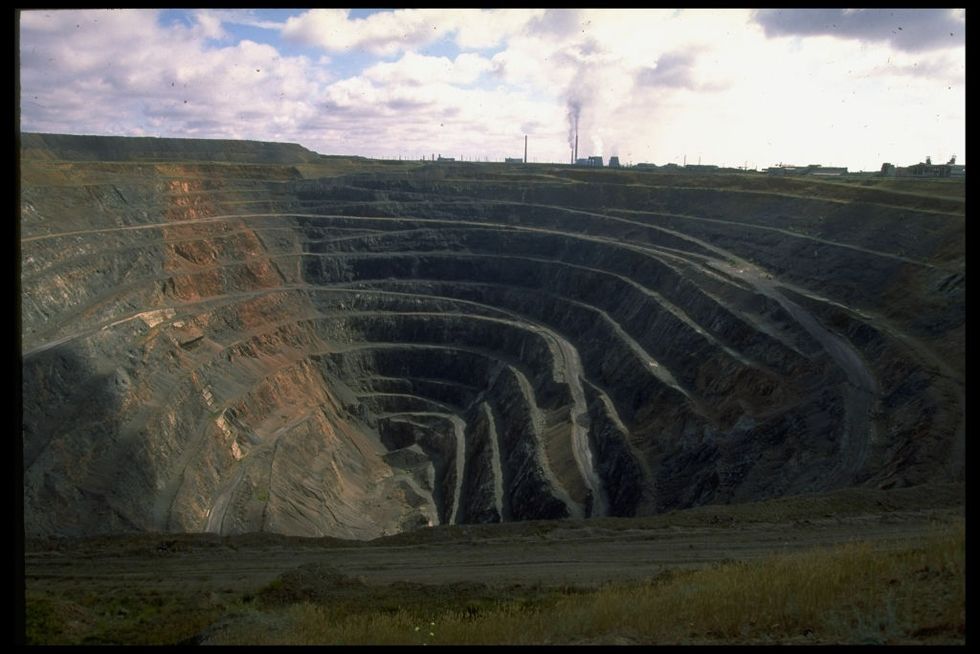 An old uranium mine in Stepnogorsk, Kazakhstan. Robert Nickelsberg/Getty Images
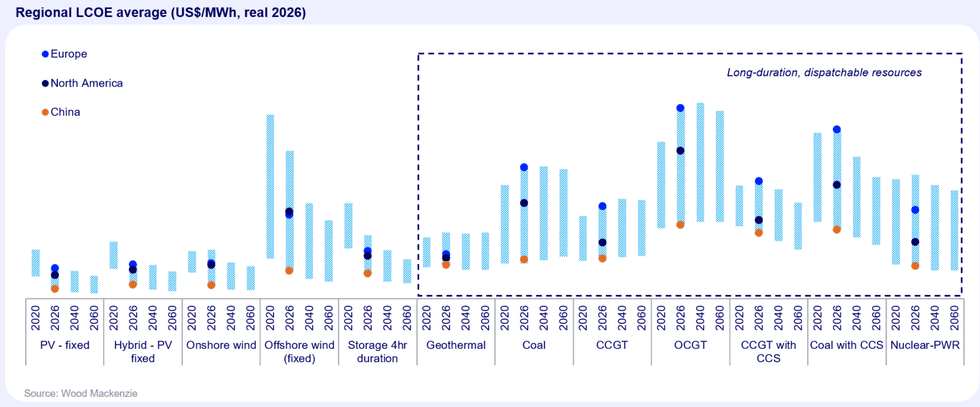 Four-hour stage compares very well to open-cycle gas turbines, labeled OCGT. Wood Mackenzie