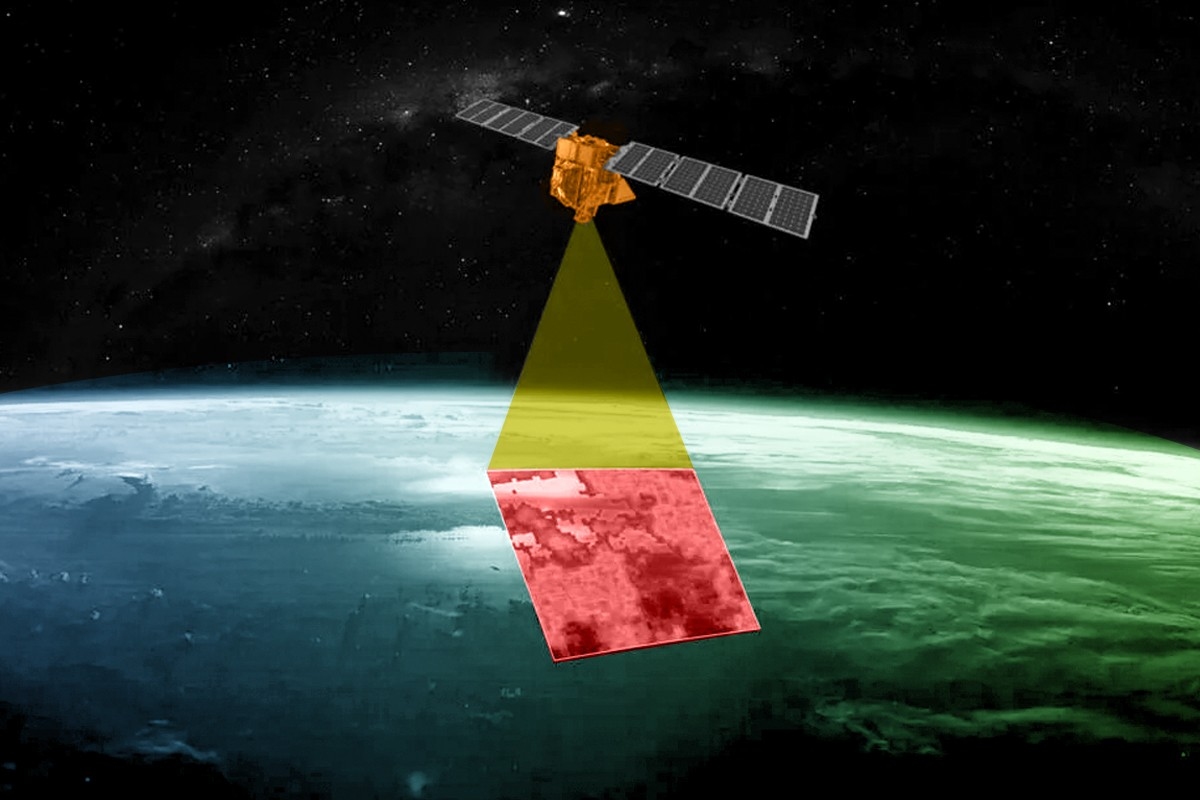
On Monday afternoon, a satellite the size of a washing machine hitched a ride on a SpaceX rocket and was launched into orbit. MethaneSAT, as the new satellite is called, is the latest to join more than a dozen other instruments currently circling the Earth monitoring emissions of the ultra-powerful greenhouse gas methane. But it won’t be the last. Over the next several months, at least two additional methane-detecting satellites from the U.S. and Japan are scheduled to join the fleet.
There’s a joke among scientists that there are so many methane-detecting satellites in space that they are reducing global warming — not just by providing essential data about emissions, but by blocking radiation from the sun.
So why do we keep launching more?
Despite the small army of probes in orbit, and an increasingly large fleet of methane-detecting planes and drones closer to the ground, our ability to identify where methane is leaking into the atmosphere is still far too limited. Like carbon dioxide, sources of methane around the world are numerous and diffuse. They can be natural, like wetlands and oceans, or man-made, like decomposing manure on farms, rotting waste in landfills, and leaks from oil and gas operations.
There are big, unanswered questions about methane, about which sources are driving the most emissions, and consequently, about tackling climate change, that scientists say MethaneSAT will help solve. But even then, some say we’ll need to launch even more instruments into space to really get to the bottom of it all.
Measuring methane from space only began in 2009 with the launch of the Greenhouse Gases Observing Satellite, or GOSAT, by Japan’s Aerospace Exploration Agency. Previously, most of the world’s methane detectors were on the ground in North America. GOSAT enabled scientists to develop a more geographically diverse understanding of major sources of methane to the atmosphere.
Soon after, the Environmental Defense Fund, which led the development of MethaneSAT, began campaigning for better data on methane emissions. Through its own, on-the-ground measurements, the group discovered that the Environmental Protection Agency’s estimates of leaks from U.S. oil and gas operations were totally off. EDF took this as a call to action. Because methane has such a strong warming effect, but also breaks down after about a decade in the atmosphere, curbing methane emissions can slow warming in the near-term.
“Some call it the low hanging fruit,” Steven Hamburg, the chief scientist at EDF leading the MethaneSAT project, said during a press conference on Friday. “I like to call it the fruit lying on the ground. We can really reduce those emissions and we can do it rapidly and see the benefits.”
But in order to do that, we need a much better picture than what GOSAT or other satellites like it can provide.
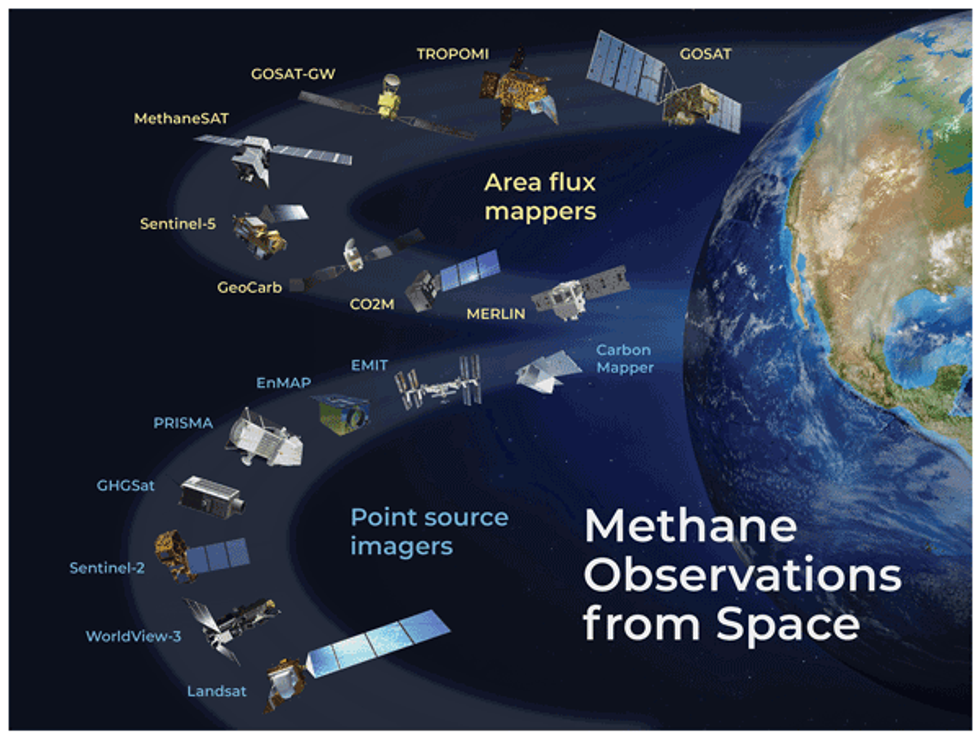
In the years since GOSAT launched, the field of methane monitoring has exploded. Today, there are two broad categories of methane instruments in space. Area flux mappers, like GOSAT, take global snapshots. They can show where methane concentrations are generally higher, and even identify exceptionally large leaks — so-called “ultra-emitters.” But the vast majority of leaks, big and small, are invisible to these instruments. Each pixel in a GOSAT image is 10 kilometers wide. Most of the time, there’s no way to zoom into the picture and see which facilities are responsible.
 Jacob, D. J., Varon, D. J., Cusworth, D. H., Dennison, P. E., Frankenberg, C., Gautam, R., Guanter, L., Kelley, J., McKeever, J., Ott, L. E., Poulter, B., Qu, Z., Thorpe, A. K., Worden, J. R., and Duren, R. M.: Quantifying methane emissions from the global scale down to point sources using satellite observations of atmospheric methane, Atmos. Chem. Phys., 22, 9617–9646, https://doi.org/10.5194/acp-22-9617-2022, 2022.
Point source imagers, on the other hand, take much smaller photos that have much finer resolution, with pixel sizes down to just a few meters wide. That means they provide geographically limited data — they have to be programmed to aim their lenses at very specific targets. But within each image is much more actionable data.
For example, GHGSat, a private company based in Canada, operates a constellation of 12 point-source satellites, each one about the size of a microwave oven. Oil and gas companies and government agencies pay GHGSat to help them identify facilities that are leaking. Jean-Francois Gauthier, the director of business development at GHGSat, told me that each image taken by one of their satellites is 12 kilometers wide, but the resolution for each pixel is 25 meters. A snapshot of the Permian Basin, a major oil and gas producing region in Texas, might contain hundreds of oil and gas wells, owned by a multitude of companies, but GHGSat can tell them apart and assign responsibility.
“We’ll see five, 10, 15, 20 different sites emitting at the same time and you can differentiate between them,” said Gauthier. “You can see them very distinctly on the map and be able to say, alright, that’s an unlit flare, and you can tell which company it is, too.” Similarly, GHGSat can look at a sprawling petrochemical complex and identify the exact tank or pipe that has sprung a leak.
But between this extremely wide-angle lens, and the many finely-tuned instruments pointing at specific targets, there’s a gap. “It might seem like there’s a lot of instruments in space, but we don’t have the kind of coverage that we need yet, believe it or not,” Andrew Thorpe, a research technologist at NASA’s Jet Propulsion Laboratory told me. He has been working with the nonprofit Carbon Mapper on a new constellation of point source imagers, the first of which is supposed to launch later this year.
The reason why we don’t have enough coverage has to do with the size of the existing images, their resolution, and the amount of time it takes to get them. One of the challenges, Thorpe said, is that it’s very hard to get a continuous picture of any given leak. Oil and gas equipment can spring leaks at random. They can leak continuously or intermittently. If you’re just getting a snapshot every few weeks, you may not be able to tell how long a leak lasted, or you might miss a short but significant plume. Meanwhile, oil and gas fields are also changing on a weekly basis, Joost de Gouw, an atmospheric chemist at the University of Colorado, Boulder, told me. New wells are being drilled in new places — places those point-source imagers may not be looking at.
“There’s a lot of potential to miss emissions because we’re not looking,” he said. “If you combine that with clouds — clouds can obscure a lot of our observations — there are still going to be a lot of times when we’re not actually seeing the methane emissions.”
De Gouw hopes MethaneSAT will help resolve one of the big debates about methane leaks. Between the millions of sites that release small amounts of methane all the time, and the handful of sites that exhale massive plumes infrequently, which is worse? What fraction of the total do those bigger emitters represent?
Paul Palmer, a professor at the University of Edinburgh who studies the Earth’s atmospheric composition, is hopeful that it will help pull together a more comprehensive picture of what’s driving changes in the atmosphere. Around the turn of the century, methane levels pretty much leveled off, he said. But then, around 2007, they started to grow again, and have since accelerated. Scientists have reached different conclusions about why.
“There’s lots of controversy about what the big drivers are,” Palmer told me. Some think it’s related to oil and gas production increasing. Others — and he’s in this camp — think it’s related to warming wetlands. “Anything that helps us would be great.”
MethaneSAT sits somewhere between the global mappers and point source imagers. It will take larger images than GHGSat, each one 200 kilometers wide, which means it will be able to cover more ground in a single day. Those images will also contain finer detail about leaks than GOSAT, but they won’t necessarily be able to identify exactly which facilities the smaller leaks are coming from. Also, unlike with GHGSat, MethaneSAT’s data will be freely available to the public.
EDF, which raised $88 million for the project and spent nearly a decade working on it, says that one of MethaneSAT’s main strengths will be to provide much more accurate basin-level emissions estimates. That means it will enable researchers to track the emissions of the entire Permian Basin over time, and compare it with other oil and gas fields in the U.S. and abroad. Many countries and companies are making pledges to reduce their emissions, and MethaneSAT will provide data on a relevant scale that can help track progress, Maryann Sargent, a senior project scientist at Harvard University who has been working with EDF on MethaneSAT, told me.
 Courtesy of MethaneSAT
It could also help the Environmental Protection Agency understand whether its new methane regulations are working. It could help with the development of new standards for natural gas being imported into Europe. At the very least, it will help oil and gas buyers differentiate between products associated with higher or lower methane intensities. It will also enable fossil fuel companies who measure their own methane emissions to compare their performance to regional averages.
MethaneSAT won’t be able to look at every source of methane emissions around the world. The project is limited by how much data it can send back to Earth, so it has to be strategic. Sargent said they are limiting data collection to 30 targets per day, and in the near term, those will mostly be oil and gas producing regions. They aim to map emissions from 80% of global oil and gas production in the first year. The outcome could be revolutionary.
“We can look at the entire sector with high precision and track those emissions, quantify them and track them over time. That’s a first for empirical data for any sector, for any greenhouse gas, full stop,” Hamburg told reporters on Friday.
But this still won’t be enough, said Thorpe of NASA. He wants to see the next generation of instruments start to look more closely at natural sources of emissions, like wetlands. “These types of emissions are really, really important and very poorly understood,” he said. “So I think there’s a heck of a lot of potential to work towards the sectors that have been really hard to do with current technologies.”


 Jacob, D. J., Varon, D. J., Cusworth, D. H., Dennison, P. E., Frankenberg, C., Gautam, R., Guanter, L., Kelley, J., McKeever, J., Ott, L. E., Poulter, B., Qu, Z., Thorpe, A. K., Worden, J. R., and Duren, R. M.: Quantifying methane emissions from the global scale down to point sources using satellite observations of atmospheric methane, Atmos. Chem. Phys., 22, 9617–9646,
 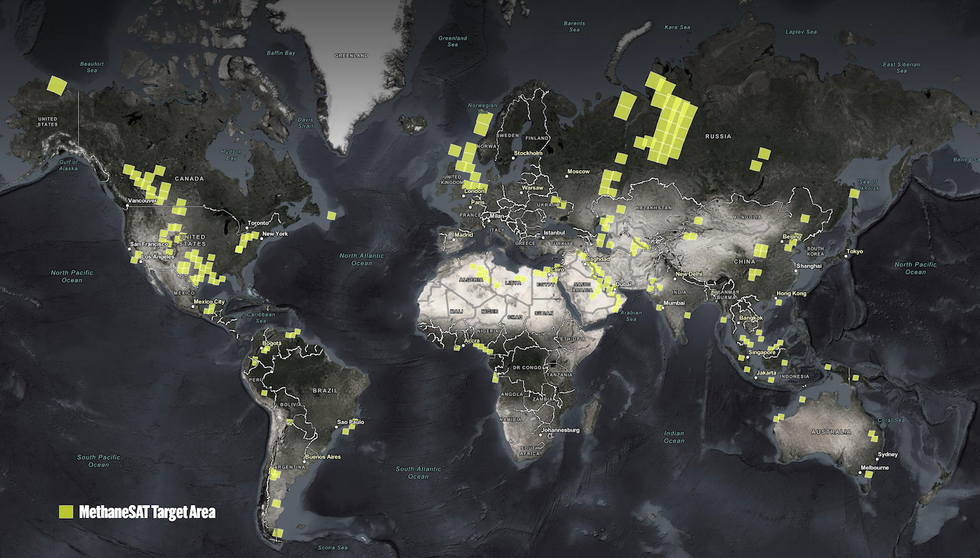 Courtesy of MethaneSAT

 The crude logic of the market in a time of war. EIA

