You’re out of free articles.
Log in
To continue reading, log in to your account.
Create a Free Account
To unlock more free articles, please create a free account.
Sign In or Create an Account.
By continuing, you agree to the Terms of Service and acknowledge our Privacy Policy
Welcome to Heatmap
Thank you for registering with Heatmap. Climate change is one of the greatest challenges of our lives, a force reshaping our economy, our politics, and our culture. We hope to be your trusted, friendly, and insightful guide to that transformation. Please enjoy your free articles. You can check your profile here .
subscribe to get Unlimited access
Offer for a Heatmap News Unlimited Access subscription; please note that your subscription will renew automatically unless you cancel prior to renewal. Cancellation takes effect at the end of your current billing period. We will let you know in advance of any price changes. Taxes may apply. Offer terms are subject to change.
Subscribe to get unlimited Access
Hey, you are out of free articles but you are only a few clicks away from full access. Subscribe below and take advantage of our introductory offer.
subscribe to get Unlimited access
Offer for a Heatmap News Unlimited Access subscription; please note that your subscription will renew automatically unless you cancel prior to renewal. Cancellation takes effect at the end of your current billing period. We will let you know in advance of any price changes. Taxes may apply. Offer terms are subject to change.
Create Your Account
Please Enter Your Password
Forgot your password?
Please enter the email address you use for your account so we can send you a link to reset your password:

This is the first story in a Heatmap series on the “green freeze” under Trump.
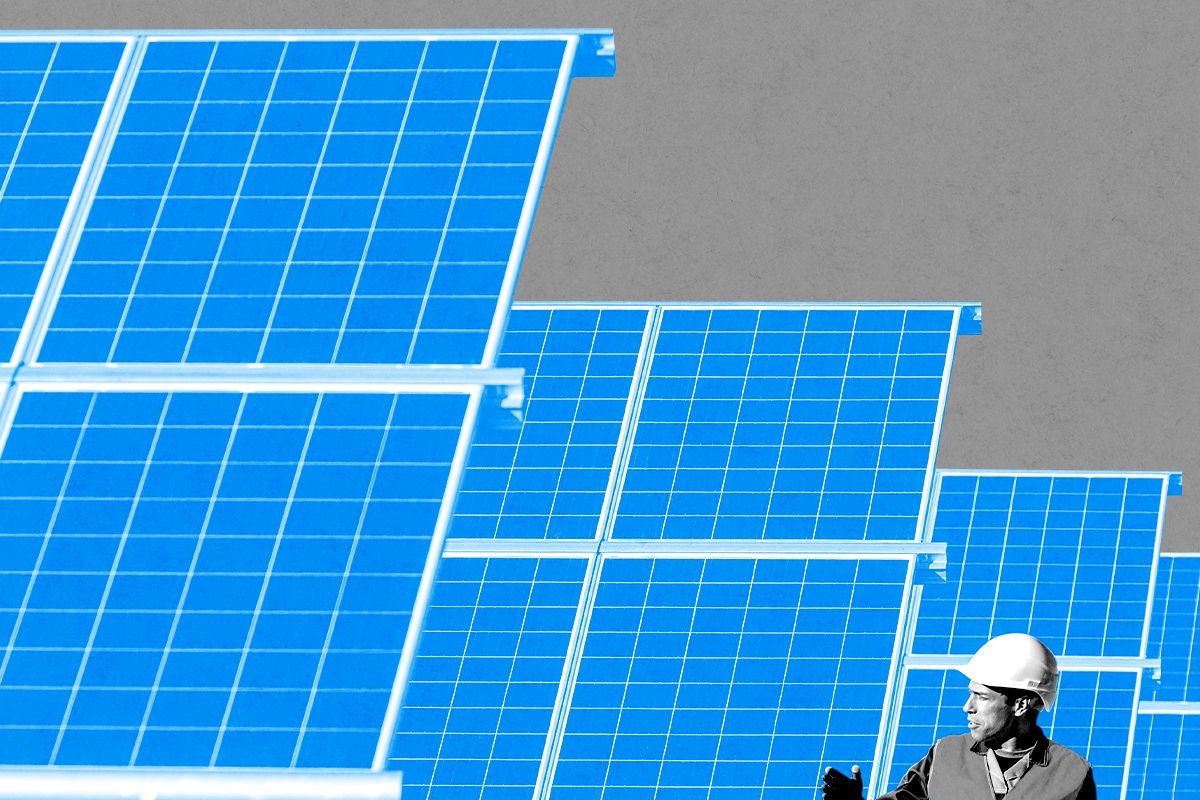
The renewables industry was struggling even before Donald Trump made his return to the White House. High interest rates, snarled supply chains, and inflation had already dealt staggering blows to offshore wind; California turned hostile to the residential solar market; and even as deployment of utility-scale solar accelerated, profits haven’t necessarily followed. (Those were still reserved for the fossil fuel industry.)
Then Trump came into office, issuing a barrage of executive orders that, at best, didn’t help, and at worst threatened to choke off the industry’s remaining avenues for growth. Now, Republican legislators are eyeing the Inflation Reduction Act for red meat to feed their tax cut machine; Elon Musk — himself the richest green tech entrepreneur of all time — is captaining an effort to slash the size of the federal government, particularly environmental programs; and the federal regulatory apparatus has essentially ground to a halt.
The early days of the Trump presidency have turned a clean energy slump into a kind of green freeze, with projects being cancelled and clean energy investors in many cases fixating on hypothetical policy changes, as opposed to the ins and outs of any given quarter. This creates a kind of trap for green energy companies, which are being punished in the immediate term for bad results while investors sit on the sidelines until the final resolution of the IRA comes into focus.
Speaking about the solar industry specifically, Morningstar analyst Brett Castelli told me that near term viability is not going to be about the specifics of any given company’s financial performance. “It’s going to be about how much the IRA is potentially changed.”
That’s likely the case across the green energy sectors. The iShares Global Clean Energy ETF, which tracks a number of renewables companies, is down 14% since November 5, and down 20% in the past year. “All businesses like certainty,” Castelli said. “The renewables market right now is facing a high degree of uncertainty in regards to what changes are coming to the IRA.”
But not every company has been affected equally. Those that were already flagging have been quick to blame the political environment, while others have gamely tried to explain to investors and the public how their lines of business align with the Trump administration’s priorities.
Executives at the residential solar company Sunnova — whose stock has fallen to below a dollar a share since it issued a “going concern” notice, essentially notifying investors that its existence as a company was under threat — mentioned “policy” or “political” or “politicians” six times in its earnings call last week. Chief Executive John Berger told an analyst that the reason for the going concern notice was that “the overall environment is terrible. I mean, it’s the political environment, the capital markets,” and that the company “struggled to close some things after the election.”
Berger stepped down Monday, and Sunnova’s former chief operating officer Paul Mathews immediately took over. Mathews “will focus on disciplined growth, stronger cash generation, cost efficiency, and enhancing the customer experience,” the company said.
Other companies have told investors and the public that they’re scrapping expansion plans, in many cases due to a policy change or a market change running downhill from policy.
“Manufacturing is probably where we see the biggest concern,” Maheep Mandloi, a stock analyst at Mizuho Securities, told me. “A lot of solar and battery projects are getting pushed out.”
Among them, battery manufacturer KORE Power, said in February that it was canceling a $1 billion battery project in Arizona. The Arizona facility was going to be supported with federal financing, specifically a loan from the Energy Department’s Loan Program Office for up to $850 million, but the conditional commitment never turned into cash in hand before the end of the Biden administration. Its new chief executive, Jay Bellows, told Canary Media that the company wanted to retrofit an existing facility into a battery plant instead.
Aspen Aerogels, which makes thermal barriers for batteries in electric vehicles, told investors in February that it wouldn’t move forward with a planned new plant in Statesboro, Georgia, and would instead “maximize capacity” at its Rhode Island plant. The company’s chief financial officer noted that it had already “decided to right-time” its Statesboro project in early 2023, “pre-empting a reset in EV demand expectations.”
And just last week, Ascend Elements, a battery materials company, said it was scrapping plans to manufacture cathode active material at its Hopkinsville, Kentucky plant, the Times Leader reported Thursday. Ascend said that it had agreed with the Department of Energy to cancel a $164 million grant that would support cathode active material (a key battery component) manufacturing, although a separate, $316 million grant for cathode precursor technology “remains active.”
But optimism still abounds — and it has nothing to do with any hopes about the fate of grants and tax credits under the IRA. Regardless of the law’s fate, the exuberance over artificial intelligence may prove to be an even greater subsidy.
In contrast to Sunnova, Sunrun — another residential solar company whose stock price has flagged since the election, but whose ability to stay in business has not been questioned — put a much more neutral spin on the political environment. Chief Executive Mary Powell told investors during the company’s earnings call in late February, “The fundamental long-term demand drivers for our business are incredibly strong and unrelated to any political party affiliation. Americans want greater energy independence and control of their lives and their pocketbooks. The country also needs more power from all sources to fuel rapid growth in electrification and data centers, and our growing fleet of energy resources will be part of the solution.”
Where once executives focused their rah-rah optimism on the declining costs of renewables, today they’re talking up their products’ quick path to deployment. The speed with which renewables can be built and switched on — especially solar and storage — compares favorably to the four-to-five year development timelines for new gas-fired plants. NextEra chief executive John Ketchum told analysts in a January earnings call “you can build a wind project in 12 months, a storage facility in 15, and a solar project in 18 months.”
That’s either the light at the end of the tunnel or the pot of gold at the end of the rainbow, depending on your level of fatalism or skepticism.
This oncoming demand could reignite the renewables industry even if it potentially loses access to generous IRA subsidies, Ben Hubbard, the chief executive of the infrastructure advisory firm Nexus Holdings, told me.
“The hyperscale datacenter demand is pretty massive, and when you have to really start massively upgrading your transmission and distribution infrastructure, those rates get passed on, unfortunately, to the average ratepayer like me and you and everybody else.” With higher rates, renewables could become profitable and investable on their own, without IRA subsidies, Hubbard said.
NextEra, a major renewables developer that also operates a natural gas fleet, has been one of the main promoters of the “speed to power” narrative. In its January earnings call, Ketchum told analysts, “We’re expecting load demand to increase over 80% over the next five years, six-fold over the next 20 years. And if you think about generation types and needing all of the above, they’re not all created equally in terms of timing.”
Although the Trump administration is seeking to unleash fossil fuel development, power plants don’t build themselves. They need, at the very least, turbines, and those gas turbines are not easy to get your hands on. As Heatmap has reported, manufacturer GE Vernova has only modest plans to increase capacity, and is already getting reservations for turbine slots in 2027 and 2028.
“With gas-fired generation, the country is starting from a standing start,” NextEra CEO Ketchum said on the earnings call. “We need shovels in the ground today because our customers need the power right now.”
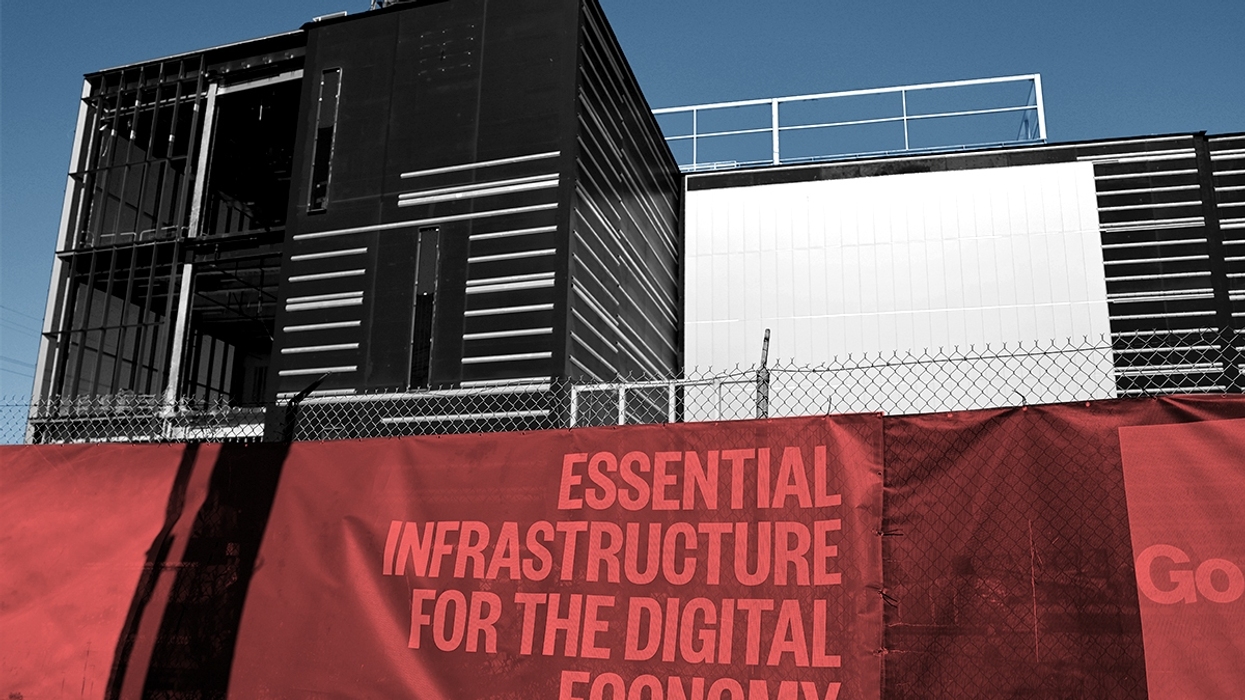
Developers and investors hope this means that data center developers and utilities will become both voracious and omnivorous in their power demand.
“I think what you’re going to see is the big tech companies, especially, are going to just have to eat the cost if they want to win the AI race,” Hubbard told me. “They’re going to take natural gas fuel, and they’re going to take biomass power, and they’re going to take solar. They’re going to take it all, because it’s almost insignificant relative to getting ahead of AI demand.”
Most of the industry, however, is gamely working through an environment where their day-to-day business may be fine, but their investors are still in wait-and-see mode.
“The common feedback we hear from a lot of investors is, ‘I’ll just probably come back once the dust settles and I know exactly what things are going to change,” Mandloi told me.
That’s even as executives point to a glorious future of AI-driven electricity demand. But investors may be waiting to count their chips from the IRA before they’re willing to take a flyer on powering data centers that are yet to be built.
And there’s nothing certain about the AI boom, either. More computationally efficient Chinese models have thrown that energy narrative into doubt, driving down the share price of Nvidia, which makes the chips that consume all that data center power (along with the share prices of power companies with large natural gas fleets). That stock is down by almost 20% so far this year. If the chip designer’s AI profits are less than previously thought, the electron providers may have to settle for less, as well. Renewables companies are hoping the data center boom will be a case of “if you build it, they will come,” but investors aren’t yet quite willing to buy it.

Log in
To continue reading, log in to your account.
Create a Free Account
To unlock more free articles, please create a free account.
Rob talks with climate and data expert Hannah Ritchie about her new platform, U.S. Energy Data.
America has some of the world’s best data about its own internal energy, industrial economy, and carbon emissions. That’s thanks to a federal agency called the U.S. Energy Information Administration, which painstakingly collects and updates the data every week.
But EIA data can be hard to access — and even harder to share and understand. A new project aims to change that. U.S. Energy Data takes federal energy data and repackages it, helping amateurs and experts understand the power grid, liquid fuels, and more. It is now the easiest way to make and share charts with federal energy data.
On this episode of Shift Key, Rob is joined by Hannah Ritchie, a data scientist and writer who advised and prototyped US Energy Data. She is also the author of Not the End of the World and Clearing the Air, as well as a senior researcher at the University of Oxford and the deputy editor at Our World in Data. Rob and Hannah discuss how the platform came together, what makes it such a valuable resource, and what we can learn from it about the state of the energy transition.
Shift Key is hosted by Robinson Meyer, the founding executive editor of Heatmap News.
Subscribe to “Shift Key” and find this episode on Apple Podcasts, Spotify, Amazon, YouTube, or wherever you get your podcasts.
You can also add the show’s RSS feed to your podcast app to follow us directly.
Here is an excerpt from their conversation:
Robinson Meyer: One thing that I so appreciate about your work, incluidng two books about climate change and Our World in Data, is that it is grounded, as it says in the title, in data. And that means that unlike those of us who are maybe in the news cycle every day and following the vagaries of policy moving one way and then moving the other way, having a framework through which to understand the world, I think a data-driven framework especially, means that you can update more slowly. And at least when you update your worldview, it’s grounded in a change which is surprising you or important, or that’s standing out, you know, in the real world, and not just in the kind of discursive or political world that we tend to cover.
At the risk of asking a very large question, how are you feeling about global decarbonization at the moment? As someone who works in the data, who looks at the data, what do you think hasn’t been noticed at the moment? I have a candidate here, but I’m curious what you think as well.
Hannah Ritchie: I think that in terms of global decarbonization, I’m still pretty optimistic. And I think one of the key distinctions there, I think when it comes to these discussions, we do naturally focus on the U.S.. And I think decarbonization in the U.S. has gone slowly, and too slowly, and has faced setbacks. And I think there is the temptation to extrapolate that view and say, well, the world is not doing well on decarbonization. And I don’t think that’s correct. I think, to not be too much of a centrist on this, we’re not going as fast as I would like, or what we frame as what we should need to be. But I do actually think that things are moving pretty quickly and accelerating in other parts of the world.
And I think the challenge there is, I think people are not saying that, yes, China is moving very quickly on this. But a key point there is, if you look at other countries, low- and middle-income countries across Latin America or Sub-Saharan Africa or Asia, many of those countries are also moving fast. And I think that’s underappreciated. And I think they’re moving fast because the energy transition and electrification and decarbonization just increasingly makes economic sense to do so.
So I guess the trade-off between increasing energy services for people — for which, in many low- and middle-income countries, that’s just a core part of development. And a key priority is no longer incompatible with also doing that in a relatively low-carbon way, and I think that’s a really key, underappreciated point, and you start to see that in these annual updates of what happened in the last year, and I think you miss it if you’re only looking at, you know, the headline from yesterday and the headline from today.
You can find a full transcript of the episode here.
Mentioned:
Previously on Shift Key: Daniel Palken of Arnold Ventures joined us to discuss permitting reform
This episode of Shift Key is sponsored by …
RE+ 26 is the largest clean energy event in North America, happening November 16th through 19th at the Las Vegas Convention Center. Register at re-plus.com and use code SHIFTKEY20 to save 20% off a Full Conference pass.
Music for Shift Key is by Adam Kromelow.
Google, Nvidia, and Emerald AI are founding members.
Nvidia, Google, and data center software startup Emerald AI are teaming up to lead the AI Energy Management Alliance, a trade group dedicated to promoting flexible load for AI data centers, the organizations announced on Wednesday.
“There are a lot of AI trade associations, data center trade associations, energy trade associations. This is the only one that is laser focused on flexible AI data centers,” Varun Sivaram, founder and chief executive of Emerald AI, told reporters in a briefing earlier in the week.
The group represents the evolution of an older trade association, the Advanced Energy Management Alliance, which was founded in 2014 and advocated for demand response for large electricity customers. Energy policy veteran Frank Lacey will lead the reconstituted group, which will also include other energy and AI heavyweights among its members, such as Anthropic, NRG, and Constellation Energy.
The pursuit of policies and technologies that can enable data centers to reduce their draw on the grid during moments of peak demand has been something of a holy grail for energy policy practitioners and hyperscalers like Google. That’s because much of the cost of building out and maintaining the grid — including greenhouse gas emitting gas-fired powered plants — is for meeting those peak hours.
“The savings to consumers if we had effective flexibility is enormous,” Abraham Silverman, former general counsel at the New Jersey Board of Public Utilities and assistant research scholar with the Ralph O’Connor Sustainable Energy Institute at Johns Hopkins University, told me. (He is not involved with the alliance.) “It’s when you get up to the hottest or coldest day of the year that you need that extra transmission line or need to build a new one,” which then drives up costs for everyone, Silverman said.
A recent Johns Hopkins analysis of the grid operator PJM Interconnection, which covers large portions of the Mid-Atlantic and Midwest, found that “requiring data centers to accept occasional power interruptions saves over $15 billion per year.”
State and local regulators have shown openness to a variety of approaches that could get data centers on the grid faster while minimizing impact on the grid. “Just about every state has some either legislative or regulatory process for looking at this,” Silverman said.
The case for flexibility picked up steam last year thanks to an academic paper co-authored by energy systems expert Tyler Norris, who at the time was a researcher at Duke University’s Nicholas School of the Environment and is now Google’s head of energy market innovation. Norris argued that much of AI data center electricity demand could be served by the existing grid with modest flexibility.
“The limiting factor for new digital infrastructure isn't capital or silicon; it's power,” Norris told the reporters during the briefing. “But the biggest near-term barrier isn't a lack of electricity. Multiple studies have found that if new loads are able to reduce their draw from the grid for a small fraction of the year — less than 100 hours during peak periods — we can add dozens of gigawatts of new load to the existing U.S. power system.”
Google says it has 1 gigawatt of demand flexibility integrated into its existing utility contracts, while Emerald, which recently fetched a valuation of just over $1 billion, is working on a 100-megawatt data center with Digital Realty and Nvidia in Virginia. That facility “is intended to demonstrate a model that future AI factories around the world can adopt,” Josh Parker, the head of sustainability at Nvidia, told reporters on the call.
“What we want to do is to better utilize that infrastructure,” Parker added. “Every watt wasted is a watt that could have been used to generate tokens, which could lead to life-saving treatments, or economic productivity, or even energy efficiency in other sectors that dramatically improve our sustainability outcomes.”
The effort is especially noteworthy because it explicitly seeks to make building data centers easier amidst mounting and diffuse skepticism from the communities that may host them and the public as a whole. Part of the case for flexible load is to solve for the mounting utility bills widely predicted to accompany AI’s expansion.
“The real goal,” Sivaram said, is “more community-friendly and grid-friendly data centers — data centers that are good grid citizens all across the country.”
Concern over the energy system’s ability to meet the demand from AI has reached the federal level. In June, the Federal Energy Regulatory Commission asked the six large independent power markets to come up with reforms to help protect the grid and consumers from the huge predicted rise in demand from data centers. Those include coming up with “new transmission services to reflect large load flexibility,” as FERC Chair Laura Swett put it. A trade group focused on flexibility could push forward these conversations in a coordinated way, ideally bringing together state and federal regulators, Silverman told me.
Right now, any effort to reform data center interconnection tends to ping pong back and forth between states, the federal government, and the regional transmission organizations, with major players trying to have their case heard at whatever level they think will be most favorable to their interests. For example, Microsoft is contesting a Virginia rule over data center cost allocation, claiming it stands to get in the way of federal rules.
“This new trade association could be very helpful in bringing together the companies for whom flexibility is a competitive strength and give them a voice,” Silverman told me.
This transcript has been automatically generated.
Subscribe to “Shift Key” and find this episode on Apple Podcasts, Spotify, Amazon, YouTube, or wherever you get your podcasts.
You can also add the show’s RSS feed to your podcast app to follow us directly.
Robinson Meyer:
Hello, it’s Wednesday, September 16, and for a long time, the U.S. Energy Information Administration, or EIA, has had the absolute best data on U.S. energy use and I’d say the broader U.S. industrial economy. I mean, it is just absurdly high quality stuff. If you live in the U.S. And you want to understand, say, the amount of rooftop solar in your state or how many megawatts of battery storage there are in your state or the size of a state’s natural gas production or which state produces the most electricity per person, it’s Wyoming, or whether electricity prices have gone up as demand from AI data centers increases, the answer is all on their website.
Robinson Meyer:
This is not something that I think exists necessarily in other countries. It is actually kind of a unique feature of the U.S. energy economy that we have such high quality data. The issue really has been that this data is incredibly hard to access. In order to find the answer to the question you’re looking for on the EIA website, you have to sort through lots of menus and download obscure files and understand which settings to toggle. And then you have to visualize the answer for yourself.
Robinson Meyer:
Well, earlier this week, all of that changed. Thanks to a new collaboration from Arnold Ventures, the Institute for Progress, and the climate scientist Hannah Ritchie, there is a new website called U.S. Energy Data. You can find it at usenergydata.org or in the show notes.
Robinson Meyer:
It’s a platform that shows you all of the EIA’s data, clearly listed, described, and visualized with well-titled, well-designed charts you can manipulate and share on social media. It is a dream come true for energy and climate nerds, and I am just unabashedly excited about it. I think my only issue with it, actually, is that for those of us who previously had a competitive advantage of being good at pulling EIA data, I mean, it really hurts our hustle. But it’s such an overall exciting development that I wanted to do a little episode on it today. So joining me today is Hannah Ritchie. She is a creator of U.S. Energy Data. She’s also a data scientist and writer and the author of the books Not the End of the World and Cleaning the Air, which were bestsellers. She’s a senior researcher in the Program for Global Development at the University of Oxford and a deputy editor at the online publication Our World in Data, another amazing website. We talk about this new energy platform, how to use it and how it came together and maybe how kind of ordinary people and policymakers and nerds should all think about approaching it. It’s a fun, quick little episode. I’m Robinson Meyer, the founding executive editor of Heatmap News, and all of that and more, it’s all coming up today on Shift Key. Hannah Ritchie, welcome to Shift Key.
Hannah Ritchie:
Thanks so much for having me. It’s great to be here.
Robinson Meyer:
It’s so exciting to have you. Long-time listener and reader and appreciator, first-time interviewer. It’s very exciting to have you on the show. You launched, actually today, on the day we’re recording this, we’ll release this in a few days, but on the day we’re recording this, you released a new tool with the Institute for Progress and the Arnold Foundation here in the United States called U.S. Energy Data. And it is this incredible energy data platform. And I just want to start this conversation by asking you to describe what it is, because in some ways I think, you know, we’ll put the link in the show notes. People can go there. They’ll look at their phones while they’re listening. But it’s actually quite deceptively deep. So why don’t you just start by describing what this tool is for us?
Hannah Ritchie:
Yeah, sure. So we published it under the URL usenergydata.org, so you can go and check it out. And it’s really this data visualization platform that tries to sit between the data provider, in this case, most of the data is from the U.S. Energy Information Administration, and the general public, policymakers, practitioners that have really basic, often very basic questions on energy, like how much solar energy does Texas generate or what’s the price of energy or electricity in California. And actually it’s deceptively hard to find that data quickly or find an answer to that quickly. So we built this platform to basically visualize from prices to bills to electricity generation, sources, reliability, basically picture these kind of interactive maps where you can compare all of these metrics across different states. You can see how they’ve changed over time. In some cases, you can plot one against the other, so often people will have questions of how does electricity prices change based on how much solar or wind a state has. So we basically built this platform so people can go on and explore for themselves these comparisons, changes over time, et cetera.
Robinson Meyer:
It’s so powerful because the EIA was such a good data source. We can talk about this. So there’s so much there. But even as a journalist who covers these topics and feels like I know the EIA data decently well, often my best path for accessing it would be, you know, you put in a command in Claude Code And it like churns for five minutes and then it spits out an answer. But even when it spits out an answer, it’s not necessarily visualized. I would have to take a few more steps to put it in the tool that we use at Heatmap.
Robinson Meyer:
That’s all to say, this tool is extremely useful and I really appreciate it. What did you learn from making this tool? Just in terms of the charts that you encountered while putting the platform together, are there things you thought you believed about U.S. Energy or things you thought to be the case that then upon, you know, working at the call face of the data, so to speak, you discovered were not actually true?
Hannah Ritchie:
Yeah, I mean, I think the first thing I learned is how deep the U.S. EIA data is. Like, I think the point is that it’s a really incredible data source. People collecting this data, publishing it, are doing amazing work. I think where it falls flat is this, like, last hurdle of like making it accessible and usable for people unless you’re like a complete data nerd and know your way around the website and know exactly where to go. So I think one is just appreciation for the depth and detail of the amount of data that’s there. I think in terms of learnings from the data, I think there are quite a lot of things that you would intuitively think to be true. And actually when you start to look at the data, they’re often incorrect. I mean, I think one of the key ones is there’s lots of discussion about, you know, electricity load growth and how that affects prices, right? And often, I guess the conventional wisdom would be from supply and demand, that if your demand is really tightly squeezed, then you see an increase in prices. And actually, when you look at the correlation there, there’s very little, or if anything, it may be slightly points in the opposite direction, right? The states that have had the largest load growth have actually seen the smallest increase in prices, for example, right?
Hannah Ritchie:
I think a very common question people have is how does the, in terms of the energy transition, how does the shift to a given energy source affect prices? And we’re often looking for these correlations like against gas. If gas goes up and down, what happens to prices? Solar and wind. If you generate more solar and wind, does your prices go up and down? I found this in international data previously when I looked at it, that often you’d find very a little correlation for any of the sources which again is quite counterintuitive and you also generally find that with the the u.s state level data where like my can take away from that is like probably i do think the choice of sources does affect prices but i think there are actually other factors in this energy system that are probably overpowering that and therefore you just don’t really see a very very clear signal so there’s lots of stuff like that when you start to explore kind of challenges some of your previous assumptions.
Robinson Meyer:
There’s this great multi-dimensional chart that we will stick in the show notes that I will stick in my email newsletter about this tool that shows exactly that relationship between prices, between electricity cost increase and load growth that I think in a way immediately clarify … I mean, I’m just repeating what you just said, but I think the way that people buying more electricity can actually lower prices because with the electricity system we’re basically all carving up
Hannah Ritchie:
In a fixed price for a
Robinson Meyer:
Part of it Somewhat of a fixed price, exactly, among customers. And so if people are buying more of it, then actually everyone else’s share of that fixed price goes down. But of course, there’s marginal prices too. A complicated little system we have. It just immediately establishes how actually areas with load growth have seen price decreases. I mean, this was the case in the mid-20th century, too, when we saw periods of rapid load growth. We also saw if not prices go down, then prices not go down compared to overall inflation. But there it is in the chart. It’s very cool. It’s so striking. Also, I mean, the other thing about this platform is that it’s going to update over time as the data updates. I’ve seen versions of charts like that before and versions of very well-prepared charts with EIA data, but they tend to be updated by researchers on like a six-month
Robinson Meyer:
basis or an annual basis. When the underlying data source is monthly, and now the chart will actually update on a monthly basis. It’s very exciting. How did this come about?
Hannah Ritchie:
Yeah, so really the pioneer behind it was a guy called Daniel Palken, who is at Arnold Ventures.
Hannah Ritchie:
And he previously was a staffer in government. And this was years ago. He was looking for answers to very simple energy questions to understand what was going on in the state, right? And he, I guess, was quite frustrated by how laborious the process was of going to the EIA, trying to figure out where the thing was you were looking for downloading the data making an excel chart that then goes out of date and the fact that like this should just be much much easier to do so years ago it came to me i work at our own data so i kind of have this data visualization background and said it’d be really helpful could you make this like little mini dashboard and i actually made like a very small version of this years ago it was super super clunky wasn’t great but it kind of did the job right and I just I just did that to try and be helpful in subsequent years he’s now moved to Arnold Ventures and is kind of
Hannah Ritchie:
Leading the kind of energy and infrastructure part there and he was really the drive to say like why don’t we do this properly and build a really good data platform that’s kept up to date the visualizations are not clunky they they work well and he reached out to me to see if that that might be possible and yeah this has been a project that’s kind of been going on for the last six months or so in the background building this and pulling this together and as you see it’s now now live and the key point there is that we will keep this up to date i think there is often this
Hannah Ritchie:
Pattern of dashboards like this coming out not only just in energy but like kind of institutional dashboards coming out and at the start it’s like fantastic we have this new flashy thing and then they very very quickly die because there’s no one there to maintain it or there’s no infrastructure powering it. So we will keep this up to date over time as well.
Robinson Meyer:
I mean, it’s back during the pandemic. I helped start an effort that tracked COVID coronavirus pandemic data and especially testing data from state governments. And it takes an enormous, I mean, at the time we were kind of cobbling the data set together from 50 different sources. So it was a different effort in some ways than I think this platform. But it takes an enormous amount of work and a surprising number of judgment calls. That might be not quite the same in the case of this data because the EIA is already making a lot of those judgment calls, but it takes a lot of work to keep these platforms up to date and is not always a part of the equation that people think about. I mean, it’s really the much more labor-intensive part of the effort, in part because it’s indefinite.
Hannah Ritchie:
And I mean, it’s just underappreciated because, you know, who wants to pay for the maintenance of something, right? Like, you want to pay and be able to say, look, look, we funded this new flashy product. Look how fantastic it is. But paying for someone to sit in the background and make sure it doesn’t break or run a little update so you get one extra data point is just much less attractive. But it’s really, really, I think, essential for these projects to actually have an impact.
Robinson Meyer:
What have you learned running Our World in Data? Because it’s an incredible resource as well, And it has a lot of answers to related questions, to climate change, to emissions, to national development policy, and has also been, as you said, maintained over time in a really, really helpful way. I wonder how that effort informed this one. And also, can you just kind of introduce the idea of Our World and Data for readers or listeners who might not be familiar?
Hannah Ritchie:
Our World in Data, again, is a website, ourworldindata.org. And it’s actually quite similar in, I guess, motivation and structure to what we’ve built for U.S. energy, but it’s global. And it’s not just on energy. So we kind of try to bridge this gap between data providers and academic research and the general public across what we frame as the world’s largest problems. And that’s energy and climate, as you say, but also poverty and inequality and global health. And we try to bring this global data to life so people can answer really basic but really important questions about what’s happening in the world.
Hannah Ritchie:
We’re a non-profit and we have a much larger team than just me, which has largely been the case for this U.S. project. So a much bigger effort. But I think some of the things that I’ve definitely taken into this project, I think there is often this temptation when building these types of tools to just unleash all of the data. And if there’s data there, then of course you should present it and put some toggle or some widget that allows people to explore it. And I think this is often where these projects go wrong is that they become so overwhelming for the users because there’s just so much data there to try and get your head around so I think one of the things I’ve learned through our work on data is this like how important curation is and like trying to understand you know if someone wants to understand a given topic what is that what are the key metrics that they are going to look for and going to need in order to inform that understanding So that curation aspect has been really, really crucial. I think another maybe quite boring one, but essential one is that when it comes to data visualization, often simpler is better.
Hannah Ritchie:
Just some of the most obvious but important visualization types is like a line chart and a bar chart. And those sound super boring. But I think, again, there is the temptation to build this really, really fancy widget model that just becomes so cumbersome and no one can really understand properly what’s going on. And then I think the final one is actually, again, boring, but how crucial it is to make sure the user knows what it is that they’re looking at. I think what’s really, really key is like being able to communicate, look, this is the metric, this is how it’s measured, these are the units. And again, that sounds super, super basic, but at Urban Data, we spend so much time poring over what the title and the subtitle should be. So that if someone takes a screenshot of that chart and shares it on social media, which they always do, are other people getting enough context to understand actually what’s going on and how they should be interpreting it? So I think those are some of the key lessons I carried over.
Robinson Meyer:
And I have seen our world and data charts that are inflation adjusted and say as much in the title than be shared by people on social media who do not realize it’s inflation adjusted, make some comment, assuming it’s not inflation adjusted, and then someone’s responding being like literally the title of the chart says it’s inflation adjusted.
Hannah Ritchie:
Yeah, we have joked that we should just rename it our world and inflation adjusted data. We just always adjust for inflation.
Robinson Meyer:
With Our World in Data, is there a single data source you use, or are you pulling from lots of different places?
Hannah Ritchie:
Oh, pulling from lots of different places. I mean, even in energy and climate, we pull from lots of different data sources. Often there’s some aggregate that does a lot of that curation and pulling together. So on climate, we very heavily use the Global Carbon Project. And they’ve done the pulling all of the country data together. Or on energy, like Ember is a very good data source. But yeah, because we cover so many different topics, we just pull from lots and lots of different data sources. I think that’s a really key part of our work is trying to suss out what’s a good data source and what’s a bad data source and trying to work out if they disagree and why they disagree. Is the methodology different? Is one just very, very poor quality? So that’s a big part of the effort that goes on behind the scenes. And I guess maybe people don’t see from the outside.
Robinson Meyer:
One thing about Our World in Data that, of course, is different from U.S. Energy Data, the site you launched today, is that there’s essentially no, in fact, I think zero subnational data in it. And this new platform is basically all subnational data. You know, there’s 50 state data, too, but it’s primarily about subnational data. And I was wondering what made you kind of make a subnational data platform. Obviously, it helps that Arnold Ventures was interested, but why get involved in subnational data at this point?
Hannah Ritchie:
At Our World in Data, we’ve always debated over and over again, like, should we do subnational data? And this has gone on for many years. One of the barriers to us doing that previously was that often there was very, very little subnational data. Again, we’re talking about global in scope, and that’s our aim is to show the global picture. The U.S. is probably an exception and actually having pretty rich sub-national data, most countries don’t.
Robinson Meyer:
How does EIA data compare to what’s available from other countries?
Hannah Ritchie:
I think very high quality and in terms of like rankings I would say it’s very high quality in terms of the range of metrics, the frequency of updates, the fact that you do have this very organized sub-national data like
Hannah Ritchie:
Let’s not underestimate how important it is to have like a reasonably consistent data structure for an excel file or a csv file which again many countries don’t sadly we definitely found that out during the pandemic like we were also doing a lot of data collection and gathering across countries and you would be i don’t know about if appalled is the right word but the you know the lack of consistency and just putting out pretty basic data structure in some countries was quite staggering so yes the us is like very high on the like can you format an excel file well um so it does very very well that’s been a key barrier our own data is that like there are a couple of countries where this is available but then i don’t know do we want to just do it for one or two does that mean we’re like introducing favoritism or inequality in that so the drive has always been there because i think you do often get much richer insights by looking at subnational data, especially for a country as big as the U.S. You know, there are just huge, vast differences across the country. So this kind of side project was just like a really good way for me to branch out and delve into that.
Robinson Meyer:
You know, there’s people listening to this. I’m sure they’re like, this sounds like a cool platform. And I’m sure as you were making the platform, you had in your head ideas of different kinds of users or different charts or, you know, different scenarios where you’re like, oh, this chart or this data is going to be really useful for this type of person. Or, oh, if I was working on this problem, I’d really ... Want to see this data. And here it is. A lot of different people list a shift key. There’s policymakers, there’s researchers,
Hannah Ritchie:
There’s just, you know.
Robinson Meyer:
Regular Americans who care about energy issues. And what are some of the storylines or what are some of the use cases you’ve imagined in your heads? Like how should people start to crack into this platform and where might they find it to be the most useful?
Hannah Ritchie:
Yeah. So there are different types of users. There’s one user that knows this is exactly what I need. I need this data or this chart. And they can come there and there’s a very good search function and they should be able to get to their answerer
Hannah Ritchie:
Within 10 seconds. If it takes them more than 10 seconds, then I think I’ve failed in my job to get them there, if that data exists on the platform. So there are these kind of, you know, very determined users that know exactly what it is that they want, and we hopefully serve them. There are other users that, you know, are interested, you know, what’s going on with electricity prices? Like, what are the differences across different states? How are they changing over time? Maybe some of this discussion of, like, what correlates with changes in prices is it energy sources is it load growth these more exploratory users and the way we’ve we’ve kind of catered to that is that like we’ve basically chunked it into topics so there’s stuff on prices there’s stuff on generation there’s stuff on reliability so I guess that’s another type of user and then there are people that are just really hyper focused on what’s going on in my state and I guess this is maybe more of like a policy maker type user
Hannah Ritchie:
And there we’ve created state profiles so you can go to a profile on Texas and Texas is pre-loaded in all of the charts so you can just scan and just everything’s about Texas and you can see where it is on the rankings on prices or where it is on the rankings on the share of electricity from solar or whatever it the metric is. And you can see how all of this is changing over time. So I think there are kind of three different routes then. There’s the, like, I know exactly what I want. There’s a, I’m just here to browse and I’m curious. And there’s a, I’m very, very focused on one particular state, like, give me all the data I need on this.
Robinson Meyer:
As we’re having this conversation, it’s quite interesting because we’re talking about climate, we’re talking about emissions, we’re talking about energy. I think of Our World in Data as working, as you said, at the nexus of a lot of the world’s most important problems, certainly its biggest problems that are measurable and tractable. And we’re having, at least in the U.S. today, the beginning of this big public debate about artificial intelligence and existential risk. And I actually kind of think of the Our World in Data dataset and Our World in Data project as spanning a gap that can exist between people who care about lots of different kinds of existential risks and climate change. And I was wondering what you just make of this moment and this debate? Perhaps you’re like me and think, oh, it seems like an important problem. I have a lot of other stuff to do, though. So glad that smart people are on that. That’s not the only thing I think. I wonder what you’re just making of this moment.
Hannah Ritchie:
Yeah, I mean, I think in particular on AI, I have very mixed opinions. I think there are plenty of reasons I am excited about it. Like I think the scope there for innovation, for curing diseases for i don’t know helping with the energy transition i think there are lots of you know upsides potentially to ai but i also think there are potential downsides and potentially very large downsides one is the kind of economic concerns on job security and and what happens to the economy and then there are these more existential risks and i think i’m somewhat similar to you in that I feel under-resourced, not intelligent enough to be able to dive in and actually move that debate and that argument forward and I’m very happy that there are others doing that. But I also find myself increasingly struggling to navigate the
Hannah Ritchie:
Very large and conflicting opinions on this where i feel like often for most other topics i always have go to people in particular areas where i’m like i’m going to listen to their take on that and i actually have like pretty good confidence that they are correct on this and i think ai what i’m struggling with ai is that there are people that i like generally trust but they actually are presenting very, very
Hannah Ritchie:
Conflicting arguments. And I struggle to navigate who I think is most correct or actually how to navigate that moment in general.
Robinson Meyer:
I mean, AI is so different than climate change because like climate change, it relies on this belief in exponential change and runaway mechanisms that then elude anyone’s ability to govern it. But unlike climate change, it doesn’t emerge from changes in the physical system. I mean, there’s a number of stories that I think seems to me that one could find plausible that would lead to someone being concerned about AI. But it makes me realize like what a useful intervention the Intergovernmental Panel on Climate Change is, even though obviously now we’re eight or nine cycles into it. And maybe it hasn’t done everything that its initial visionaries kind of hoped it would do, and maybe it hasn’t completely depoliticized this issue. Obviously, it hasn’t completely depoliticized this issue. And maybe you can bicker with some particular ways that it words findings. And yet, it has led to this creation of this body of knowledge that we can all talk about and argue over and draw our own risk assessments from in a way that doesn’t really seem to exist for AI in the same way. But of course, AI is quite different because it’s advancing quickly.
Hannah Ritchie:
Yeah, I think the large difference there is speed. Yes, there are risks with climate change that can happen quite quickly and quite suddenly. But you know we have been you know researching this and developing a body of knowledge for this for many many decades now right and so in that speed sense it’s been relatively slow moving and there’s been the ability to build up this consensus and you can have the ipcc reports which happen on very very long time scales and the point with ai is that it’s just moving extremely quickly And therefore it seems much more difficult to build up this kind of consensus of where it’s going. And if you wanted to steer it in a different direction, how would you do that? And how do you form regulation to do that? It seems that the speed of progress here is kind of putting all of that aside.
Robinson Meyer:
One thing that I so appreciate about your work and even two books about climate change and Our World in Data is that it is grounded, as it says in the title, in data. And that means that unlike those of us who are maybe in the news cycle every day and following the vagaries of policy moving one way and then moving the other way, having a framework through which to understand the world, I think a data-driven framework especially, means that you can update more slowly. And at least when you update your worldview, it’s grounded in a change which is surprising you or important or that’s standing out, you know, in. The real world and not just in the kind of discursive or political world that we tend to cover.
Robinson Meyer:
The risk of asking a very large question, like how are you feeling about global decarbonization at the moment? As someone who works in the data, who looks at the data, what do you think hasn’t been noticed at the moment? I have a candidate here, but I’m curious what you think as well.
Hannah Ritchie:
I think that in terms of global decarbonisation, I’m still pretty optimistic. And I think one of the key distinctions there, I think when it comes to these discussions, we do naturally focus on the U.S.. And I think decarbonisation in the U.S. has gone slowly and too slowly and has faced setbacks. And I think there is the temptation to extrapolate that view and say, well, the world is not doing well on decarbonisation. And I don’t think that’s correct. I think...
Hannah Ritchie:
To not be too much of a centrist on this like we’re not going as fast as i would like or what we frame as what we should need to be but i do actually think that things are moving pretty quickly and accelerating in other parts of the world and i think the challenge there is i think people are not saying that yes china is moving very quickly on this but a key point there is if you look at other countries low and middle income countries across latin america or sub-saharan Africa or Asia, many of those countries are also moving fast. And I think that’s underappreciated. And I think they’re moving fast because the energy transition and electrification and decarbonisation just increasingly makes economic sense to do so. So I guess the trade-off between increasing energy services for people, for which in many low and middle income countries, that’s just a core part of development and a key priority is no longer incompatible with also doing that in a relatively low carbon way and I think that’s a really key underappreciated point and you start to see that in these kind of annual updates of what happened in the last year and I think you miss it if you’re only looking at you know the headline from yesterday and the headline from today.
Robinson Meyer:
That’s very helpful to hear and good to know that you are still cautiously or reservedly optimistic. I think of that as a point of view you’re often good at finding too. I am a little worried about the increase in global coal use, I have to say. There’s kind of two energy security models in the world right now. There’s like the U.S. model where you have abundant liquid fuels. And so even when there’s a global energy crisis, to some degree, you’re still able to provision quasi-affordable, you know, transportation services and other forms of energy services, just because you’re sitting on a big fossil fuel reserves. And then there’s the Chinese model, which is like you electrify everything that touches a seaborne liquid fuel, and you electrify it basically on the back of like a coal and solar fleet, which is totally counterintuitive to maybe how we were thinking the energy transition would go 25 years ago or 40 years, 30 years. There’s a lot of countries that are closer to China’s position in the world than in the U.S. position simply because they don’t have a stockpile or proven reserves of liquid fuels and are not high-income countries. I just worry that the shift to electrification we are seeing, especially in the transport sector, is like also a shift to coal as well as a shift to solar. I mean, better than a shift to coal by itself, I suppose.
Hannah Ritchie:
Yeah, but even if you’re looking at the maths of that, like running an electric car on coal is still better than running on gasoline. Not much more, right? Yeah. But even if you have a predominantly coal-powered fleet, that’s actually still a bit better for decarbonisation than going straight to gasoline and locking in that kind of model of transport. And of course, even countries like China and India don’t run on 100% coal, right? Increasingly, the share of coal in China’s electricity mix is going down and going down pretty quickly. So I think the challenge there is like, what’s the counterfactual for which we are like comparing to, right? There’s this like ideal scenario of the pace we would like to be going. There’s some scenario where actually the energy transition is not really happening at all. And what would that look like? And we’re somewhere in the middle there. And I guess the question is like, are you closer to one ideal or the pessimistic alternative?
Robinson Meyer:
And what’s the counterfactual is a very good question to ask there. Well, we are going to have to leave it there. Hannah Ritchie, thank you so much for joining us. You can find U.S. Energy Data at usenergydata.org. We’ll also stick it in the show notes and we’ll stick Our World in Data in the show notes too. and I recommend everyone have fun and play around in it because there is actually so much there. Even during this interview, I was clicking around to like check something and seeing charts that I wish I had had writing stories in the past week. And so I’m very excited to have it now as a resource. So thank you so much and thank you for joining us.
Hannah Ritchie:
Thanks so much, Rob. Thanks.
Robinson Meyer:
Thanks so much for listening. We’ll be back soon with some very, very exciting episodes of Shift Key. If you’re coming to our New York Climate Week event, I’m excited to see you. That’s next week, September 23 in New York City. Until then, Shift Key is a production of Heatmap News. Our editors are Jillian Goodman and Nico Lauricella. Multimedia editing and audio engineering is by Jacob Lambert and by Nick Woodbury. Our music is by Adam Kromelow. Thanks so much for listening. We’ll see you soon.