You’re out of free articles.
Log in
To continue reading, log in to your account.
Create a Free Account
To unlock more free articles, please create a free account.
Sign In or Create an Account.
By continuing, you agree to the Terms of Service and acknowledge our Privacy Policy
Welcome to Heatmap
Thank you for registering with Heatmap. Climate change is one of the greatest challenges of our lives, a force reshaping our economy, our politics, and our culture. We hope to be your trusted, friendly, and insightful guide to that transformation. Please enjoy your free articles. You can check your profile here .
subscribe to get Unlimited access
Offer for a Heatmap News Unlimited Access subscription; please note that your subscription will renew automatically unless you cancel prior to renewal. Cancellation takes effect at the end of your current billing period. We will let you know in advance of any price changes. Taxes may apply. Offer terms are subject to change.
Subscribe to get unlimited Access
Hey, you are out of free articles but you are only a few clicks away from full access. Subscribe below and take advantage of our introductory offer.
subscribe to get Unlimited access
Offer for a Heatmap News Unlimited Access subscription; please note that your subscription will renew automatically unless you cancel prior to renewal. Cancellation takes effect at the end of your current billing period. We will let you know in advance of any price changes. Taxes may apply. Offer terms are subject to change.
Create Your Account
Please Enter Your Password
Forgot your password?
Please enter the email address you use for your account so we can send you a link to reset your password:
Sweltering heat and earlier sunsets are a big problem for solar power.
The biggest problem in renewable energy goes by a few names.
Classically, it’s called the “duck curve,” which shows the relationship between solar generation and how much power the rest of the grid uses during the day. At the bottom of the curve, typically around midday, solar can sometimes generate 100% of the power demanded from the grid. But as the sun traces its arc towards the horizon, solar power generation falls and then quickly goes to zero as the sun sets. Often, temperatures and electricity use remains high, especially as people come home from work and start using home appliances, meaning non-solar sources of power must quickly come on line to fill in the gap.
It’s not a coincidence that utilities and grid operators tend to ask consumers to conserve in the later afternoon or evening. The phenomenon is classically associated with solar-heavy California, but it has come to Texas as well, where it goes by the name of the “Armadillo Curve” or the “Dead Armadillo Curve.”
But the relation between the sun and the Earth doesn’t just create darkness and light on daily scales but on annual ones as well. Yes, I know this isn’t breaking news, but it’s important, especially as the power system and climate are changing.
Right now we might be in the neck of the annual duck curve.
In case you haven’t noticed, the sun is setting earlier and it’s still really hot out. Kids are going back to school while much of the country is still facing summer temperatures.
In New York City this week, high temperatures are forecast to get into the 90s, while the sun will set before 7:30; in Washington, D.C., forecast highs are over 100 later this week with a sunset just past 7:30; in Houston, daytime highs to get over 100 later this week, with the sun setting before 7:40; and in Los Angeles , sunsets are at around 7:15 with expected daytime highs in the 90s this weekend.
And Septembers are only getting hotter. Septembers 2021 and 2022 were tied for the fifth hottest on record for the last 143 years, according to the National Oceanic and Atmospheric Administration; 10 of the hottest Septembers have occurred since 2012. The warmest was in 2020.
These higher temperatures mean prolonged periods of high electricity usage, even as one resource — solar — becomes less potent. This matters because, at least in the United States, we tend to organize our lives — and our electricity usage — around the clock, not the sun.
As the sun is setting earlier, our high electricity usage stretches longer compared to the length of the solar day, exacerbating the duck curve dynamics inherent to solar power. A dishwasher that runs when the sun’s still up in July is pulling the same power from the grid as one that runs during fall’s early twilight. The saving grace of shorter days in a grid that uses solar power is supposed to be that air conditioning usage goes down, but that doesn’t happen when summer temperatures persist past Labor Day.
If hot Septembers and even Octobers become the norm, grid conditions could tighten up both during and across the days, with higher cost, less reliable power or increased usage of fossil fuels to fill in the gap.
These longer, hotter summers can make operating electric grids more difficult. ERCOT, the electricity market that covers the vast majority of Texas, restricts power plants from having planned outages between May 15 and September 15 for maintenance. While still in the summer restriction window, ERCOT on Tuesday issued an alert for later this week, warning of “forecasted higher temperatures, higher electrical demand, and the potential for lower reserves.” If ERCOT extends its restrictions on outages for maintenance, there should be more unplanned outages, making power scarcer, meaning higher prices and a greater possibility of blackouts.
Not every country sees peak electricity usage in late summer. In New England, peak electricity demand tends to hit in July. In the sprawling PJM Interconnection last year, the electricity market that spans from the Chicago area to Virginia, demand peaks tended to be in June or August. In New York, peak demand is often in July.
But summer peaks are later in the year in two the country's largest electricity markets: California and Texas.
The Texas energy market had hit its peak day in July in 2022, but it moved out to August this year. And Texas is already bursting through its September demand records. It reached over 78,000 megawatts in just the first week of this month, well over its previous record of 72,370 megawatts, which it set in 2021.
And California hit its power demand record last September amidst a heat wave that covered much of the western United States.
It’s not just there being literally fewer hours of sunlight that drags down solar production later in the year, but also the lower angle of the sun. “As the sun gets lower in the sky we see solar production numbers will drop,” Joshua Rhodes, a senior research scientist at the University of Texas, told me.
“As the sun is lower in the sky it’s up fewer hours ... the photons are coming in at a steeper angle, the panels are not going to get as much light. Even when the sun is at the highest point of the day, the panels are not getting the same level of irradiance as when the sun is at the highest point of the day [at other times of year].”
The best angle for solar panels can change around 15 degrees a year, depending on the year and solar panels are more efficient when they can track the sun during the day. Most homeowners who install solar panels won’t have tracking technology, while utility-scale solar developers are more likely to. This means that a state like Texas, whose renewable mix is more focused on large solar arrays, could see less dramatic drop-offs in solar power throughout the day or throughout the year than a state like California, which has more residential solar.
A roof-mounted four kilowatt-hour solar PV system with standard specs where I grew up in Northern California would get 7.45 kilowatts-hours per meter squared per day in July, generating 689 kilowatt-hours of power, according to National Renewable Energy Laboratory PVWatts tool; in September, solar radiation would drop down to 6.6 kilowatt-hours per meter squared per day and 587 kilowatt-hours per month.
This admittedly basic math suggests it's possible California could struggle this month — and in future Septembers — with meeting electricity demand.
In the past 10 years, California’s annual load peak has occurred in September five times, with the peak loads in 2022 and 2021 occurring on September 6 and 8 respectively.
This year has been, so far, not particularly stressful for the Golden State’s grid thanks to some good luck — no region-wide, prolonged heat waves that max out California’s grid and make imports scarce, mild temperatures on the coasts where the state’s population is concentrated, no major wildfires, and plentiful hydro power thanks to massive snowfall this past winter — as well as massive deployment of batteries across the grid. The batteries especially can help alleviate these duck curve dynamics, as they essentially redistribute power from the sunniest part of the day to the evenings.
While Texas set several new records this year in electricity usage, California has stayed well short of its 52,000 megawatt record last September. California set records for solar power in June and July, with almost 16,000 megawatts, while total demand over 40,000 megawatts.
“While we haven’t seen substantial stress on the grid this summer, we haven’t been fully tested. If we got the kind of west-wide heat we experienced in September 2022, we could need to tap into the state’s emergency or strategic reserves again,” Anne Gonzales, a spokesperson for the California Independent System Operator, told me in an email.
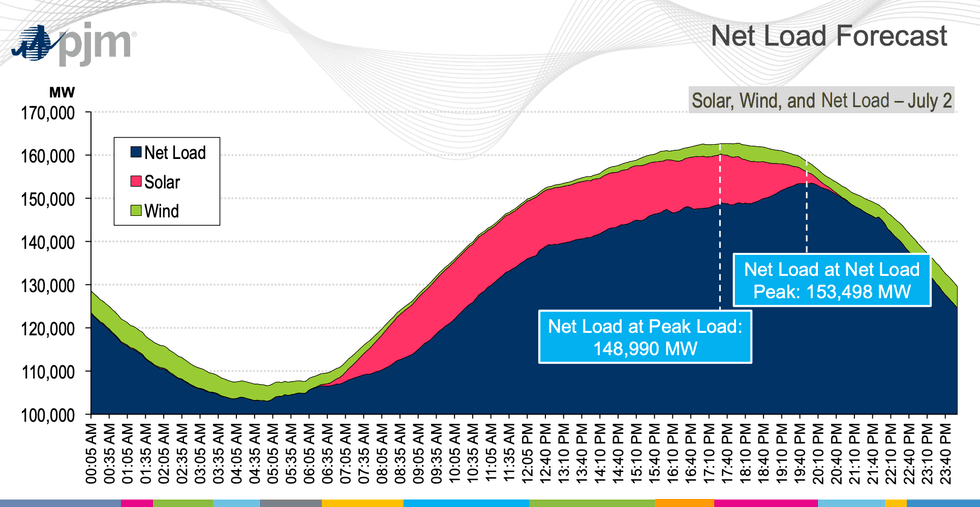
Log in
To continue reading, log in to your account.
Create a Free Account
To unlock more free articles, please create a free account.
A conversation with Scott Cockerham of Latham and Watkins.
This week’s conversation is with Scott Cockerham, a partner with the law firm Latham and Watkins whose expertise I sought to help me best understand the Treasury Department’s recent guidance on the federal solar and wind tax credits. We focused on something you’ve probably been thinking about a lot: how to qualify for the “start construction” part of the new tax regime, which is the primary hurdle for anyone still in the thicket of a fight with local opposition.
The following is our chat lightly edited for clarity. Enjoy.
So can you explain what we’re looking at here with the guidance and its approach to what it considers the beginning of construction?
One of the reasons for the guidance was a distinction in the final version of the bill that treated wind and solar differently for purposes of tax credit phase-outs. They landed on those types of assets being placed in service by the end of 2027, or construction having to begin within 12 months of enactment – by July 4th, 2026. But as part of the final package, the Trump administration promised the House Freedom Caucus members they would tighten up what it means to ‘start construction’ for solar and wind assets in particular.
In terms of changes, probably the biggest difference is that for projects over 1.5 megawatts of output, you can no longer use a “5% safe harbor” to qualify projects. The 5% safe harbor was a construct in prior start of construction guidance saying you could begin construction by incurring 5% of your project cost. That will no longer be available for larger projects. Residential projects and other smaller solar projects will still have that available to them. But that is probably the biggest change.
The other avenue to start construction is called the “physical work test,” which requires the commencement of physical work of a significant nature. The work can either be performed on-site or it can be performed off-site by a vendor. The new guidance largely parrotted those rules from prior guidance and in many cases transferred the concepts word-for-word. So on the physical work side, not much changed.
Significantly, there’s another aspect of these rules that say you have to continue work once you start. It’s like asking if you really ran a race if you didn’t keep going to the finish line. Helpfully, the new guidance retains an old rule saying that you’re assumed to have worked continuously if you place in service within four calendar years after the year work began. So if you begin in 2025 you have until the end of 2029 to place in service without having to prove continuous work. There had been rumors about that four-year window being shortened, so the fact that it was retained is very helpful to project pipelines.
The other major point I’d highlight is that the effective date of the new guidance is September 2. There’s still a limited window between now and then to continue to access the old rules. This also provides greater certainty for developers who attempted to start construction under the old rules after July 4, 2025. They can be confident that what they did still works assuming it was consistent with the prior guidance.
On the construction start – what kinds of projects would’ve maybe opted to use the 5% cost metric before?
Generally speaking it has mostly been distributed generation and residential solar projects. On the utility scale side it had recently tended to be projects buying domestic modules where there might have been an angle to access the domestic content tax credit bonus as well.
For larger projects, the 5% test can be quite expensive. If you’re a 200-megawatt project, 5% of your project is not nothing – that actually can be quite high. I would say probably the majority of utility scale projects in recent years had relied on the manufacturing of transformers as the primary strategy.
So now that option is not available to utility scale projects anymore?
The domestic content bonus is still available, but prior to September 2 you can procure modules for a large project and potentially both begin construction and qualify for the domestic content bonus at the same time. Beginning September 2 the module procurement wouldn’t help that same project begin construction.
Okay, so help me understand what kinds of work will developers need to do in order to pass the physical work test here?
A lot of it is market-driven by preferences from tax equity investors and tax credit buyers and their tax counsel. Over the last 8 years or so transformer manufacturing has become quite popular. I expect that to continue to be an avenue people will pursue. Another avenue we see quite often is on-site physical work, so for a wind project for example that can involve digging foundations for your wind turbines, covering them with concrete slabs, and doing work for something called string roads – roads that go between your turbines primarily for operations and maintenance. On the solar side, it would be similar kinds of on-site work: foundation work, road work, driving piles, putting things up at the site.
One of the things that is more difficult about the physical work test as opposed to the 5% test is that it is subjective. I always tell people that more work is always better. In the first instance it’s likely up to whatever your financing party thinks is enough and that’s going to be a project-specific determination, typically.
Okay, and how much will permitting be a factor in passing the physical work test?
It depends. It can certainly affect on-site work if you don’t have access to the site yet. That is obviously problematic.
But it wouldn’t prevent you from doing an off-site physical work strategy. That would involve procuring a non-inventory item like a transformer for the project. So there are still different things you can do depending on the facts.
What’s your ultimate takeaway on the Treasury guidance overall?
It certainly makes beginning construction on wind and solar more difficult, but I think the overall reaction that I and others in the market have mostly had is that the guidance came out much better than people feared. There were a lot of rumors going around about things that could have been really problematic, but for the most part, other than the 5% test option going away, the sense is that not a whole lot changed. This is a positive result on the development side.
And more of the week’s most important news around renewable energy conflicts.
1. Carroll County, Arkansas – The head of an influential national right-wing advocacy group is now targeting a wind project in Arkansas, seeking federal intervention to block something that looked like it would be built.
2. Suffolk County, New York – EPA Administrator Lee Zeldin this week endorsed efforts by activists on Long Island to oppose energy storage in their neighborhoods.
3. Multiple counties, Indiana – This has been a very bad week for renewables in the Sooner state.
4. Brunswick County, North Carolina – Duke Energy is pouring cold water on anyone still interested in developing offshore wind off the coast of North Carolina.
5. Bell County, Texas – We have a solar transmission stand-off brewing in Texas, of all places.
Is there going to be a flight out of Nevada?
Donald Trump’s renewables permitting freeze is prompting solar companies to find an escape hatch from Nevada.
As I previously reported, the Interior Department has all but halted new approvals for solar and wind projects on federal lands. It was entirely unclear how that would affect transmission out west, including in the solar-friendly Nevada desert where major lines were in progress to help power both communities and a growing number of data centers. Shortly after the pause, I took notice of the fact that regulators quietly delayed the timetable by at least two weeks for a key line – the northern portion of NV Energy’s Greenlink project – that had been expected to connect to a litany of solar facilities. Interior told me it still planned to complete the project in September, but it also confirmed that projects specifically necessary for connecting solar onto the grid would face “enhanced” reviews.
Well, we have the latest update in this saga. It turns out NV Energy has actually been beseeching the Federal Energy Regulatory Commission to let solar projects previously planned for Greenlink bail from the interconnection queue without penalty. And the solar industry is now backing them up.
In a July 28 filing submitted after Interior began politically reviewing all renewables projects, NV Energy requested FERC provide a short-term penalty waiver to companies who may elect to leave the interconnection queue because their projects are no longer viable. Typically, companies are subject to financial penalties for withdrawals from the queue, a policy intended to keep developers from hogging a place in line with a risky project they might never build. Now, at least in the eyes of this key power company, it seems Trump’s pause has made that the case for far too many projects.
“It is important that non-viable projects be terminated or withdrawn so that the queue and any required restudies be updated as quickly as possible,” stated the filing, which was first reported by Utility Dive earlier this week. NV Energy also believes there is concern customers may seek to have their deals for power expected from these projects terminated under “force majeure" clauses, and so “the purpose of this waiver request is thus to both clear the queue to the extent possible and avoid unneeded disputes.”
On Monday, the Solar Energy Industries Association endorsed the request in a filing to the commission made in partnership with regional renewable trade group Interwest Energy Alliance. The support statement referenced both the recent de facto repeal of IRA credits as well as the permitting freeze, stating it now “appears that federal agency review staff are unsure how to proceed on solar projects.” This even includes projects on private lands, a concern first raised by Nevada Gov. Joe Lombardo, a Republican, after the permitting freeze came into effect.
The groups all but stated they anticipate companies will pull the plug on solar projects in Nevada, proclaiming that by granting the waiver, “it will encourage projects facing uncertainty due to recent legislation and federal action to exit the process sooner and without penalty, creating more certainty for the remaining projects.”
How this reads to me: Energy developers are understandably trying to figure out how to skate away from this increasingly risky situation as cleanly as they can. It’s anybody’s guess if FERC is willing to show lenience toward these developers.