You’re out of free articles.
Log in
To continue reading, log in to your account.
Create a Free Account
To unlock more free articles, please create a free account.
Sign In or Create an Account.
By continuing, you agree to the Terms of Service and acknowledge our Privacy Policy
Welcome to Heatmap
Thank you for registering with Heatmap. Climate change is one of the greatest challenges of our lives, a force reshaping our economy, our politics, and our culture. We hope to be your trusted, friendly, and insightful guide to that transformation. Please enjoy your free articles. You can check your profile here .
subscribe to get Unlimited access
Offer for a Heatmap News Unlimited Access subscription; please note that your subscription will renew automatically unless you cancel prior to renewal. Cancellation takes effect at the end of your current billing period. We will let you know in advance of any price changes. Taxes may apply. Offer terms are subject to change.
Subscribe to get unlimited Access
Hey, you are out of free articles but you are only a few clicks away from full access. Subscribe below and take advantage of our introductory offer.
subscribe to get Unlimited access
Offer for a Heatmap News Unlimited Access subscription; please note that your subscription will renew automatically unless you cancel prior to renewal. Cancellation takes effect at the end of your current billing period. We will let you know in advance of any price changes. Taxes may apply. Offer terms are subject to change.
Create Your Account
Please Enter Your Password
Forgot your password?
Please enter the email address you use for your account so we can send you a link to reset your password:
If you want to decarbonize concrete, it helps to understand the incredible scale of the problem.

To say that concrete poses a decarbonization challenge would be an understatement. Cement production alone is responsible for somewhere between 5 and 10% of global CO2 emissions [0], roughly two to four times more than aviation, a fact that even the construction industry is finally coming to grips with.
And yet the real problem with decarbonizing concrete isn’t the scale of its emissions, it’s the scale of concrete itself. There is simply a preposterous amount of the stuff. Contemplating concrete is like contemplating the universe — awesome, in the old God-fearing definition of the word.
Before we get into the jaw-dropping amount of concrete we produce every year, it’s worth briefly discussing how the stuff is made, and thus where its emissions come from.
Concrete is formed by mixing together cement (mostly calcium silicates), aggregates (such as sand and gravel), and water into a liquid slurry. The cement reacts with the water, forming a paste that binds the mixture into a single solid mass. Beyond concrete’s high strength and low cost, it’s these liquid beginnings that make concrete so useful. It can easily be formed into any shape and leveled with the help of gravity so you can walk on it or park a car 10 stories up on it. Essentially all modern concrete is also reinforced with steel bars, which provide tensile strength and arrest cracks.
So what about the emissions? Roughly 70-90% of the embodied carbon in concrete comes from manufacturing just the cement [1]. Partly this is because making cement is an energy-intensive process — limestone and clay are put into a kiln and heated around 2500 degrees Fahrenheit. But it’s also because the chemical reaction that turns the limestone into cement (known as calcination) releases CO₂ as a byproduct. Roughly 50-60% of cement’s carbon emissions are due to calcination [2], and thus wouldn’t be addressed by moving to less carbon-intensive electricity sources, like green hydrogen.
Now for the good stuff. Again, the most important thing to understand about concrete is the scale of its production. The world produces somewhere around 4.25 billion metric tons of cement annually (though estimates vary) [3], which works out to about 30 billion tons of concrete produced each year [4].
How much are 30 billion tons?
One way of looking at it is we produce around 4 metric tons, or just under 60 cubic feet (roughly a cube 4 feet on a side), of concrete for each person on the planet each year.
Another way of looking at it is to consider the total amount of mass, full stop, that civilization ingests each year. Estimates here vary quite a bit, but it seems to be in the neighborhood of 100 billion tons [5]. So of the total volume of material that gets extracted and used each year — including all mining, all oil drilling, all agriculture and tree harvesting — around 30% of it by mass goes toward making concrete. The amount of concrete produced each year exceeds the weight of all the biomass we use annually, and all the fossil fuels we use annually.
Total civilization annual material extraction, via Krausmann et al 2018. This is up to 2015, and has now exceeded over 90 Gt/year, with another ~8 Gt/year of recycled material.
Another way of looking at it is that the total mass of all plants on Earth is around 900 billion metric tons. So at current rates of production, it would take about 30 years to produce enough concrete to exceed all the Earth’s plant (dry) biomass.
Because humans have been producing concrete for a while, and because concrete tends to last a long time, we seem to be on the cusp of this happening. Elhacham et al 2020 estimate that total human-created mass (roughly half of which is concrete) reached the total weight of all Earth’s biomass sometime in 2020. Eyeballing their graph, concrete alone will exceed the total weight of all biomass sometime around 2040.
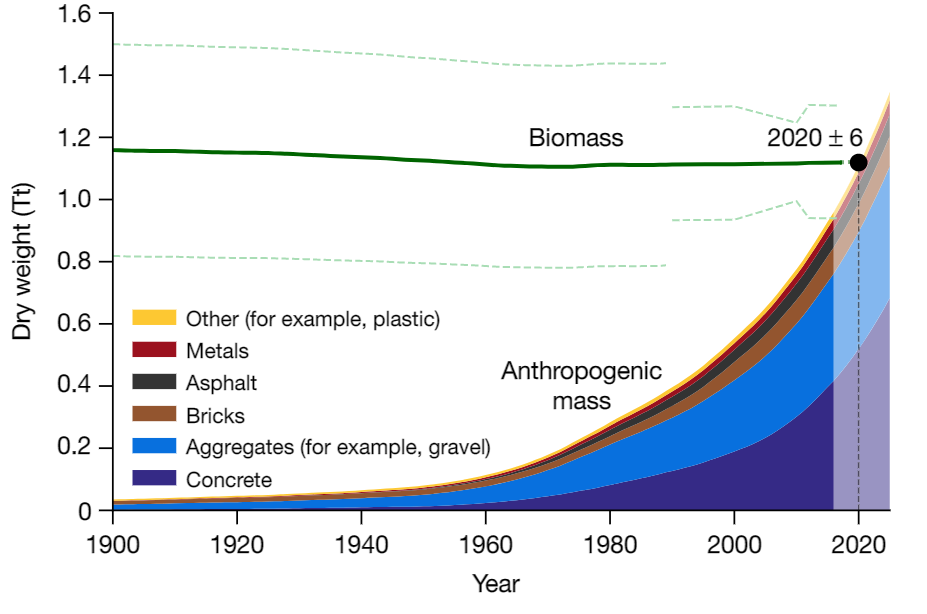
Anthropogenic mass vs biomass during the 20th century, via Elhacham et al 2020
In a pure mass-flow sense, human civilization is basically a machine for producing concrete and gravel (and to a lesser extent bricks and asphalt).
So civilization uses a lot of concrete. Where is it all going?
China, mostly. In recent history, China has been responsible for roughly half the world’s cement production, and by implication, concrete use [6]. The U.S., by comparison, only uses 2%, with Europe using another 5%.
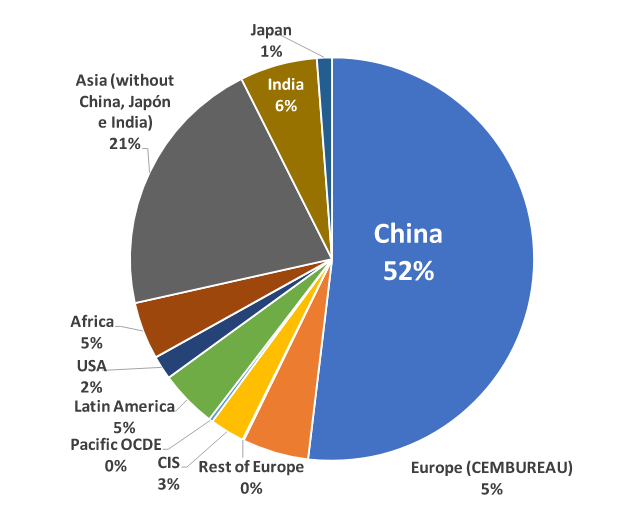
Cement production by region, via Sanjuan et al 2020. Since cement production roughly tracks consumption (see here and here), we can also use this as a rough guide toward where concrete is used. Note that this gives yet another value for total global cement production of 4.65 Gt
Here’s another view from around 2010, showing what this has looked like over time (data after 2010 is a projection).
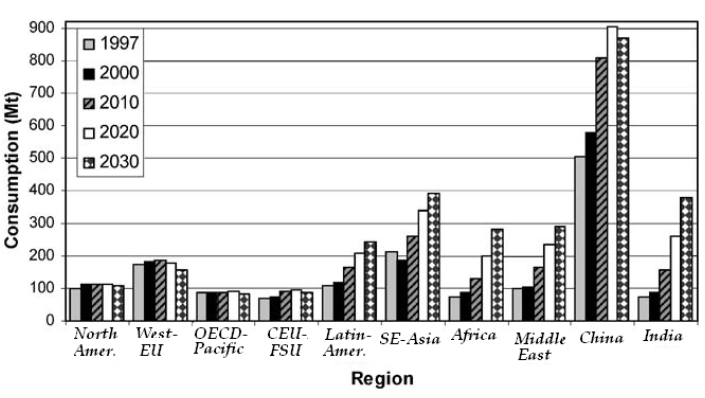
Cement consumption by region, via Altwair 2010
This gets summarized in the oft-repeated statistic that China used more cement in three years than the U.S. did in the entire 20th century.
But since China has a much larger population than the U.S., we can get a more intuitive understanding of this by looking at cement consumption per capita. Here’s per capita consumption sometime around 2015:
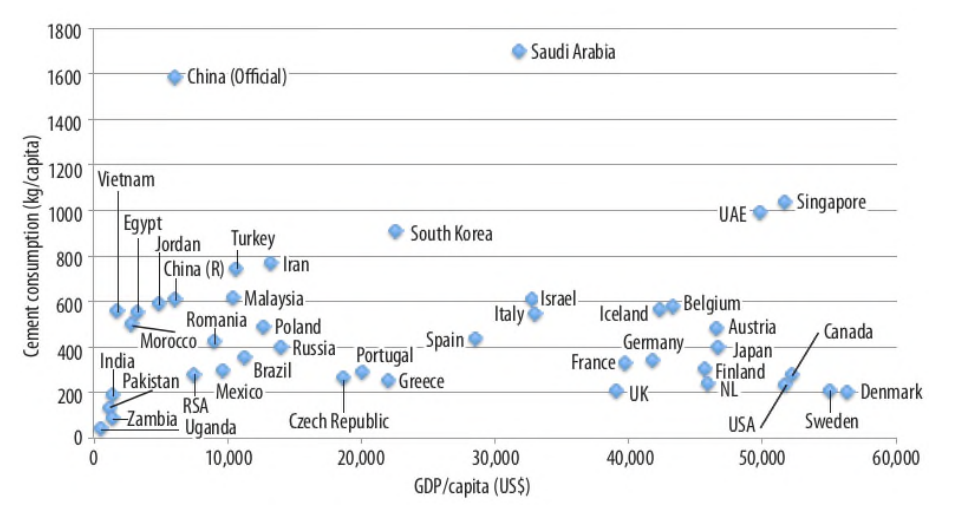
Per capita cement consumption by country, via Globbulk
We see that the official numbers from China make it a huge outlier in cement consumption, using around eight times as much per capita as the U.S. However, in per capita terms, some Middle Eastern countries exceed it. Saudi Arabia is higher, and Qatar, which is somewhere over 2,000 kg/capita, is so high it doesn’t even show up on the graph. It’s the combination of China’s huge population and its huge per-capita consumption that make it such an outlier in concrete production.
The official Chinese numbers are so huge, in fact, that some analysts suspect that they’re inflated, either by manipulating the data or by producing construction projects that don’t have actual demand (or both). The graph above also includes a more “realistic” estimate (which is still 3x as high as U.S. per-capita use).
What does all this concrete construction mean in practical terms? Well, China has somewhere around 50-60% of the floor space per capita as the U.S. does, or roughly as much living space per capita as most European countries [7]. This is the result of a massive trend toward urbanization over the last quarter century. Urbanization rates went from around 25% in 1990 to 60% in 2017, a period in which China’s population also increased by 250 million. In other words, in less than 30 years over 550 million moved into Chinese cities, and they all needed somewhere to live. By building enormous numbers of concrete high rises, in under 20 years China quintupled its urban residential floor space and doubled its residential floor space overall.
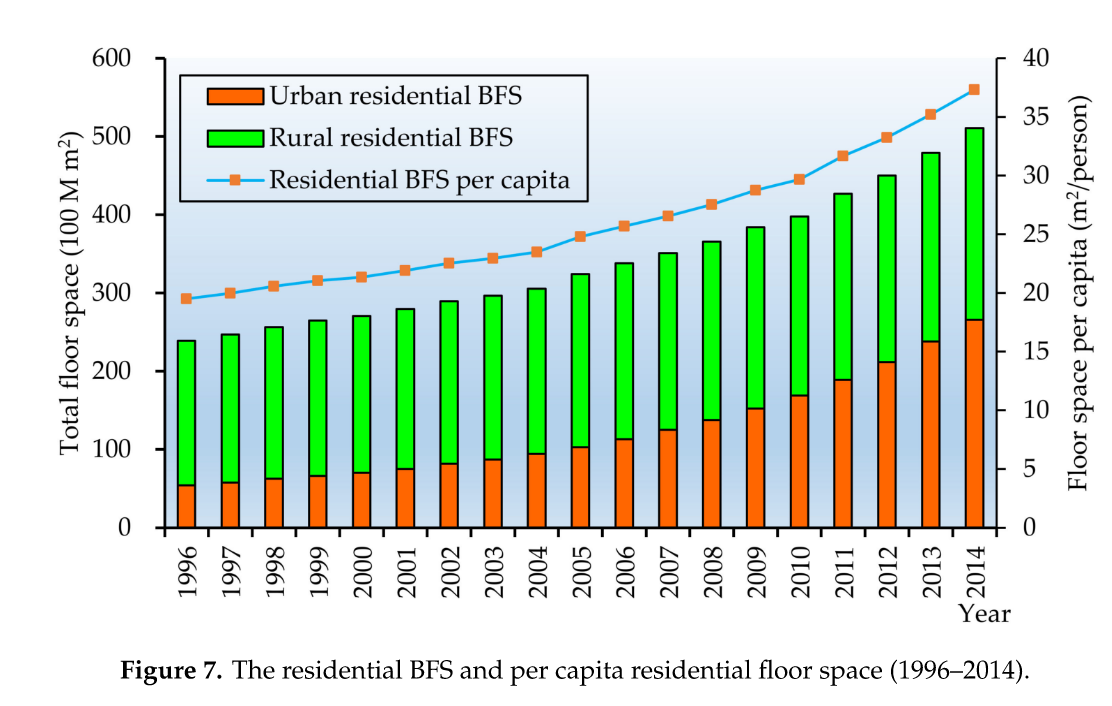
Residential floor space in China over time, via Pan 2020
Beyond China, we see high per capita rates of cement use in the rest of Southeast Asia, as well as the Middle East [8].
One reason you see this volume of concrete use in lower-income, urbanizing countries is that concrete construction is comparatively labor-intensive to produce. The materials for concrete are extremely cheap, and much of its cost in high-cost labor countries (such as the U.S.) is from the labor to produce it — building and setting up the formwork, laying out the reinforcing, placing the embeds, etc. If you’re a country with a lot of low-cost labor, this is a pretty good trade-off.
In addition to the current largest users of concrete, one trend to keep an eye on long-term is India’s concrete use. If India ever proceeds on a path of mass urbanization similar to China (as some folks speculate it will), we could see a massive uptick in global concrete output — India’s urbanization rate of 34% is around where China was in the late 1990s. A shift in India toward a per capita cement consumption more consistent with the rest of Southeast Asia (say around 600 kg/capita) would increase worldwide cement consumption by about 13%, and it does seem as if India’s cement use is trending upward.
By contrast, one thing clear from this data is that the U.S. actually uses an unusually low amount of concrete. Per capita, it uses as little as any other Western country, and far, far less than some — like, surprisingly, Belgium.
So we’ve seen where it gets used in the world. Can we go deeper and look at specifically what concrete is being used for?
This will vary significantly depending on the region and the local construction tradition. In the U.S., we have roughly the following breakdown (via the Portland Cement Association):
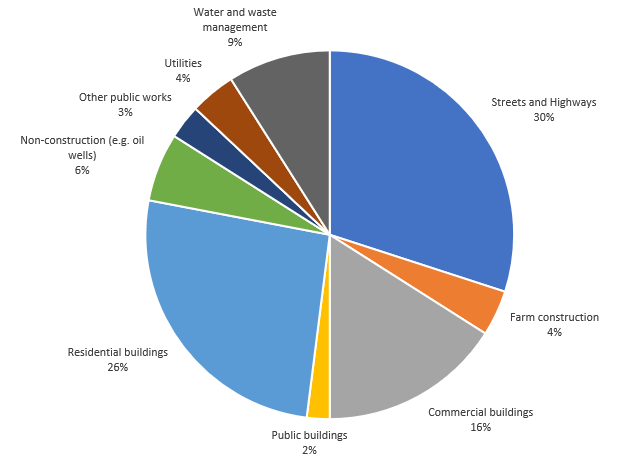
Overall, roughly half of our concrete gets used in buildings — about 26% goes into residential buildings, 2% in public buildings, and 16% into commercial buildings. The other half gets used for infrastructure — streets and highways, water conveyance and treatment tanks, etc. Because most construction in the U.S. is just one- or two-story buildings (mostly wood for residential buildings and steel for commercial ones), concrete in buildings is probably mostly going into foundations, slabs on grade, and concrete over metal deck, though there’s probably a substantial amount going into concrete masonry units as well.
But the U.S. has a somewhat unusual construction tradition, where the vast majority of our residential construction, both single-family homes and multifamily apartments, is built from light-framed wood. In other places, it's much more common to use concrete. For instance, the U.K. uses closer to 80% of its concrete for buildings, with most of that going toward the superstructure, the concrete frame that holds the building up. China, which has urbanized on the back of huge numbers of concrete residential high rises, probably devotes an even larger share of its concrete to residential construction.
Understanding how much concrete the world uses, and where it’s being used, is important if you want to use less of it.
The scale of the industry is particularly important to keep in mind. For instance, you often see enthusiasm for the idea of replacing concrete buildings with mass timber ones. But assuming you could substitute all the world’s concrete for an equal volume of wood [9], you’d need to more than triple the total annual volume of global wood harvested [10], which puts a somewhat different spin on the issue.
Most other materials would have emissions as bad or worse than concrete if they were used on the same scale.
Consider, for instance, railway ties. In the U.S., these are still largely made out of wood, but in many places they have been replaced with concrete ties. And some places are considering changing from concrete ties to plastic composite rail ties instead. It’s hard to know the exact embodied emissions without a lot of specific details about the materials and supply chains used, but can we ballpark how much a plastic tie uses compared to a concrete one?
Per the Inventory of Carbon and Energy database, concrete varies between 150 and 400 kg of embodied CO2 per cubic meter, depending on the properties of the mix, with an “average” value of about 250. Plastics mostly have embodied emissions of about 3-4 kg of CO2 per kg of plastic, or about 3,500 kg per cubic meter (assuming a density of about 1,000 kg per cubic meter). So per unit volume, plastic has somewhere around 10 times the embodied emissions of concrete.
We can also do a more direct comparison. Consider a beam spanning around 20 feet and supporting a vertical load of 21,000 pounds per linear foot. The lightest U.S. standard steel section that will span this distance is a W16x26, which weighs about 236 kg and will have embodied carbon emissions of around 354 kg.
A concrete beam of the same depth, supporting the same load and spanning the same distance, will be 10.5 inches wide by 16 inches deep, with three #10 steel bars running along the bottom. This beam will have about 190 kg of embodied emissions from the concrete, and about another 230 kg of embodied emissions from the steel rebar. This is about 20% more than the steel beam, but in the same ballpark — and over half the “concrete” emissions are actually due to the embedded reinforcing steel.
This is arguably a nonrepresentative example (most concrete, such as in columns or slabs, will have a much lower ratio of steel), but the basic logic holds: Concrete is unusual in its total volume of use, not how emissions-heavy it is as a material. Most material substitutes that aren’t wood, recycled materials, or industrial byproducts that can be had for “free” won’t necessarily be much better when used at the same scale. In some ways, it’s surprising that the carbon emissions from concrete are as low as they are.
Of course, this calculus is likely to change over time — as electricity sources change over to lower carbon ones, you’re likely to see the embodied emissions of materials drop along with it. And since cement releases CO2 as part of the chemical process of producing it, concrete will look increasingly worse compared to other materials over time.
One potential option is to find ways of changing the cement production process to be less carbon-intensive. The easiest option is to just replace manufactured Portland Cement with some other cementitious material. Industrial byproducts such as blast furnace slag, silica fume, and fly ash, often have cementitious properties and don’t have a “carbon penalty” (since they’d be produced regardless.) Materials like these can potentially eliminate large volumes of cement in a concrete mix, and they’re a key part of current low-carbon concrete strategies — even “normal” concrete mixes tend to utilize these to some degree. But the total volume of these materials is limited by the extent of various industrial processes. And for things like fly ash (which is a byproduct from coal plants) and slag (which is a byproduct from CO2-emitting blast furnaces), we can expect production to decline over time.
Another option is to take advantage of the fact that concrete will naturally absorb CO2 over time, a process known as carbonation. Even normal concrete will absorb roughly 30% of the CO2 emitted during the production process over the course of its life. Companies like Carbicrete, Carboncure, Carbonbuilt, and Solida all offer methods of concrete production that allow the concrete to absorb CO₂ during the production process, substantially reducing embodied emissions. Interestingly, these producers mostly claim that their concrete is actually cheaper than conventional concretes, which would obviously be a massive tailwind for the technology’s adoption.
It’s not obvious what the best path forward is for addressing concrete carbon emissions (like with most things, I suspect it’ll end up being a mix of different solutions), but understanding the parameters of the problem is necessary for solving it.
Note: A version of this article originally appeared in the author’s newsletter, Construction Physics, and has been repurposed for Heatmap.
[0] - This figure varies depending on the source. Chatham House provides a frequently cited estimate of 8%. We can also ballpark it — roughly 0.93 pounds of CO₂ gets emitted for each pound of cement produced, around 4.25 billion tons of cement are produced annually, which gets ~3.95 billion tons of CO₂, and total annual CO₂ emissions are in the neighborhood of 46 billion tons, getting us a bit less than 9%.
[1] - Per Circular Ecology, ~70-90% of emissions are from the cement production process, depending on the type of concrete and what the rest of the supply chain looks like.
[2] - This seems to vary depending on where the cement is being made — in Myanmar, for instance, it’s around 46%.
[3] - Another number where the sources often don’t agree with each other, see here, here, and here for estimates on annual cement production.
[4] - Concrete is roughly 10-15% cement by weight, depending on the strength of the mix, what other cementitious materials are being used, etc. An average value of 12.5% yields 34 billion tons, which we’ll knock down to account for other uses of cement (masonry mortar, grout, gypsum overlay, etc.) This roughly tracks with estimates from PCA (“4 tons of concrete produced each year for every person on Earth”), and from the now-defunct Cement Sustainability Initiative, which estimated 25 billion tons of concrete against 3.125 billion tons of cement in 2015.
[5] - See here, here, and here for an estimate of total civilization mass flow. This doesn’t (I believe) include waste byproducts, which can be substantial — for instance, it doesn’t include the ~46 billion tons of CO₂ emitted each year, or the 16 billion tons of mine tailings, or the 140 billion tons of agriculture byproducts (though this last number is difficult to verify and seems high).
[6] - We see something similar with cement as we do with other bulky, low-value materials, in that it's made in lots of distributed manufacturing facilities relatively close to where it’s used. See here for a map of cement plants in the U.S. around 2001, for instance.
[7] - For China’s total floor space, see here (most sources seem to agree with these numbers). For U.S. floor space, see my Every Building In America article. For per-capita living space in Europe, see here.
[8] - The often high rates of cement use by middle-income countries have led some folks to develop a U-shaped cement consumption theory of industrial development — that countries start out using a small amount of cement, use more as they get richer and build up their physical infrastructure, and then eventually transition to using lower volumes of cement again. The Globbulk paper spends considerable time debunking this.
[9] - It’s not actually obvious to me what the substitution ratio would be. In strength-governed cases, you’d need proportionally more timber than concrete, but in other cases (such as replacing concrete walls with light-framed stud walls), you’d probably use less. Obviously, you can’t substitute all concrete for wood, but you can probably switch out more than you think — there’s no reason you couldn’t use wood foundations instead of concrete ones in many cases, for instance.
[10] - 30 billion tons of concrete is roughly 12.5 billion cubic meters, and total annual wood products produced is currently around 5.5 billion cubic meters.
Log in
To continue reading, log in to your account.
Create a Free Account
To unlock more free articles, please create a free account.
On China’s rare earths, Bill Gates’ nuclear dream, and Texas renewables
Current conditions: Hurricane Melissa exploded in intensity over the warm Caribbean waters and has now strengthened into a major storm, potentially slamming into Cuba, the Dominican Republic, Haiti, and Jamaica as a Category 5 in the coming days • The Northeast is bracing for a potential nor’easter, which will be followed by a plunge in temperatures of as much as 15 degrees Fahrenheit lower than average • The northern Australian town of Julia Creek saw temperatures soar as high as 106 degrees.
Exxon Mobil filed a lawsuit against California late Friday on the grounds that two landmark new climate laws violate the oil giant’s free speech rights, The New York Times reported. The two laws would require thousands of large companies doing business in the state to calculate and report the greenhouse gas pollution created by the use of their products, so-called Scope 3 emissions. “The statutes compel Exxon Mobil to trumpet California’s preferred message even though Exxon Mobil believes the speech is misleading and misguided,” Exxon complained through its lawyers. California Governor Gavin Newsom’s office said the statutes “have already been upheld in court and we continue to have confidence in them.” He condemned the lawsuit, calling it “truly shocking that one of the biggest polluters on the planet would be opposed to transparency.”
China will delay introducing export controls on rare earths, an unnamed U.S. official told the Financial Times following two days of talks in Malaysia. For years, Beijing has been ratcheting up trade restrictions on the global supply of metals its industry dominates. But this month, China slapped the harshest controls yet on rare earths. In response, stocks in rare earth mining and refining companies soared. Despite what Heatmap’s Matthew Zeitlin called the “paradox of Trump’s critical mineral crusade” to mine even as he reduced demand from electric vehicle factories, “everybody wants to invest in critical minerals startups,” Heatmap’s Katie Brigham wrote. That — as frequent readers of this newsletter will recall — includes the federal government, which under the Trump administration has been taking equity stakes in major projects as part of deals for federal funding.
The Nuclear Regulatory Commission rewarded Bill Gates’ next-generation reactor company, TerraPower, with its final environment impact statement last week. The next step in the construction permit process is a final safety evaluation that the company expects to receive by the end of this year. If everything goes according to plan, TerraPower could end up winning the race to build the nation’s first commercial reactor to use a coolant other than water, and do so at a former coal-fired plant in the country’s top coal-producing state. “The Natrium plant in Wyoming, Kemmerer Unit 1, is now the first advanced reactor technology to successfully complete an environmental impact statement for the NRC, bringing us another step closer to delivering America’s next nuclear power plant,” said TerraPower president and CEO Chris Levesque.
A judge gave New York Governor Kathy Hochul’s administration until February 6 to issue rules for its long-delayed cap-and-invest program, the Albany Times-Union reported. The government was supposed to issue the guidelines that would launch the program as early as 2024, but continuously pushed back the release. “Early outlines of New York’s cap and invest program indicate that regulators were considering a relatively low price ceiling on pollution, making it easier for companies to buy their way out of compliance with the cap,” Heatmap’s Emily Pontecorvo wrote in January.
 
The Texas data center boom is being powered primarily with new wind, solar, and batteries, according to new analysis by the Energy Information Administration. Since 2021, electricity demand on the independent statewide grid operated by the Electric Reliability Council of Texas has soared. Over the past year, wind, solar, and batteries have been supplying that rising demand. Utility-scale solar generated 45 terawatt-hours of electricity in the first nine months of 2025. That’s 50% more than the same period in 2024 and nearly four times more than the same period in 2021. Wind generation, meanwhile, totaled 87 terawatt-hours for the first nine months of this year, up 4% from last year and 36% since 2021. “Together,” the analysis stated, “wind and solar generation met 36% of ERCOT’s electricity demand in the first nine months of 2025.”
The question isn’t whether the flames will come — it’s when, and what it will take to recover.
In the two decades following the turn of the millennium, wildfires came within three miles of an estimated 21.8 million Americans’ homes. That number — which has no doubt grown substantially in the five years since — represents about 6% of the nation’s population, including the survivors of some of the deadliest and most destructive fires in the country’s history. But it also includes millions of stories that never made headlines.
For every Paradise, California, and Lahaina, Hawaii, there were also dozens of uneventful evacuations, in which regular people attempted to navigate the confusing jargon of government notices and warnings. Others lost their homes in fires that were too insignificant to meet the thresholds for federal aid. And there are countless others who have decided, after too many close calls, to move somewhere else.
By any metric, costly, catastrophic, and increasingly urban wildfires are on the rise. Nearly a third of the U.S. population, however, lives in a county with a high or very high risk of wildfire, including over 60% of the counties in the West. But the shape of the recovery from those disasters in the weeks and months that follow is often that of a maze, featuring heart-rending decisions and forced hands. Understanding wildfire recovery is critical, though, for when the next disaster follows — which is why we’ve set out to explore the topic in depth.
The most immediate concerns for many in the weeks following a wildfire are financial. Homeowners are still required to pay the mortgage on homes that are nothing more than piles of ash — one study by the Federal Reserve Bank of Philadelphia found that 90-day delinquencies rose 4% and prepayments rose 16% on properties that were damaged by wildfires. Because properties destroyed in fires often receive insurance settlements that are lower than the cost to fully replace their home, “households face strong incentives to apply insurance funds toward the mortgage balance instead of rebuilding, and the observed increase in prepayment represents a symptom of broader frictions in insurance markets that leave households with large financial losses in the aftermath of a natural disaster,” the researchers explain.
Indeed, many people who believed they had adequate insurance only discover after a fire that their coverage limits are lower than 75% of their home’s actual replacement costs, putting them in the category of the underinsured. Homeowners still grappling with the loss of their residence and possessions are also left to navigate reams of required paperwork to get their money, a project one fire victim likened to having a “part-time job.” It’s not uncommon for fire survivors to wait months or even years for payouts, or to find that necessary steps to rebuilding, such as asbestos testing and dead tree removals, aren’t covered. Just last week, California Governor Gavin Newsom signed a new law requiring insurers to pay at least 60% of a homeowner’s personal property coverage on a total loss without a detailed inventory, up to $350,000. The original proposal called for a 100% payout, but faced intense insurance industry blowback .
Even if your home doesn’t burn to the ground, you might be affected by the aftermath of a nearby fire. In California, a fifth of homes in the highest-risk wildfire areas have lost insurance coverage since 2019, while premiums in those same regions have increased by 42%. Insurers’ jitters have overflowedspilled over into other Western states like Washington, where there are fewer at-risk properties than in California — 16% compared to 41% — but premiums have similarly doubled in some cases due to the perceived hazardrisks.
Some experts argue that people should be priced out of the wildland-urban interface and that managed retreat will help prevent future tragedies. But as I report in my story on fire victims who’ve decided not to rebuild, that’s easier said than done. There are only three states where insured homeowners have the legal right to replace a wildfire-destroyed home by buying a new property instead of rebuilding, meaning many survivors end up shackled to a property that is likely to burn again.
The financial maze, of course, is only one aspect of recovery — the physical and mental health repercussions can also reverberate for years. A study that followed survivors of Australia’s Black Saturday bush fires in 2009, which killed over 170 people, found that five years after the disaster, a fifth of survivors still suffered from “serious mental health challenges” like post-traumatic stress disorder. In Lahaina, two years after the fire, nearly half of the children aged 10 to 17 who survived are suspected of coping with PTSD.
Federal firefighting practices continue to focus on containing fires as quickly as possible, to the detriment of less showy but possibly more effective solutions such as prescribed burns and limits on development in fire-prone areas. Some of this is due to the long history of fire suppression in the West, but it persists due to ongoing political and public pressure. Still, you can find small and promising steps forward for forest management in places like Paradise, where the recreation and park district director has scraped together funds to begin to build a buffer between an ecosystem that is meant to burn and survivors of one of the worst fires in California’s history.
In the four pieces that follow, I’ve attempted to explore the challenges of wildfire recovery in the weeks and months after the disaster itself. In doing so, I’ve spoken to firefighters, victims, researchers, and many others to learn more about what can be done to make future recoveries easier and more effective.
The bottom line, though, is that there is no way to fully prevent wildfires. We have to learn to live alongside them, and that means recovering smarter, too. It’s not the kind of glamorous work that attracts TV cameras and headlines; often, the real work of recovery occurs in the many months after the fire is extinguished. But it also might just make the difference.
Wildfire evacuation notices are notoriously confusing, and the stakes are life or death. But how to make them better is far from obvious.
How many different ways are there to say “go”? In the emergency management world, it can seem at times like there are dozens.
Does a “level 2” alert during a wildfire, for example, mean it’s time to get out? How about a “level II” alert? Most people understand that an “evacuation order” means “you better leave now,” but how is an “evacuation warning” any different? And does a text warning that “these zones should EVACUATE NOW: SIS-5111, SIS-5108, SIS-5117…” even apply to you?
As someone who covers wildfires, I’ve been baffled not only by how difficult evacuation notices can be to parse, but also by the extent to which they vary in form and content across the United States. There is no centralized place to look up evacuation information, and even trying to follow how a single fire develops can require hopping among jargon-filled fire management websites, regional Facebook pages, and emergency department X accounts — with some anxious looking-out-the-window-at-the-approaching-pillar-of-smoke mixed in.
Google and Apple Maps don’t incorporate evacuation zone data. Third-party emergency alert programs have low subscriber rates, and official government-issued Wireless Emergency Alerts, or WEAs — messages that trigger a loud tone and vibration to all enabled phones in a specific geographic region — are often delayed, faulty, or contain bad information, none of which is ideal in a scenario where people are making life-or-death decisions. The difficulty in accessing reliable information during fast-moving disasters like wildfires is especially aggravating when you consider that nearly everyone in America owns a smartphone, i.e. a portal to all the information in the world.
So why is it still so hard to learn when and where specific evacuation notices are in place, or if they even apply to you? The answer comes down to the decentralized nature of emergency management in the United States.
A downed power line sparks a fire on a day with a Red Flag Warning. A family driving nearby notices the column of smoke and calls to report it to 911. The first responders on the scene realize that the winds are fanning the flames toward a neighborhood, and the sheriff decides to issue a wildfire warning, communicating to the residents that they should be ready to leave at a moment’s notice. She radios her office — which is now fielding multiple calls asking for information about the smoke column — and asks for the one person in the office that day with training on the alert system to compose the message.
Scenarios like these are all too common. “The people who are put in the position of issuing the messages are doing 20 other things at the same time,” Jeannette Sutton, a researcher at the University at Albany’s Emergency and Risk Communication Message Testing Lab, told me. “They might have limited training and may not have had the opportunity to think about what the messages might contain — and then they’re told by an incident commander, Send this, and they’re like, Oh my God, what do I do?”
The primary way of issuing wildfire alerts is through WEAs, with 78,000 messages sent since 2012. Although partnerships between local emergency management officials, the Federal Emergency Management Agency, the Federal Communications Commission, and cellular and internet providers facilitate the technology, it’s local departments that determine the actual content of the message. Messaging limits force some departments to condense the details of complicated and evolving fire events into 90 characters or fewer. Typos, confusing wording, and jargon inevitably abound.
Emergency management teams often prefer to err on the side of sending too few messages rather than too many for fear of inducing information overload. “We’re so attached to our devices, whether it’s Instagram or Facebook or text messages, that it’s hard to separate the wheat from the chaff, so to speak — to make sure that we are getting the right information out there,” John Rabin, the vice president of disaster management at the consulting firm ICF International and a former assistant administrator at the Federal Emergency Management Agency, told me. “One of the challenges for local and state governments is how to bring [pertinent information] up and out, so that when they send those really important notifications for evacuations, they really resonate.”
But while writing an emergency alert is a bit of an art, active prose alone doesn’t ensure an effective evacuation message.
California’s Cal Fire has found success with the “Ready, Set, Go” program, designed by the International Association of Fire Chiefs, which uses an intuitive traffic light framework — “ready” is the prep work of putting together a go-bag and waiting for more news if a fire is in the vicinity, escalating to the “go” of the actual evacuation order. Parts of Washington and Oregon use similar three-tiered systems of evacuation “levels” ranging from 1 to 3. Other places, like Montana, rely on two-step “evacuation warnings” and “evacuation orders.”
Watch Duty, a website and app that surged in popularity during the Los Angeles fires earlier this year, doesn’t worry about oversharing. Most information on Watch Duty comes from volunteers, who monitor radio scanners, check wildfire cameras, and review official law enforcement announcements, then funnel the information to the organization’s small staff, who vet it before posting. Though WatchDuty volunteers and staff — many of whom are former emergency managers or fire personnel themselves — actively review and curate the information on the app, the organization still publishes far more frequent and iterative updates than most people are used to seeing and interpreting. As a result, some users and emergency managers have criticized Watch Duty for having too much information available, as a result.
The fact that Watch Duty was downloaded more than 2 million times during the L.A. fires, though, would seem to testify to the fact that people really are hungry for information in one easy-to-locate place. The app is now available in 22 states, with more than 250 volunteers working around the clock to keep wildfire information on the app up to date. John Clarke Mills, the app’s CEO and co-founder, has said he created the app out of “spite” over the fact that the government doesn’t have a better system in place for keeping people informed on wildfires.
“I’ve not known too many situations where not having information makes it better,” Katlyn Cummings, the community manager at Watch Duty, told me. But while the app’s philosophy is “rooted in transparency and trust with our users,” Cummings stressed to me that the app’s volunteers only use official and public sources of information for their updates and never include hearsay, separating it from other crowd-sourced community apps that have proved to be less than reliable.
Still, it takes an army of a dozen full-time staff and over 200 part-time volunteers, plus an obsessively orchestrated Slack channel to centralize the wildfire and evacuation updates — which might suggest why a more official version doesn’t exist yet, either from the government or a major tech company. Google Maps currently uses AI to visualize the boundaries of wildfires, but stops short of showing users the borders of local evacuation zones (though it will route you around known road closures). A spokesperson for Google also pointed me toward a feature in Maps that shares news articles, information from local authorities, and emergency numbers when users are in “the immediate vicinity” of an actively unfolding natural disaster — a kind of do-it-yourself Watch Duty. The company declined to comment on the record about why Maps specifically excludes evacuation zones. Apple did not respond to a request for comment.
There is, of course, a major caveat to the usefulness of Watch Duty.
Users of the app tend to be a self-selecting group of hyper-plugged-in digital natives who are savvy enough to download it or otherwise know to visit the website during an unfolding emergency. As Rabin, the former FEMA official, pointed out, Watch Duty users aren’t the population that first responders are most concerned about — they’re like “Boy Scouts,” he said, because they’re “always prepared.” They’re the ones who already know what’s going on. “It’s reaching the folks that aren’t paying attention that is the big challenge,” he told me.
The older adult population is the most vulnerable in cases of wildfire. Death tolls often skew disproportionately toward the elderly; of the 30 people who died in the Los Angeles fires in January, for example, all but two were over 60 or disabled, with the average age of the deceased 77, the San Francisco Chronicle reported. Part of that is because adults 65 and older are more likely to have physical impairments that make quick or unplanned evacuations challenging. Social and technological isolation are also factors — yes, almost everyone in America has a smartphone, but that includes just 80% of those 65 and older, and only 26% of the older adult population feels “very confident” using computers or smartphones. According to an extensive 2024 report on how extreme weather impacts older adults by CNA, an independent, nonprofit research organization, “Evacuation information, including orders, is not uniformly communicated in ways and via media that are accessible to older adults or those with access and functional needs.”
Sutton, the emergency warning researcher, also cautioned that more information isn’t always better. Similar to the way scary medical test results might appear in a health portal before a doctor has a chance to review them with you (and calm you down), wildfire information shared without context or interpretation from emergency management officials means the public is “making assumptions based upon what they see on Watch Duty without actually having those official messages coming from the public officials who are responsible for issuing those messages,” she said. One role of emergency managers is to translate the raw, on-the-ground information into actionable guidance. Absent that filter, panic is probable, which could lead to uncontrollable evacuation traffic or exacerbate alert fatigue. Alternatively, people might choose to opt out of future alerts or stop checking for updates.
Sutton, though she’s a strong advocate of creating standardized language for emergency alerts — “It would be wonderful if we had consistent language that was agreed upon” between departments, she told me — was ultimately skeptical of centralizing the emergency alert system under a large agency like FEMA. “The movement of wildfires is so fast, and it requires knowledge of the local communities and the local terrain as well as meteorological knowledge,” she said. “Alerts and warnings really should be local.”
The greater emphasis, Sutton stressed, should be on providing emergency managers with the training they need to communicate quickly, concisely, and effectively with the tools they already have.
The high wire act of emergency communications, though, is that while clear and regionally informed messages are critical during life-or-death situations, it also falls on residents in fire-risk areas to be ready to receive them. California first adopted the “Ready, Set, Go” framework in 2009, and it has spent an undisclosed amount of money over the years on a sustained messaging blitz to the public. (Cal Fire’s “land use planning and public education budget is estimated at $16 million, and funds things like the updated ad spots it released as recently as this August.) Still, there is evidence that even that has not been enough — and Cal Fire is the best-resourced firefighting agency in the country, setting the gold standard for an evacuation messaging campaign.
Drills and test messages are one way to bring residents up to speed, but participation is typically very low. Many communities and residents living in wildfire-risk areas continue to treat the threat with low urgency — something to get around to one day. But whether they’re coming from your local emergency management department or the White House itself, emergency notices are only as effective as the public is willing and able to heed them.