Trina Messer knew the weather in Dallas-Forth Worth had been unusually warm this year, but she hadn’t anticipated needing her clay-colored yarn in February. “Today we are expecting a high in the 90s!!!,” she marveled in a Facebook update last week, adding regretfully, “I was hoping for more blues, but it is what it is.”
Messer, a retired educator of 30 years, started crocheting in 2022, the natural evolution of a knitting habit she’d picked up while bored during the pandemic. So far, she has made several scarves and hats, a big cardigan “almost like a coat,” and even a couple of throw blankets. Then, in January, she began work on her biggest project yet: a temperature blanket.
Temperature blankets aren’t always blankets — they can be scarves, shawls, and even crocheted snakes. The basic premise, though, is the same: Over the course of a year, knitters, crocheters, and embroiderers add a new row, stitch, or square to their project every day, with the color of yarn corresponding to the temperature of the location where they live. In recent years, this community has grown massive, in essence creating a de facto visual record of climate change for thousands of locations around the world. “From December 1 until today, I’ve had over 26,000 people join,” Sarah Moerdyk, the creator and moderator of Facebook’s largest temperature blanket group, told me in February. For most of its existence, beginning in 2017, the group wasn’t “super active,” hovering around a few hundred members. “In a matter of three months, it’s really blown up.”
Messer chose to break her earth-toned palette into 10-degree intervals, ranging from a white yarn that represents temperatures below 19 degrees Fahrenheit to “chili red” for days over 110. She even has a special yarn, “silver sparkle,” to log days with snowfall. Thankfully, she’d already purchased the clay-colored yarn she’d designated for temperatures between 90 and 99 degrees, even though she hadn’t expected to need it until late March or April.
According to the National Oceanic and Atmospheric Administration, the contiguous United States just concluded its warmest meteorological winter in recorded history. Across the country, temperatures were 5.4 degrees above average; in some states, like Wisconsin, it was nearly 10 degrees above what it should have been for the period between December and February. “This is not normal,” Messer told me a couple weeks ago, when her phone showed it was 91 degrees near Dallas. “Don’t think it’s like this all the time.”
Despite temperature blankets’ resemblance to climatologist Ed Hawkins’ famous warming stripes, the concept predates his 2018 graphics. Perhaps more surprisingly, it wasn’t initially conceived as a commentary on climate change. As far as I — and others — have been able to gather, Kristen Cooper, a craftsperson and beekeeper living in northern British Columbia, was the first to come up with the concept that evolved into the modern temperature blanket challenge when she described a similar scarf pattern in a 2013 blog post. “You record the day’s highest temperature by knitting one row in the color designated for each temperature,” she wrote. By the end of the year, “you will have a visual, colorful graph of the temperatures of your area.”
Cooper told me she, in turn, had been inspired by knitter and author Lea Redmond’s “sky scarf,” a project from 2008 (and later, a book) that involved knitting a row a day in a color that “best captures the essence of the sky out your window.” Redmond was slightly skeptical of the idea that she could be the temperature blanket’s progenitor. Her project tried to capture “the embodied experience of looking at this beauty of the sky every day,” she told me. Temperature projects, by contrast, rely on numbers that people retrieve from a thermometer in their kitchen — or, “I’m guessing, a lot of people just check the internet.”
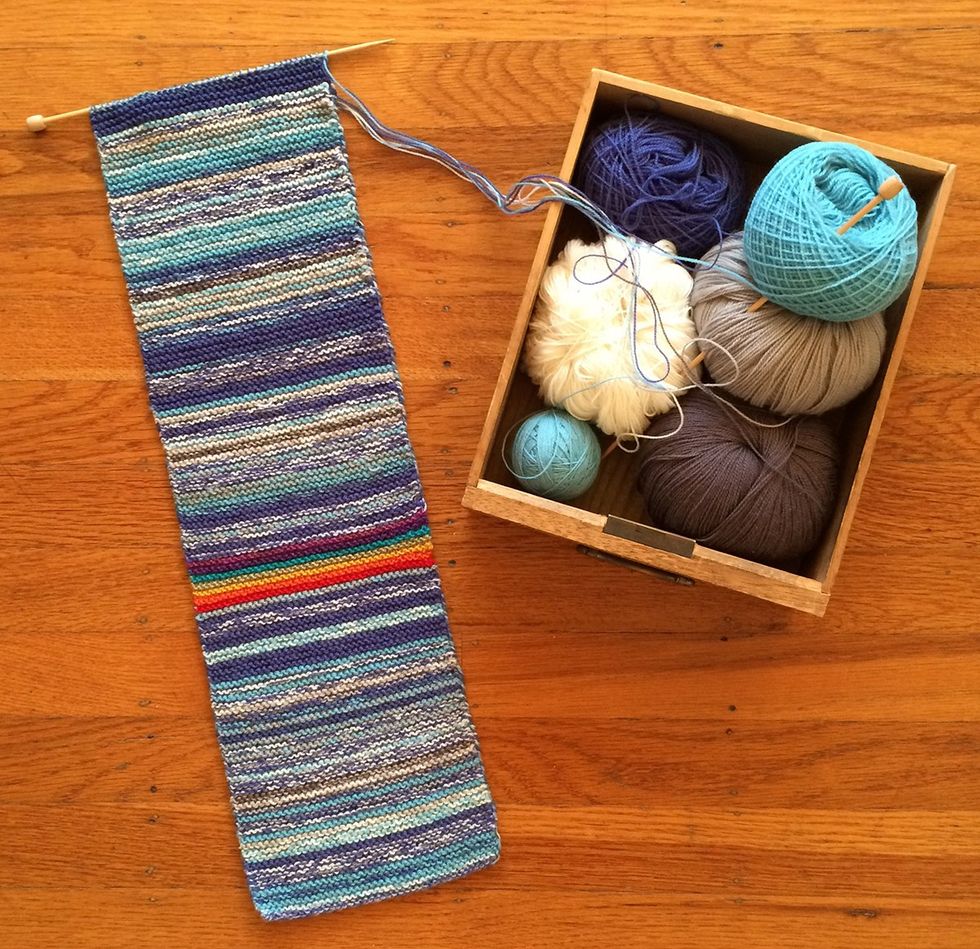
 Lea Redmond’s “sky scarf,” depicting the colors of her local sky, photographed while in progress. The rainbow represents not a temperature variation, but a literal rainbow Redmond spotted in the sky that day.Courtesy of Lea Redmond
Internet data doesn’t have the immediacy of events unfolding in real-time, outside your window. But representing temperature data at all requires a level of emotional remove that Redmond, personally, was a little wary of: For example, when wildfires turned day to night in California in 2020, “temperature-wise, that would not have shown up in a temperature scarf, but in a sky scarf, that stripe would have looked like shit.”
Cooper, for her part, never finished the first temperature scarf because she realized that if she missed a day, she couldn’t accurately make it up — her rural town didn’t have its own weather station — which would defeat the whole point of the project. But while she eventually moved on, swept up by life with a new baby, the knitting world took the concept and ran with it. “I hadn’t really been following along, but every now and then, a completely random post by strangers on Facebook or Instagram will pop up showing a temperature blanket,” Cooper told me. “And I’m always so amazed at how far the concept has traveled.”
Only recently have artists started using conceptual knitting and crocheting projects as explicit commentaries on climate change. In 2017, after the inauguration of President Trump, yarn shop owner Emily McNeil and data scientist Asy Connelly launched the Tempestry Project — which uses standardized colors and ranges to create historic temperature records — half as a joke and half out of real anxiety over the possibility of climate information disappearing from government websites. “We weren’t really thinking about temperature blankets,” McNeil told me. “I guess I knew that they existed, but it wasn’t really on my radar when we started it.”
 The Chicago Tempestry Collection, created by participants from all over the country. Emily McNeil’s Paleo New Normal, above, shows the annual deviation from average temperature from 1CE (on the left) to 2021CE (on the right). The darker the blue, the colder than average the year and the darker the red, the warmer than average the year.Courtesy of The Tempestry Project. Photographed by the museum.
Admittedly, sifting through all that climate data can take an emotional toll during the hours or days it takes to complete a tapestry. In addition to tapestries representing individual years, which rely on historical data rather than real-time observations, the Tempestry Project also facilitates multi-year “New Normal” tapestries that are directly inspired by Hawkins’ warming stripes. “The first one that I knit had me in tears as the colder colors just fade out, and you are never going to get those again,” McNeil said. (When I asked how they deal with the feelings brought up by the project, McNeil and Connelly told me dryly, “A lot of wine.”)
Temperature blanket knitters and crocheters can similarly feel alarmed by what’s unfolding in their hands. Moerdyk told me the warm weather in the northern hemisphere has been a big topic in the Facebook group, with some people having to quick-order summer colors or make special trips to the store to accommodate the winter heat in their projects. Perversely, the weirdness becomes kind of thrilling. “It’s fun to hear people say, ‘My colors are going nuts right now,’” Moerdyk said. Especially this early in the year, “to put all of a sudden this really warm temperature color in — it’s memorable. You’ll look back and say, ‘Oh my gosh, remember that time in February we had a 70-degree day? That was crazy.’”
The result is that temperature blankets become an accessible way of discussing climate change, without any of the political baggage. Moerdyk originally started the Facebook group for her friends but has since recorded participants from 1,114 different locations, including every state and over a dozen countries. She said the community has remained surprisingly civil despite all that diversity — some of it surely ideological. But temperature blankets are “not really a controversial topic,” Moerdyk said. “No matter what you believe in, temperature changes.”
 Moerdyk, based in Michigan, shows off her finished 2017 temperature blanket.Courtesy of Sarah Moerdyk
For the thousands of hobbyists who’ve taken on temperature blanket projects, the craft becomes a way to witness the immediate changes in their environment that aren’t necessarily wholly negative. “If you’re looking at temperature blankets as a climate marker, that can get heavy,” Heather Walpole, the owner of Ewe Ewe Yarns, which sells temperature blanket starter bundles, told me. “But we’re still living our lives and we have a desire to create.”
Redmond, the sky scarf creator, finds this kind of creative intentionality to be the key. “It’s not like I invented stripes having meaning,” she joked. “But I do think most stripes on most garments in most stores in the United States today are meaningless. That just seems like such a missed opportunity.” It’s not that having a throw blanket or a scarf with weather-coordinated stripes will change the world. But displaying or wearing a beautiful object inspires others to ask questions: Where did you get that? Did you make it yourself? “They’re story sparks,” Redmond said. “They’re excuses to tell your story.”
This already weirdly warm year is still in its relatively chilly opening chapters, but the savviest knitters are already hurrying to stock up on yarns for June and July. As Messer, the Texas-based knitter, told me, “If this summer is anything like last summer,” then her blanket will have “a whole lot of burnt orange and red.”


 Lea Redmond’s “sky scarf,” depicting the colors of her local sky, photographed while in progress. The rainbow represents not a temperature variation, but a literal rainbow Redmond spotted in the sky that day.Courtesy of Lea Redmond
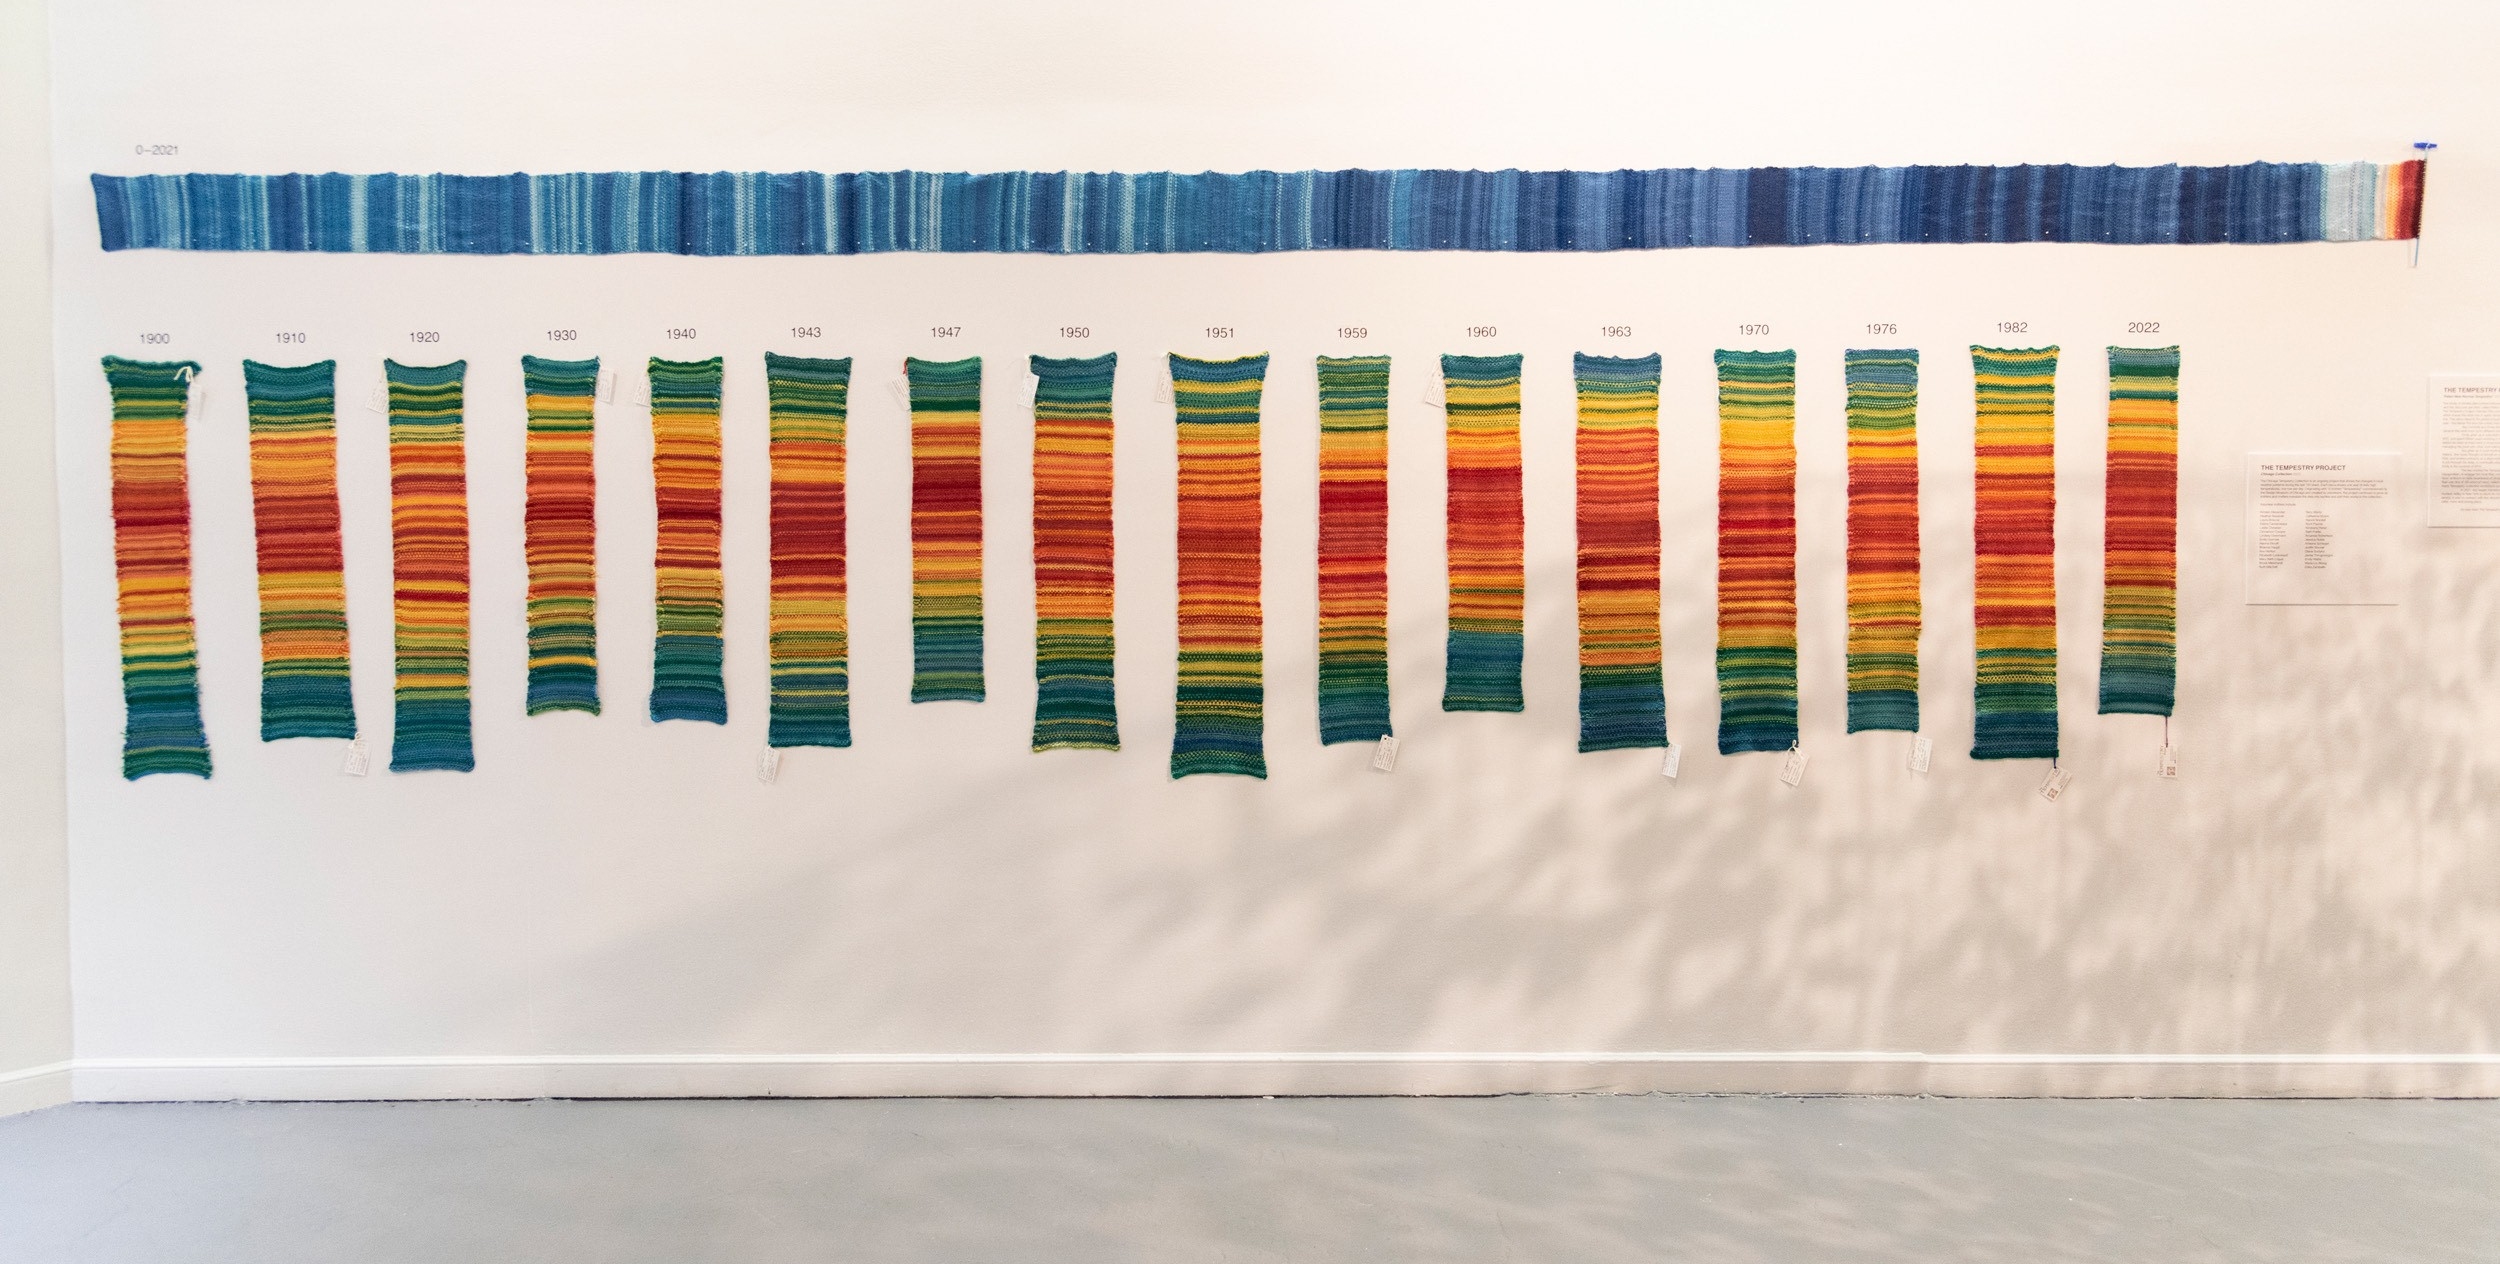 The Chicago Tempestry Collection, created by participants from all over the country. Emily McNeil’s Paleo New Normal, above, shows the annual deviation from average temperature from 1CE (on the left) to 2021CE (on the right). The darker the blue, the colder than average the year and the darker the red, the warmer than average the year.Courtesy of The Tempestry Project. Photographed by the museum.
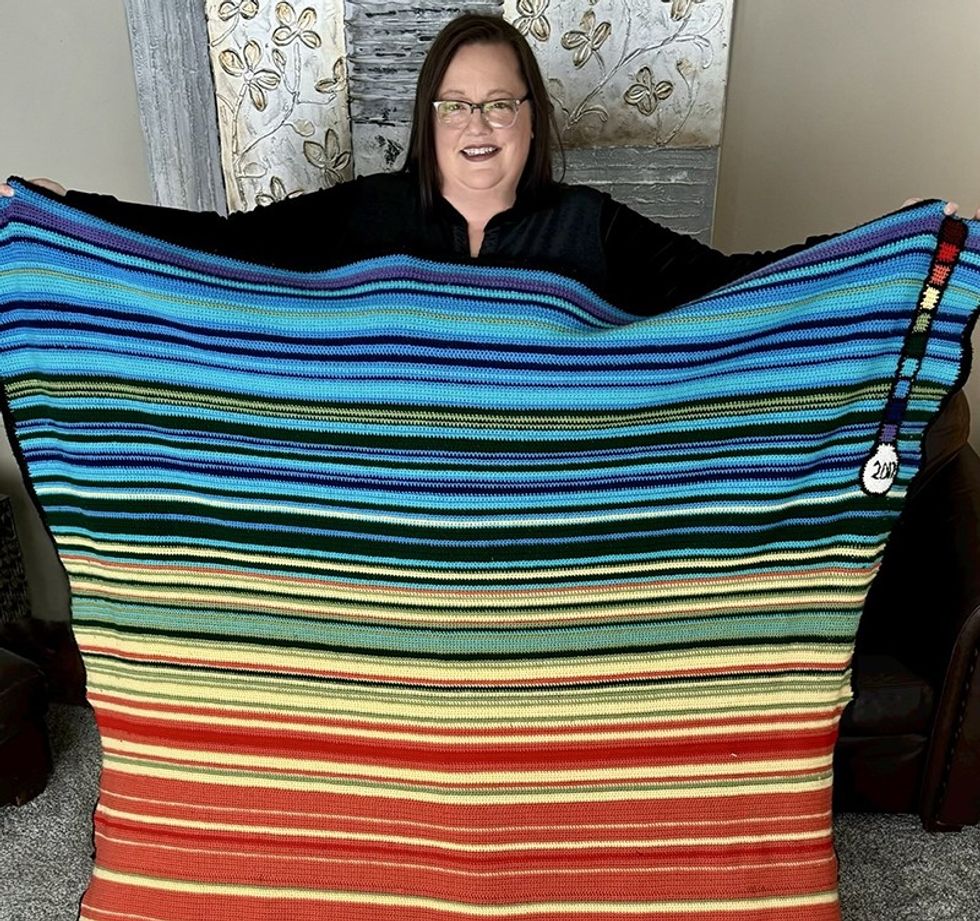 Moerdyk, based in Michigan, shows off her finished 2017 temperature blanket.Courtesy of Sarah Moerdyk


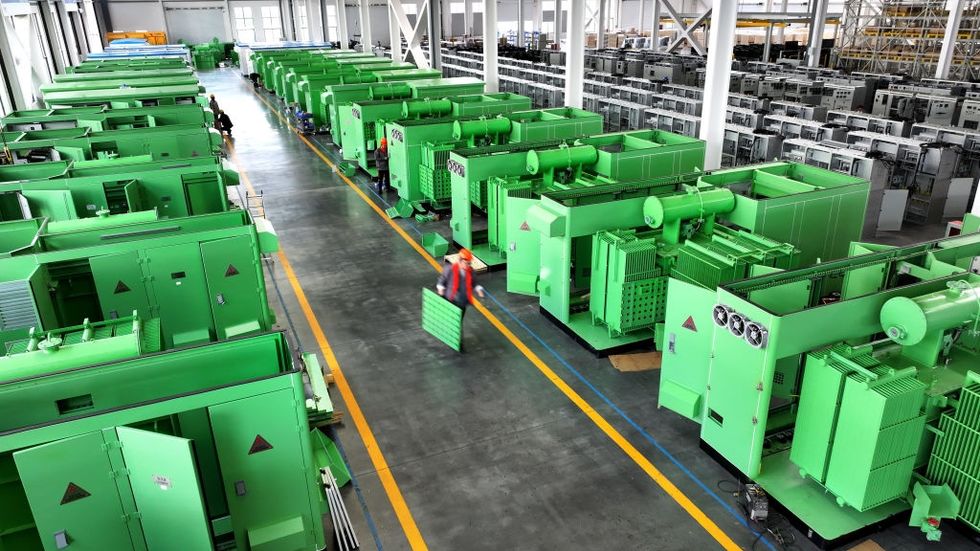 A transformer factory in Jiangsu Province, China. Costfoto/NurPhoto via Getty Images