You’re out of free articles.
Log in
To continue reading, log in to your account.
Create a Free Account
To unlock more free articles, please create a free account.
Sign In or Create an Account.
By continuing, you agree to the Terms of Service and acknowledge our Privacy Policy
Welcome to Heatmap
Thank you for registering with Heatmap. Climate change is one of the greatest challenges of our lives, a force reshaping our economy, our politics, and our culture. We hope to be your trusted, friendly, and insightful guide to that transformation. Please enjoy your free articles. You can check your profile here .
subscribe to get Unlimited access
Offer for a Heatmap News Unlimited Access subscription; please note that your subscription will renew automatically unless you cancel prior to renewal. Cancellation takes effect at the end of your current billing period. We will let you know in advance of any price changes. Taxes may apply. Offer terms are subject to change.
Subscribe to get unlimited Access
Hey, you are out of free articles but you are only a few clicks away from full access. Subscribe below and take advantage of our introductory offer.
subscribe to get Unlimited access
Offer for a Heatmap News Unlimited Access subscription; please note that your subscription will renew automatically unless you cancel prior to renewal. Cancellation takes effect at the end of your current billing period. We will let you know in advance of any price changes. Taxes may apply. Offer terms are subject to change.
Create Your Account
Please Enter Your Password
Forgot your password?
Please enter the email address you use for your account so we can send you a link to reset your password:

This transcript has been automatically generated.
Subscribe to “Shift Key” and find this episode on Apple Podcasts, Spotify, Amazon, or wherever you get your podcasts.
You can also add the show’s RSS feed to your podcast app to follow us directly.
Robinson Meyer:
[1:25] Hi, I’m Robinson Meyer, the founding executive editor of Heatmap News. It is Friday, February 20. This morning, the Supreme Court threw out President Trump’s most aggressive tariffs, ruling that the International Emergency Economic Powers Act of 1977, usually called IEEPA, does not allow the president to impose broad, indiscriminate tariffs on other countries. Had Congress intended to convey the distinct and extraordinary power to impose tariffs, it would have done so expressly, Chief Justice John Roberts wrote. It was a bit of a stitched together decision. Clarence Thomas, Samuel Alito, and Brett Kavanaugh dissented, while Neil Gorsuch, Amy Coney Barrett, and the chief justice ruled with the liberals, although the liberals only concurred with some of the decision. But it takes away a major tool of economic and diplomatic policy making for President Trump.
Robinson Meyer:
[2:12] There were really two sets of tariffs affected by this decision. One was a set of so-called reciprocal tariffs imposed on most countries in the world and set between 10% and 50%. And the second were what Trump called the fentanyl tariffs on China, Mexico, and Canada. Now, the president basically immediately followed up this ruling by saying he would impose a 10% universal tariff on all countries. We’re still trying to understand how exactly he would do that and what it would mean, and we’ll talk about it on the show. But we wanted to have a conversation on an emergency basis here on an emergency shift key episode about what this means for clean energy and what this could also mean for Trump’s industrial policy, such as it is going forward.
Robinson Meyer:
[2:53] Joining us today is Jonas Nahm. He’s an associate professor at the John Hopkins School of Advanced International Studies in Washington, D.C., and he was recently senior economist for industrial strategy at the White House Council of Economic Advisors. He studies industrial policy, supply chains and trade, and he’s the author of Collaborative Advantage: Forging Green Industries in the New Global Economy. Jonas, welcome to Shift Key.
Jonas Nahm:
[3:18] Thank you for having me. I’m finally on.
Robinson Meyer:
[3:20] You’re finally here. We finally got you. So I think let’s just start here. What do you make of the ruling today and then the president’s kind of successive 10% tariff announcement?
Jonas Nahm:
[3:33] I don’t think this was surprising, right? We had, during the hearings, kind of gotten this impression that the judges were somewhat skeptical, at least, of the ability of the president to use IEEPA to justify these tariffs. And so I think the surprise was really that it took so long. There were lots of rumors floating around for the past couple of months that this would come out any time. And so it finally came, but it sort of came in the form that everyone expected. And the conclusion today was that this is not a tariff statute and that there are other authorities for the president to use to do these things, but this isn’t one of them.
Robinson Meyer:
[4:09] I feel like the most interesting thing, I kind of hinted at this in the intro, was that Brett Kavanaugh, ruled, first of all, that the tariffs were legal, which is kind of crazy, but also that he was like, this is not the proper use of the major questions doctrine, a doctrine he invented to constrain executive authority. But that’s neither here nor there.
Jonas Nahm:
[4:28] Which the liberal justices also didn’t sign on to, right? So it was sort of three people saying this is major questions, and then three people saying this is just, you know, illegal.
Robinson Meyer:
[4:39] Yes. And I think maybe crucially for this audience, Justice Gorsuch cited disapprovingly the Trump administration’s argument that a future president could use IEEPA, the statute in question here, to impose tariffs on fossil fuels or internal combustion engines because it considers climate change to be a national security threat. That was like an argument made by President Trump’s team on behalf of the tariffs to convey their belief that IEEPA had this huge economic policymaking power within it. And Justice Gorsuch was like, no, no, no, it doesn’t let you do that. And it also doesn’t let you impose these tariffs on all these other countries. OK, so I will say I have basically spent every moment up until now not learning about the other tariff authorities. They all are like known by a different number. And it always seemed like people were mentioning a new one. So can you walk us through just like with IEEPA out of the way, what are the other things? Authorities or powers under the law that have been used to impose tariffs on the past or that are seen as kind of being the other powers the president could invoke here if he wanted to keep slapping tariffs on major trading partners?
Jonas Nahm:
[6:00] So one of the big advantages of the IEEPA path for the administration was that it didn’t really involve a lot of procedure. And they had a lot of discretion. Now, no more. But at the time, thinking that they could do this, they had a lot of discretion about how to do this, who to apply this to, which products to exempt, and how to change it very quickly. And so it was basically fairly unconstrained. And so the other authorities all come with more process. And many of them are already in place with more process. So I think one thing to maybe start with is that the IEEPA tariffs are only one part of this tariff stack, and that different products have other tariffs applied to them already. Some of them stack on top of one another, some of them don’t, but there are many kind of authorities in this space that are being used at the same time.
Jonas Nahm:
[6:51] The president came out today and said they’re going to impose 10% universal tariffs under the Section 122, which is from the Trade Act of 1974, which is really to address kind of a large and serious deficit, it can be done very immediately, but it’s capped at 15%. They said they’re going to use 10. The problem for them is that it expires in 150 days unless Congress extends it. So it can sort of stop the revenue loss from taking away the reciprocal and the fentanyl tariffs. It can buy time for permanent fixes, but itself is not really a permanent solution unless there’s congressional buy-in in 150 days, which seems somewhat unlikely. So that’s what they’ve already decided they’re going to use sort of as the bridge to get to these other authorities.
Jonas Nahm:
[7:40] There’s another tariff authority called Section 232, which is about national security related issues. And so there you need to have an investigation and then you can impose these tariffs. We have lots of these investigations ongoing. Some of them are already completed, but pharmaceuticals, robotics, chips, I mean, there’s a bunch of them that are out there. And so what they don’t like about this is that you have to have this investigation so it’s not immediate. it. And so it requires a little bit of process.
Robinson Meyer:
[8:11] Like a Commerce Department investigation, right? This is like a, it’s like a known process where they...
Jonas Nahm:
[8:18] Yeah, and there needs to be a hearing and yes, all of those things. So that’s 232. And then you have Section 301, which is about unfair trade practices. That also requires an investigation and a public hearing, kind of a common period where industry can weigh in. And so you could use that to recreate these tariffs on a country by country basis, the Section 232 tears are mostly at the sectoral level. So the investigations are about sectors that have national security implications, although that has also been stretched widely by this administration. We’ve applied them to kitchen cabinets in this past year, so I don’t immediately follow the national security implications there. But, you know, there is some leeway there in how this is laid out. Section 301 is about unfair trade practices. And then there are the tariffs that were used, you know, almost 100 years ago after the depression, which is Section 338. That gets thrown around a lot. I think it has a lot less procedural constraints attached to it than these other ones. But it’s also untested in modern courts. And this would require the administration to prove that there’s discrimination against U.S. exports. And you could imagine a lot of litigation around how to define discrimination. And so these are sort of the broad authorities that exist and that the administration
Jonas Nahm:
[9:38] has signaled they will rely on. I think mostly the first three.
Robinson Meyer:
[9:41] It does seem like, I think one thing hearing this list is that there’s five other tariff authorities he could use. And while some of them have restrictions on time or duration or tariff rate, there’s actually still a good amount of like untested tariff authority out there in the law and if the president and his administration were like quite devoted they would be able to go out there and, figure out the limits of 338 or figure out the limits of of 301?
Jonas Nahm:
[10:17] Yeah, I mean, I think one thing to also think about is what is the purpose of these tariffs? Right. And so I think the justifications from the administration have been varied and changed over time. But, you know, they’ve taken in a significant amount of revenue, some 30 billion dollars a month from these tariffs. This was about four times as much as in the Biden administration. And so there is some money coming in from this. And so 122, the 10% immediately, would bring back some of that revenue that is otherwise lost. One question is what’s going to happen to refunds from the IEEPA tariffs? Are they going to have to pay this back? It seems like that’s also kind of a court battle that needs to be fought out. And the Supreme Court didn’t weigh in on that. But, you know, the estimates show that if you brought the 122 in at 10%, you would actually recoup a lot of the money that you would otherwise lose and the effective tariff rate in the U.S. Would go back from 10% to about 15%, roughly to where it was before the Supreme Court ruled on it.
Robinson Meyer:
[11:18] Has the effect of tariffs from the Trump administration been larger or smaller than what you thought it would be? Not necessarily in the immediate aftermath of “liberation day”, because he announced these giant tariffs and then kind of walked some of them back. But like the tariff rate has gone up a lot in the past year. Has the effect of that on the economy been more or less than you expected?
Jonas Nahm:
[11:43] I think that the industrial policy justification that they have also used is a completely different bucket. Right. So you can use this for revenue and then you can just sort of tax different sectors at different times as long as the sum overall is what you want it to be. From an industrial policy perspective, all of this uncertainty is not very helpful because if you’re thinking about companies making major investment decisions and you have this IEEPA Supreme Court case sort of hanging over the situation for the past year, now we don’t know exactly what they’re going to replace it with, but you’re making a $10 billion decision to build a new manufacturing plant. You may want to sit that out until you know what exactly the environment is and also what the environment is for the components that you need to import, right? So a lot of U.S. imports actually go into domestic manufacturing. And so it’s not just the product that we’re trying to kind of compete with by making it domestically, but also the inputs that we need to make that product here that are being affected.
Jonas Nahm:
[12:38] And so for those kinds of supply chain rewiring industrial policy decisions, you probably want a lot more certainty than we’ve had. And so the Supreme Court ruling against the IEEPA tariff justification is certainly more certainty in all of this. So we’ve now taken that off the list. But we are not clear what the new environment will look like and how long it’s going to stick around. And so from sort of an industrial policy perspective, that’s not really what you want. Ideally, what you would have is very predictable tariffs that give companies time to become competitive without the competition from abroad, and then also a very credible commitment to taking these tariffs away at some point so that the companies have an incentive to become competitive behind the tariff wall and then compete on their own. That’s sort of the ideal case. And we’re somewhat far from the ideal case. Given the uncertainty, given the lack of clarity on whether these things are going to stick around or not, or might be extended forever, and sort of the politics in the U.S. that make it much harder to take tariffs away than to impose them.
Robinson Meyer:
[15:26] I have heard from Democrats and like Democratic economic policymaker making staff, let’s say, that they really did believe that when Trump announced all these tariffs, that what people said it was going to crash the economy. And the fact that it like hasn’t necessarily crashed the economy has made some of them go, huh, well, maybe tariffs aren’t as bad as we kind of were told they were. And we should consider them as part of a broader economic playbook. Looking over the past year, have you been surprised by how resilient the U.S. economy has been despite all these new trade restrictions that didn’t exist two years ago?
Jonas Nahm:
[16:04] I think the answer to that question really depends on what you’re looking at specifically, right? So if this was supposed to be a manufacturing reshoring tool, in some ways it’s too early to tell whether it’ll work. We’ve seen this during the Biden administration. The Inflation Reduction Act came out. And by the time the election rolled around, a lot of these plants were still under construction. So in some ways, the theory was still untested on whether
Jonas Nahm:
[16:28] that would have changed people’s voting behavior, because we didn’t have enough time. And so in the same way, we don’t have enough time now. And we’ve seen manufacturing job losses over the last year, things have picked up a little bit recently, and sort of capacity utilization is up this month, or last month, rather in the U.S.. But I think that is from using existing plants more rather than building new ones in response to the tariffs. And of course, there are big announcements that have been made where companies that were going to build a plant in Canada are now building it in the U.S.. And some changes in decision-making have occurred as a result of it. But I think to really judge this as a sort of reassuring manufacturing industrial policy, it’s just too early. And I think the uncertainty really also then prolongs the period that it would take for companies to really do this. I mean, you’d want to think about that decision quite carefully. And while a lot of this stuff is still ongoing, I think companies have just avoided making big decisions.
Robinson Meyer:
[17:27] It’s also unclear to me how much of American trade tariffs actually did fall on in terms of specific bilateral relationships. So to be specific, like we talk about these fentanyl tariffs, which is the president’s name for what he said were 25% tariffs on Canada and Mexico and 10% tariffs on China and 10% tariffs on Canadian energy exports. And what, Those are big numbers, but what wound up happening in the immediate aftermath of his initial decision was that trade previously authorized under USMCA, the successor to NAFTA, was exempted or wasn’t fully subject to that tariff. And what that meant is that basically, for instance, no Canadian oil exports have ever been subject to this 10% tariff. It’s totally trade as normal between the two countries, at least on an energy basis, and yet. But notionally on the books, there is a threat of a much higher tariff, I suppose, if the president were to change his mind or in the future.
Jonas Nahm:
[18:31] I think you raise a really good point also because the effective tariff rate was around 15 or 16% or so, much lower than some of these headline numbers that were being thrown around. And that’s because we’ve exempted a lot of stuff, right? So coffee prices went up and we exempted Brazilian coffee imports. And we’ve taken other key industries out of this calculation. And USMCA-compliant goods were exempted from the fentanyl tariffs on Canada and Mexico. And so overall, the sort of number of products that are being impacted are much smaller than everything. And one of the interesting questions I think now is, for instance, in the Section 122 10% game that they’re trying to play, the process for exempting and excluding certain products works differently. And so if this really becomes a universal 10%, it would actually affect a lot of things that currently aren’t being tariffed by the reciprocal tariffs. And they don’t have a lot of time. So maybe that also plays into it where they don’t have the capacity to really plan it out strategically. And so if we’re now then moving to a world where a lot of critical inputs into domestic manufacturing are being tariffed at 10% that were previously exempt, that might have some negative consequences for the manufacturers that are trying to survive and all of this uncertainty.
Robinson Meyer:
[19:49] I guess that also removes like a huge opportunity for corruption, because one thing that would happen is the president would take not only like coffee out of the tariff. One thing that would happen is the president wouldn’t only remove tariffs on product categories like coffee, but he would just remove them from companies or put them back on other companies. And it seemed like this huge black box of potential corruption that there just wasn’t a lot of visibility into.
Robinson Meyer:
[20:17] Let’s talk about the sectors that we follow here. So what does this Supreme Court case mean, if anything, for electric vehicles?
Jonas Nahm:
[20:28] Maybe before we jump into this, just to remind everyone, so we’ve taken away one layer of this kind of cake of tariffs that we’ve built here over time. There’s Section 301, there’s Section 232s, there’s anti-dumping and countervailing duties. Sometimes there’s safeguards, Section 201. And so all of those things can apply to the same product. And so we’re sort of taking one piece out of that stack, but it means the others are still there.
Robinson Meyer:
[20:52] And crucially, this is not like a supermarket sheet cake with two layers or even a pound cake like you might.
Jonas Nahm:
[20:59] Make at home. No, it’s a fancy cake.
Robinson Meyer:
[21:00] It’s a Russian honey cake with 12 or 13 layers stacked upon each other of delectable trade-fine goodness.
Jonas Nahm:
[21:09] That’s exactly right. And so if we think about EVs, for instance, the European companies actually aren’t being tariffed under IEEPA. They’re tariffed under Section 232 for autos and parts, which is a totally different legal foundation. And so they are not benefiting from IEEPA going away. They might now get hit with 122s on top of what they were paying previously if that isn’t designed carefully. And so there’s a lot of open questions about what that actually looks like in practice, but it’s certainly not helping them. On the China side, which is probably our bigger concern, is that electric vehicles are already in the Section 301 penalty box and they get 100% on EVs and there’s tariffs on batteries under 301. So IEEPA was there with 10% for these products, but it wasn’t really the significant piece. And so I think there it doesn’t fundamentally change the landscape. But the problem, I think, is more that we have uncertainty and there’s this constant turmoil over what it’s going to be. And we have four meetings between Xi and Trump lined up for the year and he’s supposed to go there at the end of March and lots of uncertainty sort of in the policy space that IEEPA kind of feeds into, but wasn’t really that critical, I think.
Jonas Nahm:
[22:23] And on China specifically, the U.S.TR, the Office of the Trade Representative, launched in the fall a Section 301 investigation on China saying that they hadn’t adhered to the requirements of the phase one trade deal from the first Trump administration. They held the public hearings. They probably have a report ready to go. So they could reimpose also kind of on a national level 301 tariffs on China based on this finding, which could more than offset the loss of the Aiba tariffs.
Robinson Meyer:
[22:53] Okay, next sector. So what does this mean for solar? Because one interesting subplot here that my colleague Matt Zeitlin was talking about earlier today is that after “liberation day”, Wall Street became very convinced that First Solar, this U.S. solar manufacturing firm, was going to be the huge beneficiary of this new Trumpian tariff regime. And it really has not been at all. It’s like, it turned out that a lot of its inputs had new tariffs on them, that it really didn’t affect its business very much. But there are a lot of tariffs on solar. Are they that go back all the way to the Biden administration or the first Trump administration? Were those issued under IEEPA? And what is their current status?
Jonas Nahm:
[23:36] Solar was affected by the IEEPA layer in China, for instance, but there are other tariffs in place that are much more significant. And then on China and also Southeast Asian suppliers, there are anti-dumping and countervailing duties in place that are issued to specific companies. And so the rate kind of depends on which company, but some of them are over 200%. So there you might have a loophole that like a new supplier springs up that isn’t yet affected by this countervailing duty regime. And so they might benefit. But I think there are two, the IEEPA story is only one layer. We had Section 201 safeguards on solar that I think were expiring in February this year. So that layer was ending and now IEEPA is ending. But Section 301 on China and the ADECVDs remain in place and I think are going
Jonas Nahm:
[24:26] to make it unlikely that we see the sudden onslaught of Chinese supply.
Robinson Meyer:
[24:30] Are there any other kind of sectors to talk about here, you know, really affected by this or, I don’t know, data center inputs?
Jonas Nahm:
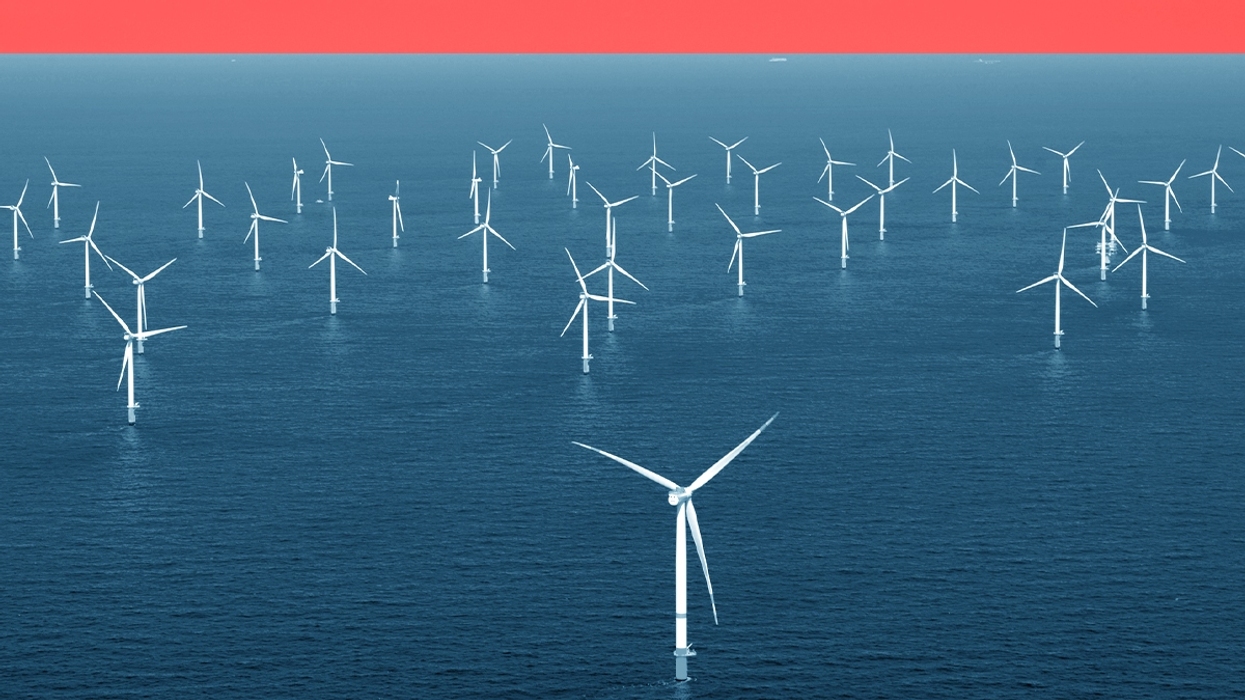
[24:41] Wind, I think, was exposed to the IEEPA layer to some degree, but I think the other question is more broadly, what are we doing with the domestic wind industry? There’s also a 232 national security investigation that is ongoing on wind that they could switch to as a justification, both on wind turbines and turbine parts. And so there, I think we might see some sort of temporary IEEPA relief, especially for inputs like metals and so on that are now coming in, perhaps at different prices. I don’t know if that can really help the wind industry overcome the broader headwinds that they’re facing with this administration. But, you know, if there is a real positive impact, I would expect them to very quickly switch to the 232 justification to make up for it. I think on data centers, it’s interesting.
Jonas Nahm:
[25:29] Data centers import a huge amount of equipment, right? So servers, networking, equipment, power distribution, cooling, switch, there’s all this stuff that goes into a data center. And if IEEPA went away and nothing replaces it, that might actually be a meaningful relief for a lot of that stack. But now under this 10% 122 surcharge, it’s coming back. And if some of these exemptions that we had in place for some of these components in order to support domestic data center build out are not included, and we have to see how they actually implement this, this could be quite negative. But to me, this is really a story at this point of thinking about this way more as a revenue source than a strategic industrial policy that’s trying to reshore certain sectors. And the more we change it up and switch from one authority to another, the more it becomes a revenue story because the actual economic impact in terms of reshoring is going to be less and less.
Robinson Meyer:
[26:22] So one thing I’m taking from this conversation is that while clean energy and energy inputs might get a tiny bit of relief, largely they were already subject to this existing stack of pre-existing tariff authorities under other laws. And so they might benefit from like some economic tailwinds from this, but it’s not like Chinese or Southeast Asian solar panels are going to suddenly
Robinson Meyer:
[26:50] be available in the United States at cost. Stepping back then, what is your read of how this ruling fits into the Trump administration’s trade policy, and I think broadly, America’s attempt to formulate some kind of industrial policy that now started with the first Trump administration, was continued and changed by the Biden administration, and now soldiers on under the second Trump administration.
Jonas Nahm:
[27:19] If I think about this broadly in terms of sort of economic policymaking, the tariffs are one tool you can use to shape the nature and structure and composition of the domestic economy. In many ways, what I think is much more important is what do you do behind the tariff wall to really help companies build competitive manufacturing capacity, for instance, right? And the tariffs themselves are not really enough to do much there. And a lot of the incentives and sort of support that, for instance, the Inflation Reduction Act included, that have been taken away or it’s shortened significantly. And so we’re doing kind of less on the domestic economy and we’re doing more at the border. But I think ideally you would do
Jonas Nahm:
[28:08] Much more certainty at the border, and then combine it with a domestic strategy. And I think we’re seeing some of this now happen kind of in the critical mineral space, you know, Vault, Forge, all these kinds of new initiatives that are being pushed out by the administration to look at the demand side, and kind of create more stable markets for these technologies, for instance. So slow beginnings of kind of the supply side and demand side match in pairing different industrial policy tools. But in some ways, I think this tariff game has been a huge distraction from the actual work that we need to do on vocational training, on financing for manufacturing, on creating stable demand for these technologies that we want to make domestically so that companies can get financing and invest. And so looking at trade policy in that kind of broader picture, it looks more like a revenue policy than an industrial policy because it’s not really coordinated with these other elements.
Robinson Meyer:
[29:05] I think we’ll have to leave it there. Jonas Nahm, thank you so much.
Jonas Nahm:
[29:09] Thank you for having me on.
Robinson Meyer:
[29:14] And that will do it for us today. Thank you so much for joining us on this special weekend emergency edition of Shift Key. If you enjoyed Shift Key, then leave us a review or send this episode to your friends. You can follow me on X or Bluesky or LinkedIn, all of the above, under my name, Robinson Meyer. We’ll be back next week with at least one new episode of Shift Key for you until then Shift Key is a production of Heatmap News. Our editors are Jillian Goodman and Nico Lauricella, multimedia editing audio engineering is by Jacob Lambert and by Nick Woodbury. Our music is by Adam Kromelow. Thanks so much for listening and see you next week.

Log in
To continue reading, log in to your account.
Create a Free Account
To unlock more free articles, please create a free account.
Rob checks in on this season’s supercharged ocean temperatures with climate researcher Zeke Hausfather.
Every few years, the Pacific Ocean’s surface waters become especially warm near the equator, a climatic phenomenon known as El Niño.
El Niño is a normal part of the climate system, but even in a normal year, it can trigger extreme weather around the world. Forecasters are worried that the current El Niño — which just began a few weeks ago — is going to be anything but normal. Models suggest that we could soon see the hottest El Niño ever measured, with unpredictable and catastrophic effects for ecosystems and societies around the world.
What does that mean? And why does this El Niño look so bad? On this episode of Shift Key, Rob is joined by Zeke Hausfather, a climate research lead at Stripe and a research scientist at Berkeley Earth. They discuss what forecast models are saying about this El Niño, why it gives us a glance at the future, and whether climate change itself is accelerating.
Shift Key is hosted by Robinson Meyer, the founding executive editor of Heatmap News.
Subscribe to “Shift Key” and find this episode on Apple Podcasts, Spotify, Amazon, or wherever you get your podcasts.
You can also add the show’s RSS feed to your podcast app to follow us directly.
Here is an excerpt from their conversation:
Robinson Meyer: How much, at this point, are we in an El Niño that is record-breaking? Like, how much do we see in observations, physical observations of the ocean or the atmosphere and the rest of the climate system, and how much do we think from the models that it is going to get even hotter?
Zeke Hausfather: So the way that we track the strength of an El Niño — there’s a few different ways to track it. But the most common one is from this particular region of the tropical Pacific called the Niño 3.4 region, which is sort of like about a third of the way into the Pacific off the coast of Chile, right around the equator. And that’s where this tongue of warm water forms during El Niño events. That’s sort of the characteristic signal of El Niños. And temperatures in that region, as of today, are at 2.8 degrees centigrade above normal, normal meaning the average of the last 30 years. So it’s sort of a sliding window that tries to remove some of the human-caused warming.
Robinson Meyer: Are we comparing temperatures from that region to another region? Or they’re just in that region two or more degrees above normal?
Zeke Hausfather: So it’s a good question. The traditional way that El Niño has been defined is to just compare that region to itself, but with a 30-year moving average applied to remove the effects of human-caused warming. There is another metric that was introduced by NOAA last year called the Relative El Niño Index, which is a variant where you sort of subtract out the average over the tropical ocean as a whole from that region, so you’re looking at the difference between that region and the rest of the tropics.
There’s pros and cons of that approach. Arguably, it removes the human warming signal a bit better, but it also can overly penalize really strong El Niño events that reach outside of that region because they start warming the whole tropics. So anyway, the details are technical, but the point on the observations is that we’re already seeing a very strong event occurring there today. You know, temperatures as of today, when we’re recording, August 10, are 2.8C above normal. To put that in perspective, the strongest ever anomalies we’ve recorded, at least daily in the satellite record since the 1980 or so, were in 2015, 2016, and those were about 3.1 degrees above normal. And so as of today, by itself, it would be the third strongest El Niño signal ever recorded in that region.
But what’s different is that El Niño almost always peaks near the end of the year. So if you look at all the El Niño events on record, there’s been one or two that have peaked in October, but the vast majority peak in November or December, and a couple as late as January. It’s a very persistent pattern of these events. And so the fact that it’s only the beginning of August now and we’re already at this extremely high level, we’re essentially running two to three months ahead of any other El Niño on record in terms of how quickly it’s developing, which is one of the reasons why we’re increasingly convinced that this is going to be a record-setting event. It’s going to blow any event we’ve seen previously out of the water. And if you look at the latest models that came out this morning, actually, it’s good timing. They’re predicting a peak of around 4C in the Niño 3.4 region, which will be, you know, more than a degree above the previous record and could end up being the strongest El Niño in 500 or 1,000 years. We don’t have great proxy estimates going back, but, it certainly is something well outside of anything we’ve seen since records began in 1850.
Robinson Meyer: The swimmer Katie Ledecky swims a race sometimes in the Olympics and she’ll be out swimming and then behind her there’s a computer-generated line which is the current world record, and she’s way out in front of the current world record, and you’re watching her and then she does she turns around in the pool and then the world record is behind her. That is the current El Niño. This is the Katie Ledecky-style El Niño.
You can find a full transcript of the episode here.
Mentioned:
NOAA’s El Niño page and the relative El Niño index
An Assessment of Earth's Climate Sensitivity Using Multiple Lines of Evidence, the 2020 paper where Zeke was a coauthor
Zeke’s blog post on AI emissions: The real energy use of agentic AI
John Bistline’s post on AI emissions at Watershed
Heatmap’s coverage of AI emissions: A New Guesstimate for Corporate AI Emissions
This episode of Shift Key is sponsored by ...
Discover the Yale Clean and Equitable Energy Development online certificate program at the Yale Center for Business and the Environment. In this fully online, 5-month program, you’ll learn from leading experts, develop practical skills, and grow a powerful network. Visit cbey.yale.edu to learn more and apply.
Music for Shift Key is by Adam Kromelow.
This transcript has been automatically generated.
Subscribe to “Shift Key” and find this episode on Apple Podcasts, Spotify, Amazon, or wherever you get your podcasts.
You can also add the show’s RSS feed to your podcast app to follow us directly.
Robinson Meyer:
Hello, it’s Wednesday, August 12, and the Pacific Ocean is officially in El Niño. According to the National Oceanic and Atmospheric Administration, sea surface temperatures in the key region of the Pacific are now above average, and the agency expects they’ll remain that way through early spring 2027. Now, even a normal El Niño can be a big deal. They can cause very wet winters in California, huge rainfall events in South America, and droughts or even famines in parts of Africa and Asia.
Robinson Meyer:
But if you’ve been paying attention, you know that this El Niño seems like it’s not going to be normal. It seems like it will be a super El Niño. Forecasters are now warning we could see the largest El Niño in years or decades, if not in a century or more. The last time we had a super El Niño event in 2015 and 2016, it caused almost $4 trillion in global economic damages. This one now seems like it could be even bigger. So I wanted to learn more about what might be coming down the pike, why we think this El Niño, even though it hasn’t happened yet, or has only just begun, could be so big and what it could all mean. And we have a great guest. Zeke Hausfather is a climate research lead at Stripe and a research scientist at Berkeley Earth. He’s also an IPCC author. He’s a climate scientist with a strong interest in observational temperature records, climate modeling, mitigation and emission scenarios, and carbon removal. He’s kind of working on all sides of the climate problem at the same time, which is why I always enjoy talking to him. And I can’t believe we’ve never had him on Shift Key before. On this show, we talk about why we think this El Niño will be so big, why it will be a kind of preview of sorts of the climate of the 2030s, and whether climate change now seems to be accelerating and getting worse. I’m Robinson Meyer, the founding executive editor of Heatmap News, and it’s all coming up on Shift Key. Zeke Hausfather, welcome to Shift Key.
Zeke Hausfather:
Thanks, Rob. Great to be on.
Robinson Meyer:
One reason I always enjoy talking to you is because you’re at this nexus of, let’s say, climate science and the physical systems and physical processes that happen in the world and mitigation and carbon removal and decarbonization and the various processes we need to master to tackle climate change. You’ve been tracking recently a particularly worrying set of developments around this year’s El Niño. And I think over the past few weeks, it’s gone from something watching you write and share what the models are saying, what we can know about the coming El Niño, has gone from making me think that it was, oh, that’s kind of interesting to, wow, this is a massive story that’s unfolding in front of us that’s going to shape this. Not only the next year of how we talk about weather and climate, but really the coming year of global events. So I want to just start by asking you, what do we know about this year’s coming Monster El Niño, as it has recently been described? And how has it developed over the past few weeks and months?
Zeke Hausfather:
Yeah, so it’s funny you call it a Monster El Niño. We’ve traditionally said super El Niño but this is going to be so far beyond a super El Niño if the models are right that we sort of need a new term for it i prefer monster to godzilla El Niño which is the other one thrown around but in terms of this year’s El Niño so we knew an El Niño was coming by late 2025 but we didn’t know how strong and so there’s a set of different dynamical models this year some of them are actual climate models some of them are you know more simple sort of adapted weather models But there’s about 14 or so different groups around the world that publish these sort of dynamical models of El Niño behavior. And so we knew that there was something in the pipeline. But at least initially, you know, circa January, February, it looked like it would be a pretty moderate event, you know, something maybe akin to... What we saw in 2010 may be enough by itself to drive a record warm year. And we’ll talk about the relationship later between El Niño and global temperatures, but not something that would be record setting by any stretch of the imagination. But by April or so of this year, we really started getting a big shift in the models. Back then, they showed something that could potentially tie 2015-2016 as the strongest El Niño event on record. Actually tie both 2015-2016 and the sort of storied El Niño of 1877-1878,
Zeke Hausfather:
Which is a particularly disastrous event in the early part of the record. But with every month that has come since, the models have been projecting higher and higher and higher estimates for this El Niño event. And the observations have been consistently overshooting what the models previously had projected. So, it’s not just the models that are going up, the observations are also skyrocketing and leaving the previous model projections in the dust. And there’s this thing in El Niño forecasting called the spring predictability barrier, which essentially is the fact that we’re just not very accurate at predicting El Niño during the spring. And so for a while there, everyone was kind of debating, like, is this another, you know, because there have been some historical cases where particularly individual models have gotten things really wrong in the spring. They’ve said the super strong El Niño event is coming, and it never came for one reason or another. The westerly wind bursts didn’t happen, or there’s changing patterns of circulation that led to the El Niño not developing. But now we’re well out of the spring predictability barrier, right? And we’ve seen observations already go into record territories. In fact, as of today, we are currently in the third strongest El Niño event ever recorded, maybe fourth if you go back to the 1800s.
Robinson Meyer:
Well, this actually gets to a key follow-up, which is how much at this point are we in an El Niño that is record-breaking? Like how much do we see in observations, physical observations of the ocean or the atmosphere and the rest of the climate system? And how much do we think from the models that it is going to get even hotter?
Zeke Hausfather:
So the way that we track the strength of an El Niño, there’s a few different ways to track it. But the most common one is from this particular region of the tropical Pacific called the Nino 3.4 region, which is sort of like about a third of the way into the Pacific off the coast of Chile, right around the equator. And that’s where this sort of tongue of warm water forms during El Niño events. That’s sort of the characteristic signal of El Niños. And temperatures in that region, as of today, are at 2.8 degrees centigrade above normal, normal meaning the average of the last 30 years. So it’s sort of a sliding window that tries to remove some of the human-caused warming.
Robinson Meyer:
Are we comparing temperatures from that region to another region, or they’re just in that region two or more degrees above normal?
Zeke Hausfather:
So it’s a good question. The traditional way that El Niño has been defined is to just compare that region to itself, but with a sort of 30-year moving average applied to remove the effects of human-caused warming. There is another metric that was introduced by NOAA last year called the relative El Niño index, which is a variant where you sort of subtract out the average over the tropical ocean as a whole from that region. So you’re sort of looking at the difference between that region and the rest of the tropics. There’s pros and cons of that approach. Arguably, it removes the human warming signal a bit better, but it also can overly penalize really strong El Niño events. That reach outside of that region because they start warming the whole tropics. So anyway, the details are technical, but the point on the observations is that we’re already seeing a very strong event occurring there today. You know, temperatures as of today, when we’re recording, August 10, are 2.8C above normal. To put that in perspective, the strongest ever anomalies we’ve recorded, at least daily in the satellite record since the 1980 or so, were in 2015, 2016 …
Zeke Hausfather:
And those were about 3.1 degrees above normal. And so as of today, by itself, it would be the third strongest El Niño signal ever recorded in that region. But what’s different is that El Niño almost always peaks near the end of the year. So if you look at all the El Niño events on record, you know, there’s been one or two that have peaked in October, but the vast majority peak in November or December and a couple as late as January. You know, it’s a very persistent pattern of these events. And so the fact that it’s only the beginning of August now and we’re already at this extremely high level, we’re essentially running two to three months ahead of any other El Niño on record in terms of how quickly it’s developing. Which is one of the reasons why we’re increasingly convinced that this is going to be a record setting event. It’s going to blow, you know, any event we’ve seen previously out of the water. And if you look at the latest models that came out this morning, actually, it’s good timing. They’re predicting a peak of around 4C in the Niño 3.4 region, which will be, you know, more than a degree above the previous record and could end up being the strongest El Niño in, you know, 500 or a thousand years. We don’t have great proxy estimates going back, but, you know, it certainly is something well outside of anything we’ve seen since records began in 1850.
Robinson Meyer:
The swimmer Katie Ledecky swims a race sometimes in the Olympics and she’ll be out swimming and then behind her there’s like a there’s a computer generated line which is the current world record and she’s way out in front of the current world record and you’re watching her and then she does she turns around in the pool and then the world record is behind her that is the current El Niño this is the Katie Ledecky style El Niño. This seems like as good a juncture as any to ask what physically is an El Niño? We talk about it as an event. We talk about it as a kind of phenomenon that can develop within the global climate system. I think people know that it has to do with the temperature of the Pacific, but what actually is physically happening on the planet when an El Niño occurs?
Zeke Hausfather:
So El Niño is a natural phenomenon. There is arguably some contribution of climate change to El Niño intensity and frequency, but it’s a topic that’s pretty heavily debated and we can talk about that in more detail later. But El Niño itself happens every three to seven years. It’s got a sister event called La Nina, which is essentially the inverse of it, which is unusually cold temperatures in the tropical Pacific instead of warm temperatures. And El Niño is driven by a combination of wind and currents. You have what we call westerly wind bursts that are changing the ocean mixing behavior in the Pacific. And so during an El Niño event, effectively the ocean takes up less heat, and so the atmosphere ends up being warmer, or the ocean even releases some heat. During La Niña, which is the inverse, the ocean, the deeper ocean, I should say, takes up more heat, And so the surface is cool. And so interestingly enough, during strong El Niño events, you tend to have a smaller increase or even in some extreme cases, a loss of ocean heat content, whereas the surface temperatures where we all live end up being much warmer. And so, you know, this isn’t necessarily something that is being caused by humans, but it’s happening on top of human driven warming. And a lot of the year to year variability in global temperatures, which many folks are familiar with looking at, are driven by the sort of El Niño-La Niña cycle.
Robinson Meyer:
What is driving this shift within the model? If the models believe that it’s going to be very warm, then it seems like there are probably signals within the physical system that are pushing them to believe the sea surface will get even hotter than it is right now. And so what are those signals that they seem to be responding to as we understand them?
Zeke Hausfather:
So there’s a couple factors going on here, right? One is, as I mentioned earlier, observations are persistently running above what previous model runs predicted. So observations themselves of the El Niño region sea surface temperatures are persistently running above. Driving projections for a strong event. But we are not just measuring sea surface temperatures. We are also measuring meteorological conditions that are favorable to the sort of westerly wind bursts that drive growing El Niño strength. And we’re modeling and observing what’s happening in the ocean below the surface. And so there we see this sort of pulse of warm water coming from the Western Pacific into the Eastern Pacific and moving up toward the surface. And that warm water is quite warm. You know, some regions are nine degrees centigrade above normal in sort of the deeper ocean temperatures. And that’ll emerge at the surface off the coast of Chile and then spread out across the El Niño tongue into the sort of eastern and central Pacific in the tropics. And so just seeing this warm water moving under the surface toward the El Niño region gives us a little sneak peek to, you know, what’s going to emerge in the next few weeks.
Robinson Meyer:
Because when you see the satellite imagery. That’s thermal coated of an El Niño, it looks like this big tongue of warm, I mean, you just called it the El Niño tongue, but it looks like this big, you know, stalactite of warm water is jutting out into the ocean, and then fading into the kind of baseline temperature mix. But it looks like this big warm tongue that I guess is aligned with the equator or just below the equator or?
Zeke Hausfather:
It’s right around the equator. Yeah. And I think tongue is generally the term that’s and used by folks. But under the surface, the sort of opposite is happening, right? So at the surface, it’s spreading out from the coast of Chile to the west. But under the surface, you have water moving eastward, like warm water in the deeper ocean. And then that’s coming up at the surface in Chile and then spreading westward. And so it’s almost a circulation you could think of it as.
Robinson Meyer:
Let’s bracket out what this El Niño might mean. But what does an El Niño generally mean for the rest of the world. I realize it has lots of these local effects, but one thing I’ve observed, and even reading about El Niño and covering El Niño, is it seems to be both understood as maybe the biggest annual variable in the climate system. And that means it’s both strongly described and also there’s a lack of specificity sometimes about what exactly it will do or what a large El Niño means as opposed to a small El Niño.
Zeke Hausfather:
So what we can most directly say is what’s happening in the tropical Pacific. You know, we’re measuring the sea surface temperatures. There’s that tongue that is very visible. It stands like a sore thumb in any global temperature map during an El Niño event. But when you shift temperatures in the ocean, in the tropical Pacific, it has a whole bunch of teleconnections to the rest of the planetary climate. It’s going to move the jet stream around, it’s going to lead to changing precipitation patterns. And again, some of these are more deterministic than others.
Zeke Hausfather:
It increases the odds of things. It doesn’t necessarily always cause things. But the things that we do tend to see most often associated with El Niño events are or in the El Niño tongue itself,
Zeke Hausfather:
And directly around it, things get a lot wetter. So coastal Peru and Ecuador see a huge amount of rainfall, the Horn of Africa. There’s a few other areas that tend to get quite a bit wetter. But, and in some ways more importantly, the area around that tongue to the north and the south of it and to the west of it get a lot drier. And this is probably the single biggest and most problematic impact of El Niño is its effects on rainfall in those regions. So places like Indonesia and Southeast Asia, India, Southern Africa, Northern Amazon, Eastern Australia, they all tend to get quite a bit drier during El Niño events. And if you look at some of the bigger El Niño related catastrophes in history, like the,
Zeke Hausfather:
You know, mass deaths following the 1877-1878 El Niño event, when depending on what study you look at, somewhere between, you know, three and 50 million people died, that was largely due to crop failure associated with drought in those regions. So that’s the one I’d be most worried about. But, you know, there are also a bunch of other effects. So the western U.S. famously gets wetter during El Niño years. We tend to have mudslides here in California. Route 1 is probably going to get washed away more than usual. You know, we tend to have a bit warmer temperatures in the northern parts of the U.S. and northwest Canada. You know, the oceans as a whole get warmer. One thing that we’ve started seeing during El Niño events starting in 1997, 1987-1988 is these sort of globally widespread coral bleaching events. So the first time this was observed was in 97-98 during that El Niño event. And it’s since then become sort of a common occurrence every time we have a strong El Niño and even some summers when we don’t because the oceans have
Senator Martin Heinrich:
Gotten so hot.
Zeke Hausfather:
And so certainly this year, that’s something that a lot of people are concerned about in the winter in the tropics. There’s also a bunch of different effects on storms associated with changes in wind shear and circulation patterns. A very strong El Niño event will suppress Atlantic hurricanes. It’s one of the reasons that our forecast for Atlantic hurricanes has been cut in half already and might be cut significantly further. But it does tend to lead to more cyclones in the eastern Pacific. So cyclones that might hit Japan or Hawaii or China are going to become more common this year. And then globally, it tends to warm the climate as a whole. So a strong El Niño event tends to be associated with a boost in global temperatures of up to 0.4C for four or five months, and for the year as a whole of around 0.2C. Though this event, because it’s so unprecedented, might push it much further than that. There’s also a bit of a lag in time between when El Niño peaks in the tropical Pacific and when the global temperature effects have felt of about three to five months. So that’s one of the reasons why, even though El Niño is going to peak this year, it’s next year, 2027, that’s likely to be the record shattering one in terms of global temperatures. And that’s a pattern that we persistently see in, you know, 1997 was warm and 1998 was record shattering. 2015 was warm and 2016 was record shattering. It’s the year after El Niño peaks that we really see this big boost in temperatures.
Robinson Meyer:
And that’s because basically we’ve added all this anthropogenic CO2 to the atmosphere. We already know the Earth is kind of out of temperature balance where there’s more heat captured in the atmospheric system than there would be in a kind of a thermostatic way. And normally how that’s dealt with is that heat gets dumped into the ocean and water goes down to the ocean, the ocean acts as a kind of planetary sink for heat from the atmosphere. Exactly. And if the ocean everywhere is unusually warm, but also if the world’s largest ocean is really, really warm at its warmest point, with heat radiating outward from there into the rest of the marine system, then it stops absorbing heat.
Zeke Hausfather:
If the ocean is absorbing less heat, which is sort of the major effect of El Niño, or even releasing heat in some extreme cases, that’s going to lead to a much hotter atmosphere. And so if we didn’t have El Niño and La Nina, almost every year would set a new record in a warming world. It would be monotonic, as we say. The line would just go up. But because we have El Niño and La Nina on top of that, some years are a bit cooler, some years are a bit warmer. And so you can even think of it as like a sine wave driven by El Niño and La Nina cycles on top of an upward line.
Robinson Meyer:
You referenced the 1877-1878 event. You referenced that this could be the biggest El Niño in 500 or 1,000 years. How do we know about El Niño events before the satellite record begins in let’s say around 1980 or even before I think modern 1877, 1878 is within the realm of modern temperature reconstructions where we take land records and put them together and some ocean records and put them together and then simulate the Earth’s climate and get a decent sense of what was happening in the climate system. But how do we know about these historical events?
Zeke Hausfather:
Yeah. So there’s, for a record like 1877, 1878, there’s sort of two ways we know about it. One is that we did have a decent amount of ocean measurements that far back. And so at least on trade routes, the sailing ships were throwing buckets over the side of the ship and pulling them up with a rope and sticking a thermometer in them. So we have some measurements in the El Niño region during that event. Not very many. So there still is a pretty big uncertainty there. But we also have a reasonable estimate of global temperatures. And so you can sort of back out to an extent the strength of an El Niño from its effect on global temperatures as well. And then when you go before 1850, we don’t really have any observations. I mean, there’s some land observations, but there’s not much in the way of ocean observations. And so there you’re relying on some individual proxy measurements like corals that can tell you something about temperature at a particular time. And you’re also looking at these overall global temperature reconstructions and trying to back out the strength of an El Niño event based on, you know, how spiky global temperature is. But certainly the further you go back, the lower the resolution those things are. So like 500 years, we can probably get at least a fuzzy picture.
Zeke Hausfather:
You know, a thousand years, you’re starting to push it just because it’s hard to pick up an event that’s only a year in duration in those proxy records that might have a resolution of 10 years or 15 years. And then obviously, if you push, well, before 1,000 years, you know, you’re starting to get into the realm of a single proxy observation is going to tell you something about 50 or 100 year average. And at that point, El Niño is just going to wash out. So it does limit the extent to which we can say something about the El Niño record.
Robinson Meyer:
Want to advance your career and transform the clean energy sector? Discover the Yale Clean and Equitable Energy Development Online Certificate Program from our sponsor, the Yale Center for Business and the Environment. In this fully online five-month program, you’ll dive into key phases of development while learning how to center community engagement. In just five hours a week, learn from leading experts, develop practical skills, and grow a powerful network. By engaging in video lectures, live sessions, and a capstone project, Yale ensures you have the expertise to respond to clean energy demand and drive economic resilience. Visit cbey.yale.edu to learn more and apply to the Clean and Equitable Energy Development Program. That’s cbey.yale.edu. Or check out the link in the show notes.
Robinson Meyer:
It’s interesting because to me the 2015-2016 event was right around the same time i started covering climate change and i think it actually marked a big moment in climate discourse if i’m allowed to historicize off the top of my head about these things december 2015 which is i really right as that El Niño event was peaking was the same month the paris agreement was signed obama had just issued and was about to fight in the courts for greenhouse gas regulations on power plants under the Clean Air Act. Then, of course, we had the 2016 election, of which a large amount of the content was about climate change. And I think an underrated amount of that election was about climate policy. And then we had the first Trump administration, during which climate became a more and more salient topic politically. And so 2015, 2016, that El Niño, the earth has had most of the warmest years on record have actually happened since that El Niño. That is still the decisive event to me. And I still remember, for instance, those mass coral bleaching events of the 2015-2016 period.
Robinson Meyer:
What do we know, if anything, about El Niño now that we didn’t know 10 years ago during that event? Or what do we know about El Niño’s relationship to climate change, if anything, that we didn’t know for the 2015-2016 event?
Zeke Hausfather:
Before I answer that, I’ll answer another related question, which I think is like why these sort of events have such salience in the public discourse. And I think, you know, part of that is that climate is a slow and gradual problem and our politics are not designed around slow and gradual problems. And so when we do have these acute events, which El Niño on top of global warming represents, you know, it’s a big spike upward. It gives us a sneak peek of, you know, what the new normal global temperature condition is going to be in a decade or so. You know, it tends to focus the attention. And so I think it is important for us to use that to the extent we can, because it is a little sneak peek of what’s coming soon. But in terms of the question you asked around what we know in addition about El Niño and climate, so there certainly have been a number of papers suggesting that climate change could be making strong El Niño events more common. There’s some physical mechanisms that have been proposed, but it isn’t something that shows up particularly robustly in our climate models today. And there are a number of scientists who also argue that there’s those physical reasons that have been proposed are not super strong. So I’d put this in the same category as the debates around like wavy jet stream from global warming and its effects on cold air outbreaks, for example.
Robinson Meyer:
And the way we jet stream, just for listeners, is the idea that climate change is making those extreme cold snaps that we have had recently in North American winters where it’s suddenly negative 10 for a day or two more common because the jet stream is less stable and it dips down, allowing the so-called polar vortex to dip down over more populous parts of North America than where it normally lives.
Zeke Hausfather:
I’d put both of those ideas in this category of very active scientific debate, like the jury is out. And so hopefully in another decade, we’ll have a stronger answer in both of them and more modeling and observations. But I don’t think we can say today that there’s particularly strong evidence that climate change is going to make El Niño’s stronger outside, of course, of, you know, the background warming, just making the impacts of everything worse.
Robinson Meyer:
Right. It’s so funny. I mean, it’s one of those classic climate science discussions where it would be great to know it would be an interesting answer that we’d learn about the Earth climate system. But it wouldn’t really, I don’t know that it would have policy relevance as maybe it would. I mean, maybe we’ll learn about key El Niño mechanisms that could come important later. But the key takeaway of climate science is and remains that we should, you know, reduce anthropogenic greenhouse gas emissions as fast as we possibly can while avoiding overall harms to humanity.
Zeke Hausfather:
And the climate impacts of human emissions are just so much bigger over time than the climate impacts of El Niño, right? You know, a strong El Niño event will add about 0.2 degrees centigrade to global temperatures for a year. You know, human emissions are adding that every eight years. So every eight years, we’re adding a permanent Super El Niño worth of heat to the climate system, which just helps put things in perspective. Or 1998, which at the time was a record-shattering year, would be an exceptionally cool year if it occurred this year.
Robinson Meyer:
Given the monotonic increases of human greenhouse gas emissions every year, at least so far, what does this El Niño event mean for global temperature rise? You’ve been involved in a debate with the, I would say, storied NASA, former NASA climate scientist Jim Hansen, about whether 2026 will be the hottest year ever. Maybe fill us in on that, but generally, what does this event mean for global temperature?
Zeke Hausfather:
Yeah. So El Niño provides a temporary boost in global temperatures. We know how it’s happened historically. It’s a little harder to predict this year because we’re so far out of sample. You know, if the models are right, we end up with a peak at 4C, which is more than a degree above anything we’ve ever seen before. We don’t have analogs to draw on. But if we assume the world is linear, which we get in trouble for sometimes, we would expect a boost in global temperatures in 2027 of, you know, 0.25, maybe even up to 0.3C. And so at least my latest estimate is that this year, 2026, will be pretty neck and neck with 2024. Probably still going to be the second warmest, but, you know, maybe a 40% chance it’s the warmest, 60% chance it’s the second warmest. So getting closer and closer to a coin toss. Next year, 2027, though, is going to shatter records. So the warmest year we’ve had to date was 2024, and that was about 1.5 degrees, 1.5, 2 or so above pre-industrial levels across the average of six different data sets that the scientists have put together. 2027 in those same data sets, given what the models expect El Niño to do, would end up around 1.7 degrees C.
Zeke Hausfather:
So even compared to the previous El Niño event, which was a big boost, you know, this event is going to shatter records. And so the air bars are still pretty big on that, in part because, you know, the models have a wide range of projections. If it ends up being an El Niño that only breaks a record by a small margin instead of shattering it, the global temperature response is going to be smaller. But under any of the El Niño forecasts, 2027 is going to be a record warm year. I think the last time I checked, there was about a 95% chance it sets a new record.
Robinson Meyer:
One of the multi-year running conversations in climate science, and I would say among climate analysts as well, is that this year, as you said, temperatures will be on average about 1.5C warmer than their pre-industrial average. I believe last year we were over 1.5C as well, or very close. And one way I’ve tried to be rigorous as this has happened in the climate system is to say, look, like just because you have one year, you know, of course, at this point, about eight or nine years ago, the IPCC came out with its 1.5C report, which basically said the effects of climate change at making the planet a degree and a half warmer than their pre-industrial average will be more severe than we thought will be bad. Well, it’s a thing that’s worth avoiding. One thing I’ve been carefully rigorous about is like a single year where the global average temperature is more than 1.5C above pre-industrial average doesn’t actually mean we’ve cleared this sort of conceptual 1.5C threshold. I mean, to be clear, we are definitely going to clear the 1.5C threshold, but the first year you do it is not when you actually clear that threshold. You need several years of data above 1.5C to bring the five or 10-year moving average above 1.5. It seems like with this big El Niño, though,
Robinson Meyer:
We are going to have warm temperatures. We’re going to really push that moving average a fair amount and at least could temporarily get the threshold to be pretty close. I realize it’s hard to predict more than beyond 2027. We don’t know what 2028. We could have a big La Nina in 2028 and it could push temperatures back down below 1.5C. But maybe to tie this into another conversation. I think for the past four years or five years at this point, really since the pandemic, global warming has appeared to accelerate. And there’s been this question about whether it was caused by reductions in particulate pollution or whether it’s some other process that’s being revealed as human emissions continue to drive it. I guess the other takeaway from this big El Niño event is like that acceleration is going to continue given that we’re going to be above 1.5C this year and we could be above 1.6 or 1.7 next year.
Zeke Hausfather:
Certainly, our estimates of when the world is going to cross 1.5C have been moving closer and closer to present. One of the challenges, I think there is broad agreement now that global warming is accelerating. In fact, I went out on a bit of a limb in 2023 and published a piece in the New York Times arguing that it was accelerating back when the evidence was much more mixed than it is right now. I think the debate is less today about is it accelerating and more about exactly how much and how quickly it is accelerating. And how much of that acceleration is being driven directly by human emissions, the combination of greenhouse gases that warm the planet and cutting emissions of aerosols, sulfur dioxide in particular, that have masked a portion of historical warming. And how much of it is being driven by feedbacks to the warming process, which in many ways are the more worrying factor, right? You know, is cloud changes that we’re observing, you know, all being driven by cutting air pollution and sulfur and shipping fuel and Chinese particulates from their coal plants? Or is that change in cloud behavior and clouds being less reflective a response to the warming itself? Because it turns out that the biggest driver of how sensitive climate models are to our emissions, this factor we call climate sensitivity, essentially how much warming you get if you double CO2.
Zeke Hausfather:
The biggest determinant of that in climate models is how clouds respond in a warming world. So if the cloud feedback is strong, if clouds become less reflective, if there’s less low-lying clouds, potentially more high clouds in a warming world, then you get a lot more warming for the same amount of CO2. And so we can’t say for sure today, what mix of factors we’re seeing. But I think a lot of us are really concerned that we might be seeing an emergence of a stronger cloud feedback, which would, all things being equal, tend to imply a higher climate sensitivity.
Zeke Hausfather:
But in terms of when we’re going to pass 1.5 degrees, unfortunately, the Paris Agreement didn’t actually define what they meant by 1.5 degrees, which has caused a lot of challenges after that. And then the IPCC decided to fill in the gap. And they said, OK, we’ll define 1.5 degrees as the midpoint of a 20-year period. So 20 years is long enough that El Niño and La Nina effects will cancel each other out, and you’ll just have the human warming, the long-term effects in there. The problem with that, of course, is that means you won’t know when you’ve passed 1.5 degrees until 10 years after the fact, which is not the most useful definition. So there’s a big paper in the works that myself and like 40 other people are co-authors of that hopefully is going to come out later this summer or fall that is trying to actually answer this question and say, how do we as a community figure out a way to define when we’ve crossed 1.5 degrees that doesn’t require waiting 10 years in the future to know? There’s still a bunch of different options you could choose and different methods and ways to combine observations and models or statistical smoothing or linear or exponential projections. Anyway, there’s a million different approaches one could take. The approach we took in this paper was essentially say, okay, which of these methods got previous periods right? Like when we passed one degree or when we passed 0.5 degrees, how resilient are they to like volcanic eruptions or weird El Niños or these other sort of things. But I do think the world is probably going to firmly pass 1.5 degrees by about 2028 or so, you know, it’s coming up pretty darn quickly.
Robinson Meyer:
I’ve always felt like we needed a number that was not just how much warmer is it than average. We need a kind of global warming index number, like a climate changey index that can spit out one number that says how much worse are things right now. The issue is that once you start thinking about what such an index would look like, you realize that you basically just want the global temperature average and also that it’s basically going to go up all the time. And so it doesn’t really have a useful function, except You know, when Europe is having a giant heat wave, you could be like, oh, it’s especially climate changey right now.
Zeke Hausfather:
We do have this human-induced warming estimate that we publish every year in the sort of climate change indicators report that Pierce Foster leads. And I think this year is about 1.4 degrees of pre-industrial levels was our
Zeke Hausfather:
best estimate for 2025, which is, you know, pretty darn close to 1.5.
Robinson Meyer:
We’re talking about this question of climate sensitivity, which is how responsive is the climate system when one doubles atmospheric CO2? CO2. And in many ways, it’s one of the core questions in climate science. And for a long time, we kind of had a distribution for it. We knew what the range of climate sensitivity might be, but we hadn’t made a lot of progress in cutting off the tails. You were a co-author on a 2020 paper that cut off the extreme low end and extreme high end estimates using a number of different lines of evidence. Given what we’ve seen since 2020, where there’s been this seeming acceleration in global warming, does that affect the conclusions of that work at all? Are you more worried that we’re on the high end or that there are more extreme high end possibilities within the climate system that maybe weren’t countenanced by how that paper was run? Or are we just landing, I believe that paper was found that climate sensitivity was somewhere between 2.6 and 3.9 Celsius, are we like pointing more toward the 3.9 side than the 2.6 side, given what we’ve seen over the past few years?
Zeke Hausfather:
So we rounded those numbers a bit in terms of what ended up in the IPCC sixth assessment report. But the IPCC report said that the likely range of climate sensitivity and likely in the IPCC’s parlance means there’s a roughly two-thirds chance it’s in that range was between 2.5 and 4C per doubling CO2. And the very likely range, the 90th percentile range, which I find more useful, to be honest, because a lot of things happen outside of a two thirds chance is somewhere between 2C and 5C if we double CO2. And that’s a pretty big range, right? A lot of stuff can happen between 2C and 5C, but...
Zeke Hausfather:
You know, we are doing an updated report, hopefully in time for the IPCC 7th assessment report that’s going to incorporate all of the evidence that’s come out since 2020, because, you know, it is a big question in climate science. And there’s been a lot of work that has come out in the last six years on this topic. And, you know, I don’t want to spill the beans early, so to speak, in terms of what we’re going to find. But I will say that there’s sort of two countervailing factors, one supporting higher sensitivity and one constraining it a bit. So the thing supporting higher climate sensitivity is what we’re seeing with earth energy imbalance. So this measurement we get from satellites of how much heat is being trapped in the climate system, which is something that’s a fairly new instrument. You know, we don’t have a super long record of it, but it is in some ways the most important measure because it is capturing the sum of the whole climate system. Now, it has shown values that are a bit on the high side of what most climate models expect. And so is an indication that climate sensitivity might be on the higher end, but it is also one satellite and a relatively short record. And so there’s reasons not to just use that as the only bit of information we have. The other thing that we have is the paleoclimate records. So the Earth’s more distant past, particularly the last ice age,
Zeke Hausfather:
The Pliocene, the Eocene, these sort of periods in the Earth’s more distant past that we have measurements of both carbon dioxide and greenhouse gas concentrations, but also of temperatures from proxy records. And those tend to suggest that climate sensitivity is not much above 5 degrees C. You know, if you have a really sensitive model, for example, it’s going to run away to snowball earth if it tries to simulate the last ice age. And there’s been a lot of work by that community to use things like pattern effects and sort of how the continents and ice sheets and everything were different in that period than they are today to try to infer what the relationship in that period means for climate sensitivity today. And I think that has not necessarily been pointing toward very high climate sensitivity. But that said, 5C warming for doubling CO2 is still very much in the range of possibilities. And so there’s been a bit of a heated debate between myself and Jim Hansen and a number of other folks in the community about this topic. And Hansen’s been arguing that climate sensitivity is probably close to 5C. And the rest of us have been saying that it could be. But across all the lines of evidence we have, we don’t necessarily think that it’s more likely to be 5C than 3C, right? I personally wouldn’t be surprised if at the end of the day, in the next IPCC report, we move the best estimate up to closer to 3.5 degrees C for doubling of CO2 from three. But it’s early days, and that’s not my chapter, so I don’t get to decide that.
Robinson Meyer:
Well, speaking of emissions, you recently published a blog post on the emissions intensity of using AI. And I appreciated it for a number of reasons, including the fact that you drew on this John Bistline paper, who’s a researcher at Watershed, trying to estimate the emissions intensity of AI, which was in turn covered by my colleague, Emily Panacorvo. So always great to see heat map in the mix. But your general takeaway from this paper and also from your own estimates was that AI, probably at this point, given how we use it, is much more emissions intensive than maybe early estimates or is somewhat more emissions intensive than early estimates and you were able to put some error bars around how we should think about electricity use associated with both chatbot ai and then also agentic and cloud code style ai and describe a little bit what you think the discourse is missing right now around those topics and why you think speaking of estimates coming in on the high end why some of the more popular estimates around the emissions intensity of AI may underestimate its emissions.
Zeke Hausfather:
So when you’re looking at AI energy use, there’s sort of top-down and bottom-up approaches you can take. I think the top-down numbers are broadly right, and those are the ones that give like, I don’t know, 15% of U.S. electricity use by 2030 going to AI data centers on the high end. I’m not arguing that estimates like those are too low. What this piece was more about is, what is the impact of me as an individual using AI tools? And there, the numbers that were published last year in 2025 by folks like Google or by OpenAI are not very realistic to the way people are actually using AI today. So these numbers that were published in 2025 were that AI per prompt, and by prompt, they mean typing something in a chat GPT text box and hitting enter and getting a response without a reasoning model, important distinction. So just one shot. But those take about 0.3 watts of energy, which really isn’t much, right? At 0.3 watts, you could do many, many, many thousands or tens of thousands of AI prompts and still have much lower impact than, you know. Running your air conditioner in the afternoon or, you know, driving to work.
Robinson Meyer:
That’s less than how a light bulb used to be. So if you didn’t feel bad about adding a single new lamp to your home, then you shouldn’t feel bad, so to speak, about using AI under that estimate. Yeah.
Zeke Hausfather:
But the problem, of course, is that some people are still using AI that way, but increasingly AI is being used in an agentic form. And that more means that you give AI a set of instructions or a goal to achieve. And then AI goes off and does many, many, many, things to try to achieve that goal. AI agents are, at least in the corporate world and the software engineering and scientific world, the vast majority of AI use today. And those agents make both much more complicated calls than the prompts would suggest and many, many more calls. And so when you look at the actual energy use of these AI agents, it’s something on the order of 600 times larger per prompt than the traditional, like, type something in a chat box and got to get an immediate response. And so that does end up adding up. I actually looked at two months of my own AI use because I had local logs of all of the numbers there.
Robinson Meyer:
When you say local AI use, these are calls you’re making locally to ChatGPT or Claude that you’ve retained a record for but the ai is still being run on an external device you don’t have a power meter hooked up to your desktop
Zeke Hausfather:
Yeah my desktop is using next to nothing this is some data center spinning up to process the call i made on my local cloud code but i found that on average i was using about three kilowatt hours a day for my agentic energy use which is the equivalent of running two refrigerators so that’s not nothing in big days when i was really doing some complicated like geospatial analysis or big data crunching exercise, I was using upwards of 10 kilowatt-hours per day. So maybe a third of the typical US household energy is just going to AI agents. And if you annualize that over the entire year, you end up with numbers that they’re not crazy. So for an entire year, my estimate is that my agentic AI energy use is about 1.1 megawatt-hours. If you convert that to CO2, again, using sort of a roughly average grid intensity, It’s about 370 kilograms of CO2. So that’s roughly half of a transcontinental flight. So again, it’s not enormous in terms of my overall emissions, but it’s also not trivial, like some of these initial estimates that came out last year would suggest.
Robinson Meyer:
Carbon emissions with average U.S. grid intensity or with the likely kind of it’s all coming from gas that...
Zeke Hausfather:
All coming from gas and average U.S. grid intensity are not that far apart at the moment.
Robinson Meyer:
Yes.
Zeke Hausfather:
Yeah. So this is using a bit of location-based analysis, but it’s pretty close to the all-gas assumption now. Where I’ve gotten some criticism there is people who said, well, if you account for the fact that these AI companies are buying RECs to cover their data center energy use by building clean energy elsewhere, even if it’s not directly powering the data center, then the number is probably lower. Which, you know, might be fair if they actually disclosed what those numbers would be, I would be happy to use them. But unfortunately, at the moment, AI companies are really not telling us much about the actual energy use of their products. And so we’re having to infer all this with very indirect methods. One of the main takeaways from this piece should be a plea for AI companies to be more transparent and actually tell us how much energy their systems are using.
Robinson Meyer:
I think this is very striking, particularly by Anthropic, which I think has published absolutely no estimates per token of its emissions intensity or energy use, even though it’s the quote unquote kind of good AI company. We just are kind of completely in the dark about what Claude uses. And in fact, we know that Anthropic is contracted with one of the Colossus data centers built by XAI, which is one of the worst offenders in terms of particularly emissions-intensive generation.
Robinson Meyer:
We’re going to have to leave it there. As El Niño continues to develop, maybe we’ll have you back to talk about just how bad it is. Zeke Hausfather, thank you so much for joining us on Shift Key.
Zeke Hausfather:
Thanks, Rob. It was a great conversation.
Robinson Meyer:
And that will do it for us this week, but we’ll be back next week with a new episode of ShiftKey. Until then, Shift Key is a production of Heatmap News. Our editors are Jillian Goodman and Nico Lauricella. Multimedia editing and audio engineering is by Jacob Lambert and by Nick Woodbury. Our music’s by Adam Kromelow. Thanks so much for listening. We’ll see you next week.
Boston-based startup Reservoir has raised an $8 million seed round to commercialize heat pump-powered water heaters.
There are plenty of ways to leverage everyday household appliances to shift electricity demand and free up capacity on the grid. But when energy nerds talk about these opportunities, they’re mostly focused on distributed energy resources like smart thermostats, residential batteries, and electric vehicle chargers. Water heaters — the vast majority of which are not internet connected — rarely enter the conversation.
Boston-based startup Reservoir wants to change that, raising a $8 million seed round to bring its sexier, techier heat pump water heaters to market. Asymmetric Capital Partners led the round, alongside Founder Collective and the climate-focused investor MCJ.
The startup has already installed its water heaters in nearly 100 homes around Boston. Each unit pairs an onboard computer with a heat pump, allowing it to learn a household’s hot water habits so it can begin preheating hours in advance of, say, your morning shower. That long lead time matters, as a heat pump can take five or six hours to warm up a standard 50-gallon tank. But if your schedule shifts and you need hot water at an atypical time, the unit comes equipped with backup resistance heating elements, allowing it to heat the tank quickly using the same technology many conventional water heaters do.
The company’s CEO, Luke Winston-Almanzar, was inspired to start the company when he realized that his water heater consumed more energy per year than it took to charge his electric car, but was dumber than his air fryer or watch.
“Most people don’t realize the water heater is the second biggest use of energy in the home. It’s almost 20%,” he told me, coming in behind space heating and cooling, which account for around half of a household’s total energy consumption. He saw an opportunity to help bring smart, energy efficient water heaters into the digital age, much the way Nest did for thermostats.
Simply switching to a heat pump water heater can already cut energy use by about 75% compared with standard electric models, which account for about half the nation’s fleet. And while most heat pump models now come equipped with internet connectivity and remote adjustment mechanisms, the startup’s predictive software is what truly sets it apart. While other units simply hold water at a consistent temperature, Reservoir squeezes out additional energy savings by only heating when it anticipates hot water will actually be needed, Winston-Almanzar told me. Ultimately, this adds up to an average $800 per year in customer savings compared to standard electric tanks, and around $150 for gas-powered tanks, according to the company’s estimates.
Scale that up to thousands of households, and water heaters become a grid resource that can participate in demand response programs and virtual power plants. “You get a smart water heater in homes — you can save people money, you can increase their comfort. But then you get 50,000 of them, and they’re connected, and you can actually offset Elon Musk’s data center,” Winston-Almanzar explained.
Because water heaters store thermal rather than electrical energy, they can’t send electricity back to the grid like residential battery storage systems can. But they can still shift when they consume electricity. For example, Reservoir can heat water in the early morning when demand on the grid is low and hold it until people start waking up and showering. Or for households that use more hot water in the evening, the system can heat up around midday when there’s lots of cheap, clean power on the grid. During times of peak demand, it can simply pause its heating cycle, drawing on the water it’s already stored.
While Reservoir hasn’t yet integrated its systems with a virtual power plant provider that could compensate customers for helping to alleviate strain on the grid, Winston-Almanzar sees this as a near-term opportunity. “What I’m sprinting towards is getting 1,000 units installed in Massachusetts because that gets us to the megawatt-hour-scale of thermal storage,” he told me, explaining that’s when VPP integration will start to make sense for a specific region.
Today, the startup’s base model retails for less than $4,000 fully installed, compared to $3,000 to $6,000 for a standard electric water heater, and includes all of Reservoir’s predictive capabilities. The company also offers a more feature-rich $5,450 model that has a “Party Mode,” which effectively stretches the capacity of a 50-gallon tank to deliver up to 150 gallons of hot water on high-demand days, such as when a household is hosting guests. This model can also proactively adjust the system when water pipes are at risk of freezing and offers “no-wait” showers, using a recirculation pump to deliver hot water instantaneously, without having to let the tap run first.
Those prices include the $1,050 rebate available for heat pump water heaters in Massachusetts, where Reservoir’s early installations are concentrated. While the Trump administration axed the Energy Efficient Home Improvement Credit, which covered 30% of the costs of eligible units up to $2,000, Winston-Almanzar says state-level incentives are helping fill the gap. The company has already expanded into Maine and New Hampshire, which offer their own rebates, and plans to enter additional major metro markets such as New York, Washington DC, Seattle, and San Francisco.
The company is also betting on its installation process as a competitive advantage. Rather than relying entirely on third-party contractors, Reservoir employs an in-house team of young, digitally native plumbers to install its systems — a team it expects will grow substantially as the company scales.
Ultimately, if Reservoir succeeds in becoming the Nest of water heaters, Winston-Almanzar predicts systems like his will eventually replace smart thermostats in VPP programs. “If you have a battery for where you need electrons moving, and you have a tank of water for when you need just heat moving, homeowners don’t even need to feel it,” he explained. While adjusting a customer’s thermostat can immediately impact their comfort, changing a water heater’s background operations will go largely unnoticed, he argued, making them a better option for VPP integration.
Turning one of a home’s largest energy loads into a giant grid battery that saves customers money certainly seems like a good bet. But it’s still early days. Reservoir will have to prove, through many thousands more installations, that the humble water heater truly has what it takes to become one of the grid’s most valuable distributed resources.