You’re out of free articles.
Log in
To continue reading, log in to your account.
Create a Free Account
To unlock more free articles, please create a free account.
Sign In or Create an Account.
By continuing, you agree to the Terms of Service and acknowledge our Privacy Policy
Welcome to Heatmap
Thank you for registering with Heatmap. Climate change is one of the greatest challenges of our lives, a force reshaping our economy, our politics, and our culture. We hope to be your trusted, friendly, and insightful guide to that transformation. Please enjoy your free articles. You can check your profile here .
subscribe to get Unlimited access
Offer for a Heatmap News Unlimited Access subscription; please note that your subscription will renew automatically unless you cancel prior to renewal. Cancellation takes effect at the end of your current billing period. We will let you know in advance of any price changes. Taxes may apply. Offer terms are subject to change.
Subscribe to get unlimited Access
Hey, you are out of free articles but you are only a few clicks away from full access. Subscribe below and take advantage of our introductory offer.
subscribe to get Unlimited access
Offer for a Heatmap News Unlimited Access subscription; please note that your subscription will renew automatically unless you cancel prior to renewal. Cancellation takes effect at the end of your current billing period. We will let you know in advance of any price changes. Taxes may apply. Offer terms are subject to change.
Create Your Account
Please Enter Your Password
Forgot your password?
Please enter the email address you use for your account so we can send you a link to reset your password:
What happens to the grid when the sun goes away?
Early April is typically a kind of goldilocks moment for solar power. Days are getting longer but the weather is still mild, meaning that higher solar power generation isn’t entirely eaten up by increased demand due to air conditioning.
But that all depends on the sun actually shining.
Monday’s solar eclipse took a big chunk of power off the grid. Since 2017’s eclipse, solar power generation has increased substantially, both locally (think rooftops) and at utility scale (think massive fields of solar panels). In 2017, the U.S. had around 35 gigawatts of utility-scale solar capacity, a figure that had increased to an estimated 95 gigawatts by the end of 2023.
While total solar eclipses are rare (the next one to hit the lower 48 isn’t expected until 2044), the challenges they present to grid operators may be part of the new normal. With vastly expanded renewable energy generation comes a greater degree of unpredictability, as a growing a portion of the generation fleet can drop off the grid due to weather and climate conditions — like, say, clouds of smoke from a wildfire — that cannot be precisely predicted by 17th century science.
Grid operators were confident they’d be able to manage through the eclipse without any reliability issues, and what actually transpired mostly confirmed their forecasts. In Texas, solar power production shrunk from around 13.5 gigawatts at noon, making up 27% of the grid’s electricity supply, to a mere 0.8 gigawatts at 1:30 p.m. Things did not go as well for the Midcontinent Independent System Operator, however, which includes a swath of the middle of the country from Minnesota to Indiana to Louisiana. Solar output was estimated to drop from around 4 gigawatts at 1 p.m. Central time to 2 gigawatts an hour later, according to Grid Status. Instead, output dropped to around 300 megawatts, causing real-time prices for power on the grid to spike.
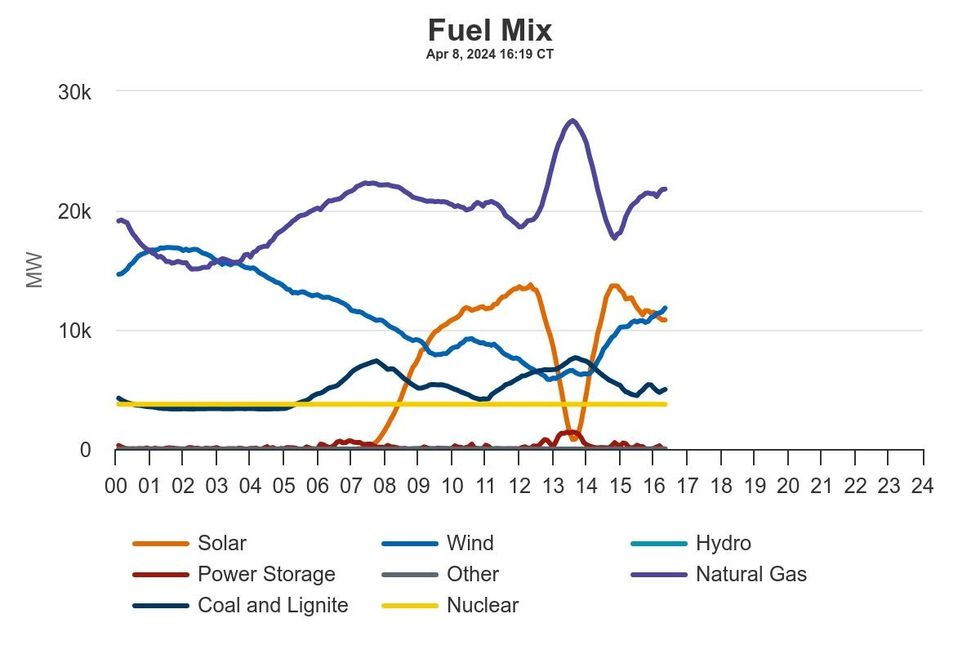
ERCOT’s fuel mix from Monday, April 8, including during the solar eclipse.ERCOT
Overall, the U.S. Energy Information Administration estimated that some 6,500 megawatts of solar generation capacity would be fully obscured during the eclipse, which would “partially block sunlight to facilities with a combined 84.8 GW of capacity in an even larger swath of the United States around peak solar generating time.” Some 40 gigawatts may have come off the grid, enough power for about 28 million homes, according to a release from Solcast, a solar forecasting company.
By comparison, during the 2017 eclipse, solar power loss at its peak was between 4 and 6.5 gigawatts and the total loss of power was around 11 gigawatts, according to the National Renewable Energy Laboratory.
In states like Texas, the main effect was on utility-scale production of solar, but in the Northeast and parts of the mid-Atlantic and Midwest, there was also a related problem: Behind-the-meter solar fell off, too, thus requiring the homes and businesses that generate power for themselves in the middle of the day to get more power from the grid, increasing demand on the grid at a time of low supply.
New England has seen immense growth in rooftop solar, and solar production was expected to fall by “thousands” of megawatts, according to ISO New England, while the New York Independent System Operators expected to lose 700 megawatts of behind the meter solar.
During the 2017 eclipse, the National Renewable Energy Laboratory found that “the burden of compensating for the lost energy from solar generators fell to the thermal fleet,” i.e. natural gas, along with some increases in coal and hydropower production.
Since then, the coal fleet has shrunk, thus putting more of the burden of responding to Monday’s eclipse onto gas and hydro, but the basic logic still applies. “Grid operators are expected to rely on natural gas to ensure stability and meet the household demand spike across national grids, as was done during the previous eclipse in 2023 in California and Texas,” according to Solcast. As the sun was dimming in Texas, natural gas generation rose from 18.7 gigawatts to 27.5 gigawatts.
Something else that’s changed since 2017: batteries. By the end of 2023, Texas had installed 5.6 gigawatts of grid storage, most of it providing so-called “ancillary services,” power sources that can respond quickly to immediate needs. ERCOT, the electricity market that covers most of Texas, said in a presentation back in February that it would rely on these ancillary tools to get through the eclipse, and once again, it was right. Power from batteries on the grid got up 1.4 gigawatts during the eclipse.
Editor’s note: This story has been updated to reflect the actual effects of the eclipse on U.S. power generation.
Log in
To continue reading, log in to your account.
Create a Free Account
To unlock more free articles, please create a free account.
On Trump’s latest wind target, new critical minerals, and methane maps
Current conditions: In the Atlantic, Tropical Storm Fernand is heading northward toward Bermuda • In the Pacific, Tropic Storm Juliette is active about 520 miles southwest of Baja California, with winds of up to 65 miles per hour • Temperatures are surging past 100 degrees Fahrenheit in South Korea.
Renewable investments dim in the U.S.Brandon Bell/Getty Images
In the United States, investments in renewable energy fell by 36% — equal to $20.5 billion — compared to the second half of last year, according to new data from the consultancy BloombergNEF. The drop “reflects a rush of construction toward the end of last year as developers sought to lock in lucrative tax credits, followed by a sharp drop this year as policy conditions worsened,” the report stated. The European Union, on the other hand, ratcheted up spending on renewables by 63% — or nearly $30 billion — in the first half of this year compared to the second half of 2024. Drawing an even sharper contrast, investments into both onshore and offshore wind made up the bulk of the growth in Europe as the Trump administration has placed the harshest restrictions on wind turbines of any other energy source.
Overall, global investment into clean energy rose 10% in the first half of 2025 compared to the same period in 2024. That included a worldwide increase in wind investments of 24% and a jump in new solar investment of 5%.
The U.S. Geological Survey released its latest list of critical minerals on Monday. The report highlights some shifts in U.S. production and concerns in Washington over potential supply disruptions from supposedly friendly powers. While the analysis identifies China as the biggest threat to the U.S. economy in 46 of the 84 commodities studied, “Canada and South Africa both show up as potential points of disruption across eight imports,” Farrell Gregory, a non-resident fellow at the Foundation for American Innovation, wrote on X. “Interestingly, Canada is identified as having a high-risk for disruption, more than South Africa and Russia.”
There were new bright spots in the report. The USGS removed tellurium, a silvery brittle metal used in semiconductors, from the list of risk resources it was added to in 2022. That’s because a new Rio Tinto mine transformed the U.S. from an importer into a net exporter in recent years.
It could have been worse. The Treasury guidance issued Friday dictating what wind and solar projects will be eligible for federal tax credits could have effectively banned developers from tapping the write-offs set to start phasing out next July. In the weeks before the Internal Revenue Service released its rules, GOP lawmakers from states with thriving wind and solar industries, including Senators John Curtis of Utah and Chuck Grassley of Iowa, publicly lobbied for laxer rules as part of what they pitched as the all-of-the-above “energy dominance” strategy on which Trump campaigned. Grassley went so far as to block two of Trump’s Treasury nominees “until I can be certain that such rules and regulations adhere to the law and congressional intent,” as Heatmap’s Matthew Zeitlin covered earlier in August.
Since the guidance came out on Friday, both Grassley and Curtis have put out positive statements backing the plan. “I appreciate the work of Secretary [Scott] Bessent and his staff in balancing various concerns and perspectives to address the President’s executive order on wind and solar projects,” Curtis said, according to E&E News. Calling renewables “an essential part of the ‘all of the above’ energy equation,” Grassley’s statement said the guidance “seems to offer a viable path forward for the wind and solar industries to continue to meet increased energy demand” and “reflects some of the concerns Congress and industry leaders have raised.”
Gas power plants are booming in the U.S. as demand surges, but the growth doesn’t yet mark a fundamental shift away from renewables, clean-energy analyst Michael Thomas wrote in a post on his Substack newsletter, Distilled. “If there were to be an unprecedented pivot to gas, you’d expect Texas to be ground zero for it,” he said. “The state has done everything it can to prop up fossil fuel power in recent years. It’s also one of the most permissive when it comes to environmental regulations and permitting.” Despite major growth in the past year, he wrote, gas made up just 10% of proposed new project capacity in Texas so far this year. The remaining 90% of capacity came from solar, wind, and battery projects. Last year alone, renewable and storage developers proposed 100 gigawatts of clean capacity — seven times more than gas developers proposed.
A new map allowing users to track risks from natural gas super-emitters launched Tuesday from the independent energy science and policy institute PSE Healthy Energy. The Methane Risk Map is a web tool with clickable markers representing individual methane super-emitting events throughout the U.S. Selecting one, as Heatmap’s Emily Pontecorvo wrote, “opens up a heatmap and information panel that shows the concentration of benzene, methane, and other pollutants present in that particular plume, the modeled distance each one traveled during the event, the demographics of the population exposed, and whether there were any sensitive facilities, such as schools or hospitals, in the exposure pathway.”
Though methane, the primary component of natural gas, is an extremely potent greenhouse gas and can pose an explosive risk at high concentrations, other components in unrefined natural gas present more direct public health risks. These include carcinogens like benzene and other health-harming substances, including toluene.
The grid-tech startup Splight has raised nearly $13 million to fund the commercial scaling of its breakthrough software. Unlike dynamic line rating, which uses weather and temperature data to open up more space on existing power lines to funnel as much as 30% more electricity, Splight claims its "dynamic congestion management” software can double the amount of room for electrons to flow without building new grid infrastructure.
The Methane Risk Map combines satellite and geologic data to visualize chemical exposure from natural gas plumes.
Methane-sniffing satellites have brought unprecedented visibility to “super-emitter” events, when the planet-warming gas gushes into the atmosphere at alarming rates — often from leaky fossil fuel infrastructure.
But those plumes contain more than just methane. Scientists are now using satellite data to look beyond the climate risks and assess the danger of super-emitting wells, tanks, and other assets to nearby communities.
PSE Healthy Energy, an independent energy science and policy institute, unveiled a “Methane Risk Map” on Tuesday that illustrates the spread of health-harming pollutants like benzene and toluene that also emanate from methane super-emitter events.
“The Methane Risk Map translates methane as a climate problem into methane as an air quality and human health issue,” Seth Shonkoff, PSE’s executive director, said during a briefing last week.
The vast majority of what we call “natural gas” is methane, but when it comes out of the ground, it also contains a host of other compounds, including carcinogens. The exact mix varies by location, and also changes as it moves through the oil and gas supply chain.
The Methane Risk Map is a web tool with clickable markers representing individual methane super-emitter events throughout the U.S. Selecting one opens up a heatmap and information panel that shows the concentration of benzene, methane, and other pollutants present in that particular plume, the modeled distance each one traveled during the event, the demographics of the population exposed, and whether there were any sensitive facilities, such as schools or hospitals, in the exposure pathway. It also gives the date the emission event occurred and what kind of equipment it came from, if available, such as a well or a tank.
Courtesy of PSE Healthy Energy
Underlying the map are two relatively new scientific developments. The first, as mentioned earlier, is satellite data. PSE pulls data released by the nonprofit Carbon Mapper, which launched its premiere satellite a year ago. Carbon Mapper’s sensing tools, developed in collaboration with NASA, essentially point a telephoto lens at oil or gas facilities to detect methane super-emitter events and measure how much of the gas is streaming out.
The problem, however, is that the satellite can only detect methane.
To solve that problem, PSE researchers created a database of the composition of natural gas at more than 4,000 facilities, spanning 19 oil- and gas-producing basins. When oil and gas operators apply for air permits, they have to submit facility-specific gas composition data from laboratory reports, often derived from direct samples of the gas. Researchers from PSE Healthy Energy went through thousands of regulatory documents to compile a database based on these reports. They found hazardous pollutants in more than 99% of the samples.
To build the Methane Risk Map, PSE combined methane emission rates from Carbon Mapper with this site-specific gas composition data, then used an air dispersion model to estimate the peak concentrations of each pollutant in the surrounding area after the release and show the area at risk. The map includes risk benchmarks set by state regulators for each pollutant, and shows that hazardous air pollutant levels from these super-emitters often exceed them.
While methane itself isn’t toxic, it can pose a safety risk at high enough concentrations from explosions or fires. So in addition to information about traditional air pollutants, users can also view the extent to which the methane released by an event posed a threat to the surrounding area.
One of the shortcomings of the project, and of methane-mapping efforts in general, is that the data isn’t accessible in real time. Carbon Mapper takes roughly a month from when its satellite spots a super-emitter to process and release the emissions data publicly — then PSE will have to run its own models and update its map. The satellites also represent only a moment in time — they don’t tell you when a leak started or how long it lasted. While the time delay could improve with technological and other advances, fixing the latter would require a lot more satellites.
The Methane Risk Map can’t yet function as an emergency response tool in a public health context, but that also wasn’t quite the intent behind the project. The PSE researchers envision policymakers, regulators, lawyers, and communities using the tool to push for stronger regulations, such as safer setback distances, stricter air quality monitoring requirements, and leak detection and repair rules.
The Environmental Protection Agency finalized stronger rules regulating methane and air pollution from the oil and gas sector in 2023, under the Biden administration. But after Trump took over the federal apparatus, the agency said it was “reconsidering” those rules. Since then, the EPA has extended compliance deadlines for many of the rules.
“As regulatory rollbacks in the climate and air quality arenas occur in the coming months, having this type of defensible data on the risk of these events and the risks they pose to human health will become increasingly important,” Kelsey Bilsback, the principal investigator for the project, said during the briefing.
Right now the map only includes emissions from the “upstream” oil and gas sector, but PSE plans to expand the project to include leaks from the midstream and downstream, too, such as pipelines and end-users.
Analysts are betting that the stop work order won’t last. But the risks for the developer could be more serious.
The Danish offshore wind company Orsted was already in trouble. It was looking to raise about half of its market value in new cash because it couldn’t sell stakes in its existing projects. The market hated that idea, and the stock plunged almost 30% following the announcement of the offering. That was two weeks ago.
The stock has now plunged again by 16% to a record low on Monday. That follows the announcement late Friday night that the Department of the Interior had issued a stop work order for the company’s Revolution Wind project, off the coasts of Rhode Island and Connecticut. This would allow regulators “to address concerns related to the protection of national security interests of the United States,” the DOI’s letter said. The project is already 80% complete, according to the company, and was due to be finished and operating by next year.
While Donald Trump’s antipathy towards the wind industry — and especially the offshore wind industry — is no secret, analysts were not convinced the order would be a death blow to project, let alone Orsted. But it’s still quite bad news.
“This is another setback for Orsted, and the U.S. offshore wind industry,” Jefferies analyst Ahmed Farman wrote in a note to clients on Sunday. “The question now is whether a deal can be struck to restart the project like Empire Wind,” the New York offshore wind farm that received a similar stop work order in April, only to have it lifted in May.
Morningstar analyst Tancrede Fulop tacked in the same direction on Monday. “We expect the order to be lifted, as was the case for Equinor’s Empire Wind project off the coast of New York last May,” he wrote in a note to clients, adding an intriguing post-script: “The Empire Wind case suggests President Donald Trump’s administration uses stop-work orders to exert pressure on East Coast Democratic governors regarding specific issues.”
When the federal government lifted its stop work order on Empire Wind, Secretary of the Interior Doug Burgum wrote on X that he was “encouraged by Governor Hochul’s comments about her willingness to move forward on critical pipeline capacity,” likely referring to two formerly moribund pipeline proposals meant to carry shale gas from Pennsylvania into the Northeast. Hochul herself denied there was any quid pro quo between the project restarting and any pipeline developments. Meanwhile, the White House said days later that Hochul had “caved.”
The natural question becomes, then, what can the governors of Rhode Island and Connecticut offer Trump? At least so far, the states’ Democratic governors have criticized the administration for issuing the stop work order and said they will “pursue every avenue to reverse the decision to halt work on Revolution Wind.”
Yet they have no obvious card to play, Allen Brooks, a former Wall Street analyst and a senior fellow at the National Center for Energy Analytics, told me. “They were not blocking pipelines the way the state of New York was, so there’s not much they can do,” he said.
Even if Interior does reverse the order, the risk of a catastrophic outcome for Orsted has certainly gone up. The company’s rights issue, where existing shareholders have an option to expand their stakes at a discount, is intended to raise 60 billion Danish kroner, or around $9 billion, with some 5 billion kroner, or $800 million, due to complete Revolution. Jefferies has estimated that Revolution, which Orsted owns half of, will ultimately cost the company $4 billion.
The administration’s active hostility toward wind development “calls into question that business model,” Brooks told me. “There’s going to be a lot of questions as to whether [offshore wind developers] are going to be able to raise money.”
The Danish government, which is the majority shareholder of Orsted, said soon after the announcement that it would participate in the fundraising. The company reaffirmed that patronage on Monday, saying that it has the “continued support and commitment to the rights issue from its majority shareholder.”
Orsted’s big drop will also drag down the fortunes of its neighbor Norway, via the latter’s majority state-owned wind power company Equinor, which bought a 10% stake in Orsted late last year.
“Their investment decision looks terrible,” Brooks told me.
At the close of trading in Europe, Orsted’s market capitalization stood at around $12 billion. That’s about a third less than where it sat before the share sale announcement.
In a worst case scenario involving the cancellation of both Revolution and Sunrise Wind, another troubled offshore project planned to serve customers in Massachusetts, Fulop predicts that the long-run value of Orsted would go down enough that it would have to offer its new shares at a greater discount — which would, of course, raise less money.
The best case scenario may be that Orsted will join its Scandinavian peer in resolving a hostage negotiation with the White House, with billions of dollars of investment and over 1,000 jobs in the balance.
“The Empire Wind case suggests President Donald Trump’s administration uses stop-work orders to exert pressure on East Coast Democratic governors regarding specific issues,” Fulop wrote. Right now, it’s workers, investors, elected officials, and New England ratepayers feeling the pressure.