You’re out of free articles.
Log in
To continue reading, log in to your account.
Create a Free Account
To unlock more free articles, please create a free account.
Sign In or Create an Account.
By continuing, you agree to the Terms of Service and acknowledge our Privacy Policy
Welcome to Heatmap
Thank you for registering with Heatmap. Climate change is one of the greatest challenges of our lives, a force reshaping our economy, our politics, and our culture. We hope to be your trusted, friendly, and insightful guide to that transformation. Please enjoy your free articles. You can check your profile here .
subscribe to get Unlimited access
Offer for a Heatmap News Unlimited Access subscription; please note that your subscription will renew automatically unless you cancel prior to renewal. Cancellation takes effect at the end of your current billing period. We will let you know in advance of any price changes. Taxes may apply. Offer terms are subject to change.
Subscribe to get unlimited Access
Hey, you are out of free articles but you are only a few clicks away from full access. Subscribe below and take advantage of our introductory offer.
subscribe to get Unlimited access
Offer for a Heatmap News Unlimited Access subscription; please note that your subscription will renew automatically unless you cancel prior to renewal. Cancellation takes effect at the end of your current billing period. We will let you know in advance of any price changes. Taxes may apply. Offer terms are subject to change.
Create Your Account
Please Enter Your Password
Forgot your password?
Please enter the email address you use for your account so we can send you a link to reset your password:

Have you looked at your power bill — like, really looked at it? If you’re anything like Rob, you pay whatever number appears at the bottom every month and drop it in the recycling. But how everyone’s power bill is calculated — in wonk terms, the “electricity rate design” — turns out to be surprisingly important and could be a big driver of decarbonization.
On this week’s episode of Shift Key, Rob and Jesse talk about why power bills matter, how Jesse would design electricity rates if he was king of the world, and how to fix rooftop solar in America. This is the finale of our recent series of episodes on rooftop solar and rate design. If you’d like to catch up, you can listen to our previous episodes featuring Sunrun CEO Mary Powell, the University of California, Berkeley’s Severin Borenstein, and Heatmap’s own Emily Pontecorvo.
Shift Key is hosted by Robinson Meyer, the founding executive editor of Heatmap, and Jesse Jenkins, a professor of energy systems engineering at Princeton University.
Subscribe to “Shift Key” and find this episode on Apple Podcasts, Spotify, Amazon, or wherever you get your podcasts.
You can also add
the show’s RSS feed to your podcast app to follow us directly.
Here is an excerpt from our conversation:
Robinson Meyer: There’s other issues we could talk about electricity rate design, and I want to come back to them in a second. But let’s say you were made Grand Vizier of all public utility commissions across the country. How would you fix this? Like, what do we need to do?
Jesse Jenkins: I think there’s basically two options that we have, here — and this is, you know, a reflection of the fact that there is no one unified electricity market structure in the U.S. We have a bunch of different ways that we do things. And so I’ll just sketch two kind of classic examples of that. There are lots of little gradations in between.
One is a kind of traditional regulated market where you get your power from a regulated or publicly owned utility, like a municipal utility, or a rural utility district, or an investor-owned utility. It’s regulated by the state, and you buy power at whatever the regulated rate is. And so, if that’s the case, we need to get those rates right. And by that I mean: There are multiple things you’re paying for when you’re paying for your bill. You’re paying for the actual energy you’re consuming, and that is a kind of volumetric thing — you know, you should pay more the more you consume, all else equal.
But the interesting feature of electricity pricing is that it varies from hour to hour because of the fact that demand is changing all the time and renewable energy availability is changing all the time. And so the actual marginal cost of generating electricity depends on this intersection of how much you demand and what the available supply is. And if you have a lot of cheap renewables, for example, flooding the grid, that price could be very low. It could even be zero — when you’re curtailing solar or wind, you have excess free power, effectively. And at other times it can be very expensive when you’re running diesel generators or inefficient gas turbines to meet this sort of peak demand requirements. Electricity prices could be several hundred dollars a megawatt-hour.
And so we have a very wide range of pricing and we don’t communicate that at all to people today. And I think we have to restore that, in some way — to let people understand that if you consume more energy during the middle of the day when there’s lots of solar available, even if you don’t have solar on your roof, it’s coming from your neighbor or utility-scale solar farm far away, that’s the cheapest, best time to consume electricity. And if you’re consuming when fossil power plants are producing expensive power, you should think about how to reduce that consumption. So it’s really important that we get that kind of time dynamic rate right for the energy component.
Robinson Meyer: So you would expose people to prices. I mean, that’s kind of your basic answer is that you would expose people to these time-of-day prices even if — and I just want to be clear, here. You’re talking about folks who live in Washington, D.C., who live in New York, who live in Philadelphia, who live in San Francisco, who live in Atlanta …
Jesse Jenkins: All over. Yeah, everywhere.
This episode of Shift Key is sponsored by…
Watershed’s climate data engine helps companies measure and reduce their emissions, turning the data they already have into an audit-ready carbon footprint backed by the latest climate science. Get the sustainability data you need in weeks, not months. Learn more at watershed.com.
As a global leader in PV and ESS solutions, Sungrow invests heavily in research and development, constantly pushing the boundaries of solar and battery inverter technology. Discover why Sungrow is the essential component of the clean energy transition by visiting sungrowpower.com.
Music for Shift Key is by Adam Kromelow.
Log in
To continue reading, log in to your account.
Create a Free Account
To unlock more free articles, please create a free account.
The problem isn’t just affordability, two researchers from Heatmap and MIT’s Electricity Price Hub argue. Bill volatility also creates pain for electricity consumers.
Americans have come to expect shocking electricity bills, especially in the summer months. The latest data from the Electricity Price Hub makes clear: Households in every region of the country are seeing not just record high July bills, but also bills that are sharply higher than even just a few months before.
Some may see these trends and argue that utilities and regulators set rates, but bills are ultimately the result of consumer choices about how much electricity to use. But that narrative misses the mark for a simple reason: How utilities and regulators design rates influence both summer bill swings and how much electricity consumers use. Seasonal rates and other features of electricity pricing can exacerbate summer bill swings and inform customers’ decisions about whether certain electricity uses — even running the air conditioner on an extremely hot day — are worth it.
The scale of this summer’s electricity bill increases is striking. Nationwide, the average household electricity bill was $90 per month, or 71% higher in July than it was in April of this year. Not only are bills up, they are up from a high base. The national average bill in April 2026 was higher than any previous April average in the Electricity Price Hub data, and 37% higher than the national average in April five years ago.
These trends are not just driven by a few states. There are households in every corner of the country experiencing sharp increases in their power bills this summer.
At the state level, average household bills have increased the most in New Jersey (up 163%), Nevada (157%), and Oklahoma (133%), but bills have at least doubled in 11 states and are up 1.5 times in 24 more.
In 19 different states, average household bills from major utilities at least doubled from April to July, adding between $72 and $214 per month to their average customers’ bills. In 12 of those states — including some in the Northeast, Mountain West, South, and Southeast — more than 40% of all households are served by utilities whose average bills have at least doubled this summer.
Greater electricity use is a big part of what’s at play in these trends, but it’s not the whole story. Higher summer rates also contribute, in many cases. Rate design, market conditions, and regulatory processes can all cause electricity prices to change throughout the year.
Some utilities, for instance, have rates that vary seasonally, automatically adjusting in the summer months. Seasonal rates contribute to summer bill increases for eight of the 10 utilities whose average bill increased most from April to July. For three of those utilities, over half of the April-to-July increase was driven by seasonal rates. For another five, seasonal rates play a meaningful role, compounding usage-driven increases. For only two does the increase come back to usage alone.
Taken together, these findings suggest that summer bill shocks are not simply a function of warmer weather. In many cases, they also reflect deliberate choices about how utilities price electricity during the summer months.
Even where higher usage is the primary driver of rising summer bills, the way utilities structure rates influences how much customers can save by using less electricity or shifting when they consume power.
Across the utilities with the largest April-to-July bill increases, there is considerable variation in how they calculate a customer’s monthly bill. All include a mix of fixed monthly fees and charges based on usage, measured in dollars per kilowatt-hour. But the balance between these components differs significantly, with fixed charges contributing from 4% to 23% of average bills over the past 12 months. Some utilities apply the same per kilowatt-hour rate year-round, while others increase rates in the summer. For some, the same rate applies to the total amount of electricity customers use in a month, while others have rates that increase for higher tiers of usage.
That means the design of residential rates also determines how much households actually benefit from using less electricity. Two households may receive similar-sized bills, but depending on how their utilities structure their rates, customers can see very different savings from cutting back.
The three New Jersey utilities in the top 10 illustrate one approach: They all have relatively small fixed customer charges, along with per-kilowatt-hour rates that vary both seasonally and by usage tier. For example, Jersey Central Power & Light’s distribution charge shifts from a single volumetric charge in the winter to a tiered structure in the summer, with usage above 600 kilowatt-hours priced at a higher rate. This structure contributes to sizable seasonal bill swings, but it also creates a strong financial incentive to limit summer usage.
The average household in JCP&L’s service area used more than 1,000 kilowatt-hours in July 2025. Had that household used 15% less electricity, it would have saved roughly $50 that month; a 25% reduction would have saved $82. At current rates, a 25% reduction in usage would cut the average bill by 28%, and every 4 kilowatt-hour reduction in usage over 600 kilowatt-hours saves a dollar.
Nevada Power takes a different approach. Its residential rate consists of a larger fixed customer charge — contributing 14% of total average bills over the last year — and a set of volumetric rates that do not vary by season or usage level. As a result, consumers have less of a financial incentive to reduce consumption. A household would need to reduce usage by roughly 8.4 kilowatt-hours to save a dollar, and cutting electricity use by 25% would reduce the bill by about 23% — meaningfully less than under JCP&L's structure.
While seasonal variability in bills is expected and not on its face problematic, it is important to recognize that unpredictability and month-to-month volatility in power bills can compound energy affordability challenges. And although regulators cannot control the weather, the choices they make about rates influence the agency households have in managing their bills each month.
This then raises the question: Should utilities and regulators consider bill stability and its impact on affordability in setting rates? Staff for the Arizona Corporation Commission, which is currently considering requests from the state’s two investor-owned utilities to raise average household bills by around 15%, recently testified that “affordability and energy burden are not pertinent to ratemaking” — that they are, instead, “societal issues.” But that is exactly the wrong sentiment.
Affordability and bill stability both deserve to be explicit considerations in ratemaking, carefully weighed against other objectives and not dismissed or treated as an afterthought. Doing so may look different in different places and does not require prioritizing bill stability over all else. But where households are struggling to manage unpredictable power bills, regulators should be sensitive to those trends and lend greater weight to measures that boost households’ ability to manage usage and limit bills, should they choose to.
That may mean more effective and targeted energy efficiency and demand response programs and incentives for utilities to promote uptake. In some cases, it may call for better customer education on available rate schedules and ways to manage bills, and ultimately it may require more modern rate design. Whatever the response, stability is part of affordability. Wild bill swings add to the burden of record-high bills — a fact that utilities and regulators cannot afford to ignore.
On Trump’s mineral deals, the gas turbine backlog, and Turkic offshore wind
Current conditions: Tropical Storm Lala could strengthen into a hurricane before hitting Hawaii’s Big Island, becoming the first such storm to make landfall there since 1900 • A glacial outburst at Suicide Basin near Juneau, Alaska, is raising the Mendenhall River • Temperatures surpassed 107 degrees Fahrenheit in Zaragoza, the inland capital of Spain’s Aragon region.

The United States is rapidly approaching a two-decade streak as the world’s No. 1 producer of natural gas. The country held the top spot between 2009 and 2024, the latest year for which the U.S. Energy Information Administration has data. But America pumped record volumes of natural gas last year. And now the federal energy research agency forecasts 2026 will be another record year. Marketed natural gas production — the total volume that actually makes it to market, minus what’s burned off or leaks as waste — is set to reach an average of 122.5 billion cubic feet per day in 2026, up from 2025’s record of 118.5 billion cubic feet per day. The new milestone is the result of expanded drilling in the Permian region that straddles Texas and New Mexico, and in the Haynesville area, between Texas and Louisiana.
When the Trump administration first started buying up equity stakes in mining companies, former officials from the Biden administration told my colleague Matthew Zeitlin they were “jealous” that the Republican White House had the guts to try something novel to compete with China on the metals needed for defense and energy technologies. Now, however, top Democrats are asking federal watchdogs to probe whether the American taxpayer is actually getting good deals. New Mexico Senator Martin Heinrich, the ranking member of the Senate Energy and Natural Resources Committee, and Representative Jared Huffman, the top Democrat on the House Natural Resources Committee, called on the Government Accountability Office to open an investigation into potential conflicts of interest. In a letter sent last week to Acting U.S. Comptroller General Orice Williams Brown and published Thursday on E&E News, the lawmakers accused the White House of violating rules to assess the financial risk of federal purchases. “These equity acquisitions also create potential conflicts of interest for federal agencies because a significant portion of the planned mining operations are located on federal lands,” they wrote. “With the executive branch now holding direct financial equity in these private mining operations, the federal government is required to act simultaneously as a mining investor and land-use regulator, an inherent conflict of interest.”
Mitsubishi’s backlog of orders for large-frame gas turbines is now more than twice its output from last year. In the 2025 fiscal year, the Japanese industrial giant delivered 16 gigawatts of gas turbines and had a backlog of 23 gigawatts. Just halfway through 2026, that backlog has ballooned to 35 gigawatts, executives told investors on the latest quarterly earnings call. The update, announced in Japan last week and covered in English by Utility Dive on Thursday, shows that “demand for large-frame gas turbines remains broadly in line with, or slightly above, the strong level we had anticipated,” Hiroshi Nishio,the chief financial officer of Mitsubishi Heavy Industries.
Power electronics maker Heron Power, meanwhile, unveiled plans for a $100 million factory in Morgan Hill, California. The startup, led by a former Tesla executive, aims to produce next-generation transformers that can patch more solar panels and batteries on the grid and help ease some of the issues that arise from the direct current-based electricity sources. The first factory is designed to churn out 40 gigawatts of Heron Links, the transformer product, per year. “America's grid has to grow faster than it has in decades. We’re seeing new demand from AI and EVs, and at the same time new supply from solar and storage,” Drew Baglino, Heron Power’s chief executive and founder, said in a statement. “The equipment running the grid hasn’t changed in 50 years. Heron Factory One in Morgan Hill is how we fix that. We’re manufacturing the leapfrog technology our grid needs, at scale, in America first.”
Sign up to receive Heatmap AM in your inbox every morning:
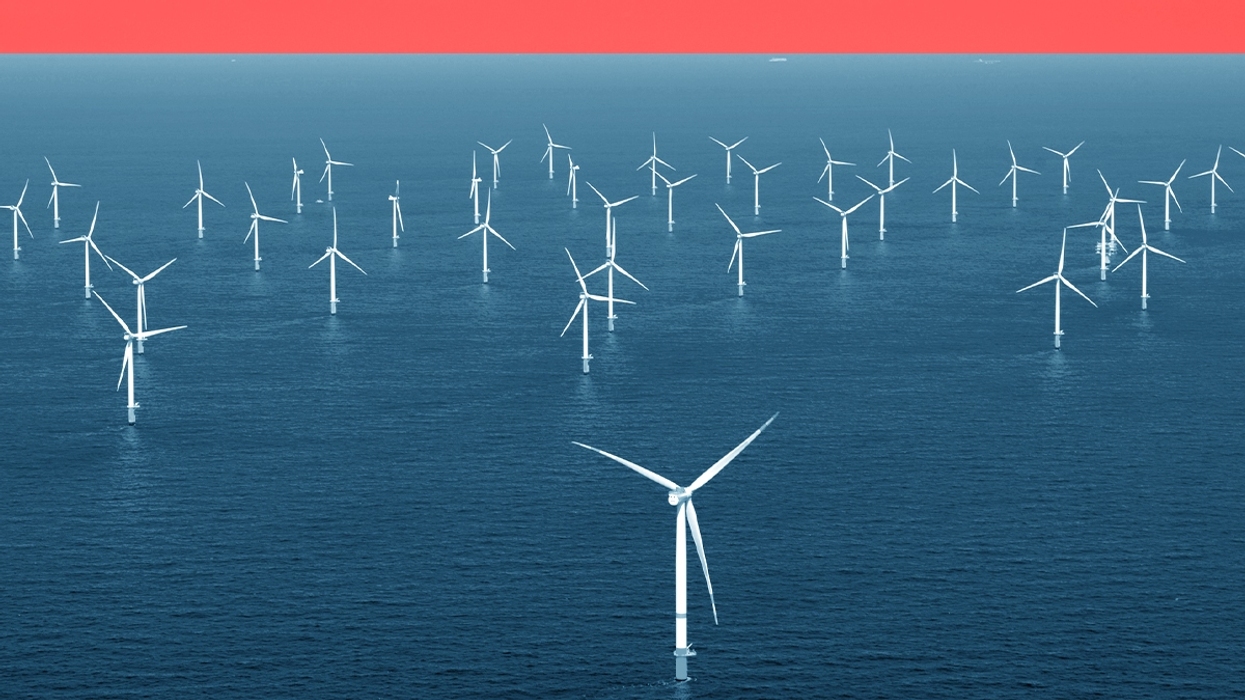
Offshore wind is in retreat in the U.S., where, as my colleague Robinson Meyer wrote this week, the Trump administration is paying billions to kill projects that were already dead or dying. The industry’s tide is also ebbing in Japan, where the new right-wing government of Sanae Takaichi is putting a heightened focus on nuclear power. Elsewhere, however, offshore wind is booming. Europe is only expanding its plans. China is steadily dominating the industry. And East Asian countries such as South Korea and Taiwan are expanding their sectors.
Now two of the richest countries in the Turkic world are laying plans for more offshore turbines. Turkey announced plans this week for its first offshore wind tender in the first quarter of 2027, Renewables Now reported. Azerbaijan, meanwhile, this week formally designated a 275-square-mile section of water in the Caspian Sea for offshore wind development, per offshoreWIND.biz. The moves highlight the extent to which the U.S. government stands alone in its view that offshore wind has no role in a modern electricity mix. Turkey, after all, is doubling its domestic production of gas and completing its first nuclear plant. Azerbaijan is famously rich in natural gas and produces a decent amount of hydropower. Yet both countries are still charging ahead on offshore wind.
Deep-sea mining isn’t yet technically legal in international waters. But the Trump administration isn’t waiting, creating the regulatory frameworks for domestic approvals and opening the area around one of America’s Pacific territories to exploration. Japan has been eager to follow suit. Now Washington and Tokyo are planning to meet “centuries’ worth of industrial demand” by establishing what Mining.com called the world’s deepest undersea mine in a bid to take on China’s mineral dominance. The mineral extraction would take place more than 1,000 miles southeast of Tokyo on an uninhabited speck of land called Minamitorishima, where Japanese scientists carried out tests pulling rare earths out of mineral-rich mud.
China is actively building more reactors at home than all other countries combined and singlehandedly restarted the race for novel technologies after hooking the world’s only commercial high-temperature gas-cooled reactors up to the grid in 2023. So far, Beijing’s two state-owned nuclear companies have remained focused on building light water reactors. Just one new high-temperature gas-cooled unit, designed to have more than twice the output of the first version, is currently underway at a facility where the fourth-generation, helium-cooled technology will be paired with third-generation, water-cooled reactors. Now the developer, the China National Nuclear Corporation, has made plans to procure a contract for the reactor for the first time, laying the groundwork for future deals to purchase units specifically designed to reach high temperatures. The “first concrete” for the plant is expected to be poured by the end of 2026, World Nuclear News reported.
Investment in zero-carbon energy and transportation surged this spring, driven by consumer EV and battery buying.
This is an edition of Heatmap Daily, an evening review of the day’s news written by our executive editor. Sign up for it here.
Ready to be surprised? Clean energy and transportation investment surged in the second quarter of this year, rising to more than $75 billion in total, according to new data released earlier this week.
In fact, this spring was the second biggest quarter for U.S. clean investment in nominal terms since at least 2018, when data started to be kept. More than 5% of overall investment in the United States went into a clean energy or transportation industry.
That’s according to the Clean Investment Monitor, a joint project of the MIT Center for Energy and Environmental Policy Research and the Rhodium Group, a private research firm. The monitor tracks nationwide investment across a number of sectors that make up the new electricity economy, including critical mineral refining, battery manufacturing, solar and wind installation, and electric vehicle and heat pump purchases by consumers (among other variables).
Outside of a promising headline number, the story is a mixed one. Investment in America’s clean manufacturing sector started growing again last quarter after falling for 18 months; it remains about 24% below where it was a year earlier, according to the project. The new growth came overwhelmingly from investment in the EV supply chain — defined as “critical minerals, batteries, vehicle assembly, and charging equipment” — driving a staggering 88% of all clean manufacturing investment. That subsector alone made up more than 9% of all U.S. clean investment.
The more interesting story — and what leaps out from the chart — is that retail activity drove the spring resurgence. High gasoline prices helped here, pushing consumers to buy all-electric and plug-in hybrid vehicles in larger numbers. (Rivian, Tesla, and other automakers started to see an EV rebound last quarter, too, after Republicans ended EV incentives in 2025.) But the real boom came in residential batteries, which surged to an all-time high of $11 billion in quarterly sales. Consumer activity hasn’t made up such a large share of national clean investment since 2023.
This trend wasn’t just happening in the United States. We’ve talked a lot at Heatmap about whether the Strait of Hormuz crisis will drive a clean energy boom. But it's now clear the oil price shock really did encourage global EV adoption. Some 50 countries set new EV sales records in 2026’s second quarter, according to Kelley Blue Book. India, Brazil, and Australia all set record highs. That's a lot of demand destruction.