The Wikipedia article for “wildfire” has 22 photographs, including those of incidents in Arizona, Utah, Washington, and California. But there is not a single picture of a fire in the American Southeast, despite researchers warning that the lower righthand quadrant of the country will face a “perfect storm” of fire conditions over the next 50 years.
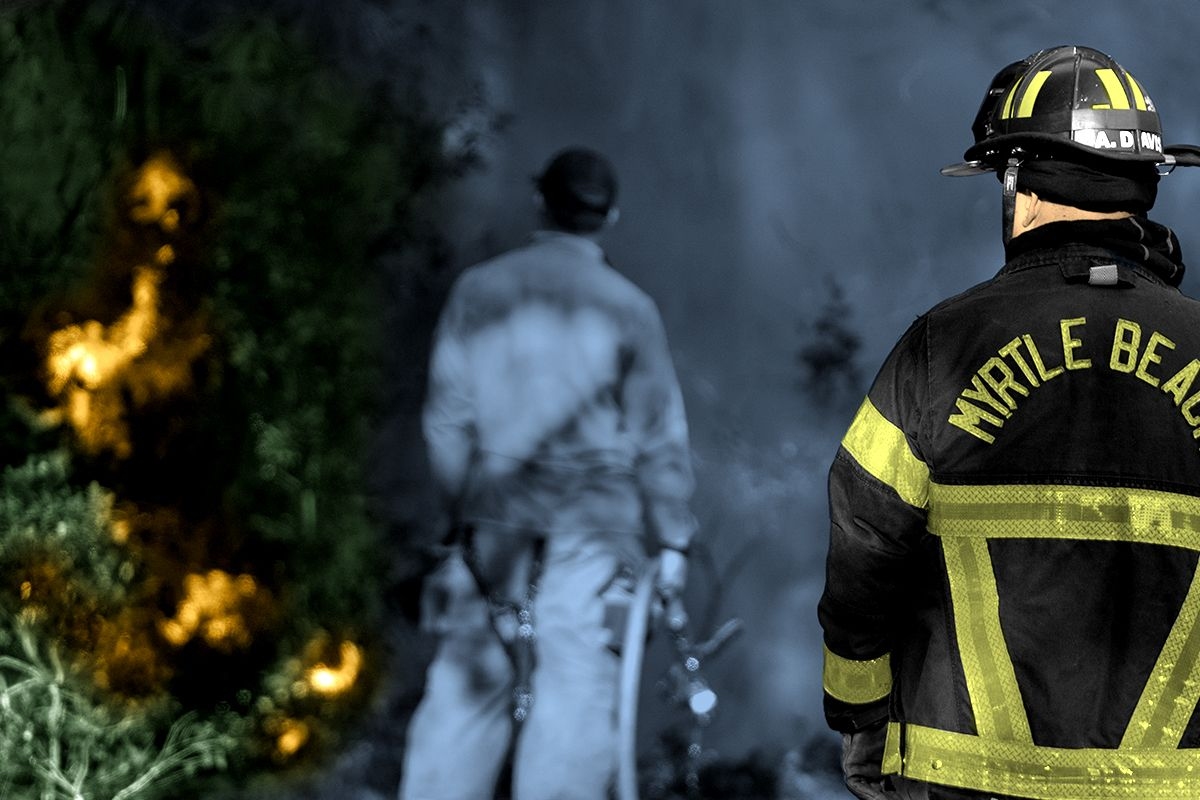
In what is perhaps a grim premonition of what is to come, several major fires are burning across the Southeast now — including the nearly 600-acre Melrose Fire in Polk County, North Carolina, a little over 80 miles to the west of Charlotte, and the more than 2,000-acre Carolina Forest fire in Horry County, South Carolina. The region is also battling hundreds of smaller brush fires, the smoke from which David Wear — the land use, forestry, and agriculture program director at Resources for the Future — could see out his Raleigh-area window.
Wear is also the co-author of a study by RFF and the U.S. Forest Service that came out in late 2024 and singled out the Southeast as facing a “particularly worrisome” rise in wildfire risk over the next half-century. I spoke with him this week to learn more about why the Carolinas are burning and what the future of fire looks like for the region. Our conversation has been edited and condensed for clarity.
When discussing fires in the American West, we often talk about how historic suppression efforts are responsible for the megafires we see today. What was the historic fire regime like in the Southeast? What’s going on to make it a hot spot for wildfires?
First, there are the similarities. Both Western and Southeastern forests, especially pine forests, are fire-adapted systems; they need regular fires to maintain health. Anything that takes those forests out of balance is a problem, and fire suppression is an issue in the East and the West, and especially in the Southeast. But forests in the Southeast are the most heavily managed forests in the country — perhaps in the world. In many cases, they’re regularly burned; the South does more prescribed burning than the rest of the country combined. It’s a very, very common practice in this part of the world.
So we shouldn’t be surprised that there is fire in Southeastern forests. There have been big, episodic fires in the South, though they’re not as common. There was the fire in 2016 in East Tennessee, from the Smokies into Gatlinburg, with a number of fatalities and lots of structures damaged or destroyed. There have been big fire years in east and west Texas. And there have been big fire seasons in Florida, though it’s been a while.
How is population growth in the Southeast adding to the strain?
We’re accustomed to talking about the wildland-urban interface in the West, but it’s also a big issue in the Southeast. Some of our urban growth centers in the Southeast include the Raleigh-Durham area, where I live, and Atlanta, Nashville, and Florida. These are generally flat landscapes, as well as very heavily forested landscapes. As the population grows out of the city centers, they go into pine and mixed-pine hardwood forests that are fire-adapted ecosystems. Then you have interspersed communities with forest vegetation, and that’s a big issue.
I also read in your report that much of that land is privately owned, which makes management tricky.
Private ownership is about 89% of forests in the South. [Editor’s note: By comparison, only about a third of forests in the West are privately owned.] Even where you have public ownership, a lot of that is by the Department of Defense and concentrated in a couple of different areas in the Ozarks and southern Appalachians. Much of the landscape in the coastal plain and Piedmont — which is most of the South — is predominantly private ownership.
There’s a distinction to be made between commercial owners, like timber investment management companies or real estate investment trusts, who actively manage landscapes. With timber harvesting, there are a lot of risk mitigation activities and a lot of prescribed burning. But then you have over a million non-industrial private landowners with small holdings. If you’re trying to coordinate any kind of wildfire mitigation scheme using fuel treatments and the like, it requires some work.
Horry County, South Carolina, and Polk County, North Carolina, were not part of your paper’s list of counties vulnerable to wildfire. I’m curious if you think what we’re seeing now says something about the limits of the study and the data you had available, or if you have another takeaway about what’s going on.
Importantly, our study looked at long-term averages. Throughout the South, there is a fire regime, and in any given year, it is possible to have wildfires of consequence. I would point out that we were especially concerned this year because Hurricane Helene laid down an awful lot of trees and created a fuel load.
We’re also entering one of the two fire seasons in the South. Wildfire is most predominant in the spring and in the fall; it’s at those times when temperatures begin to rise but humidity remains low, and there are extended dry periods that allow the fuels to dry out. You have warm temperatures and wind in the spring, setting the stage for wildfire. Typically, that window will begin to close at the end of April because it’s pretty darn humid in the South at that point, and it’s much less likely that fuels will get dry enough to carry a fire.
The same thing happens in the fall: Temperatures may remain high, and if we don’t have a lot of precipitation and humidity — usually in October and into November — then you have the conditions right for fire. But as the climate shifts, we see the length of those seasons growing to the point where the fall is approaching the spring. Wildfires in January and February indicate that these two seasons are growing toward one another and providing a much longer season. Our paper showed that, when you account for climate change across all of those global climate models and representative concentration pathways, the windows for more wildfire activity and more intense wildfire activity are expanding.
Your paper cited wildfire risks across the Sun Belt. Today, the National Weather Service is warning of “potentially historic” fire conditions in central Texas. Can local emergency managers use your modeling to prepare for such situations?
Things like the year-to-year fire projections and the day-to-day forecasts best serve local emergency managers. Wildfire in the South is determined by the drying of fuels and temperature and humidity conditions, which vary daily. If we look over the last week, Saturday was beautiful in the Carolinas. It was sunny, in the 70s, dry, and a little windy. That was the day [hundreds of] fires started across the Southeast. And the next day, there were very few new fires. Mid-week projections of wildfire potential in the Southeast show that it’s really low, with the exception of Texas. It changes day to day, driven by fine-grain weather forecasts, and that gives emergency managers some insight into where they might want to pre-position crews or do pre-suppression activities.
What we’re doing with the modeling is asking, What is this going to look like in 50 years? The takeaway is that wildfire activity is going to remain strong and perhaps grow in the West, but the big structural change is really strong growth and active fire in the Southeast, where you have wildfire and wildlands proximal to millions of people and more vulnerable communities. It’s a fire regime that’s going to affect more people.
I also wanted to ask about the USDA Forest Service’s contributions to your paper. Do you think research like this could still happen today, given the Trump administration’s efforts to eliminate anything climate-related from the federal agenda?
I came to Resources for the Future six years ago after a long career with the Forest Service, so it’s hard for me to remain a dispassionate scientist here. I think we need to see how the dust settles. It’s hard to imagine a future where the agency and federal government do not have a high level of concern regarding fire — and I don’t think you can do any kind of effective planning, or thinking about the future, or targeting of activities without understanding how climate is likely to impact these disturbance regimes.
I don’t have the crystal ball that many people are seeking right now. We’ll have to wait to see. But our research demonstrates the vital role of understanding climate dynamics, and it shows how critical weather forecasts are for people with boots on the ground who are trying to stay ahead of disaster.
Editor’s note: This story has been updated to reflect that about a third of land in the West is privately owned, not publicly owned.


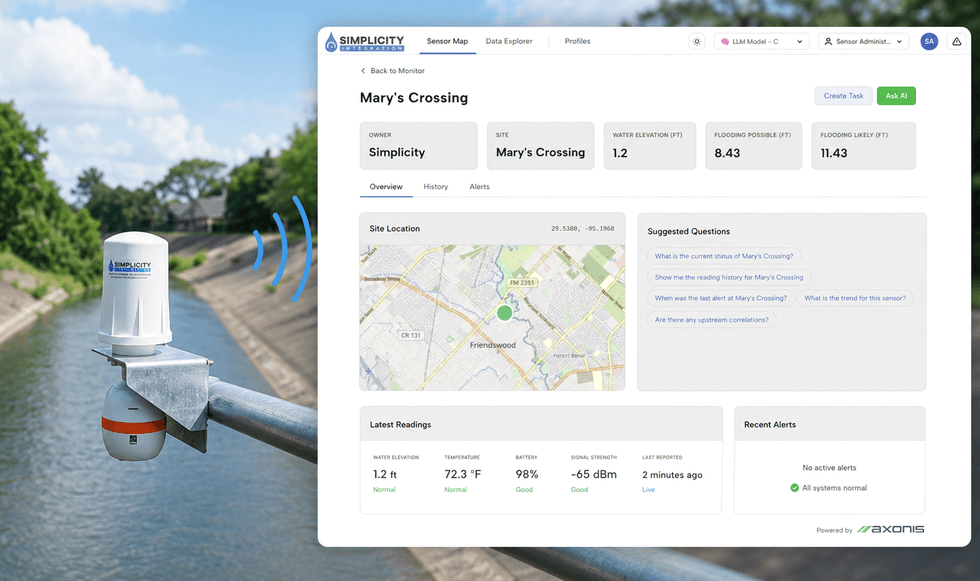 Axonis/Simplicity
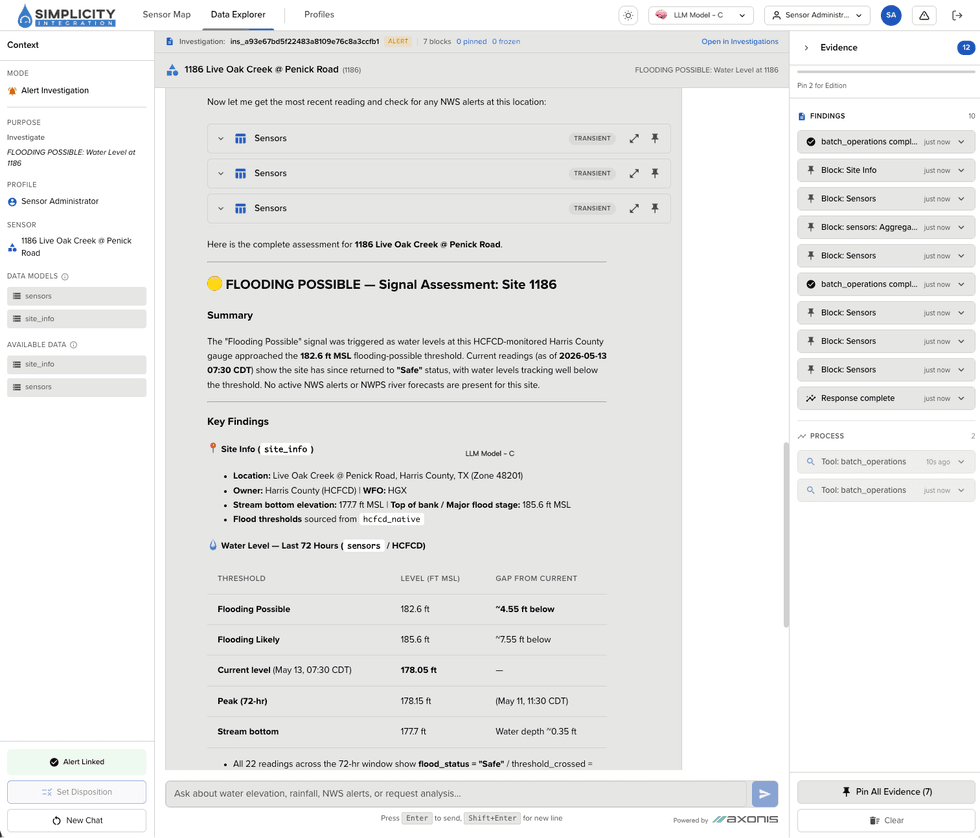 Simplicity


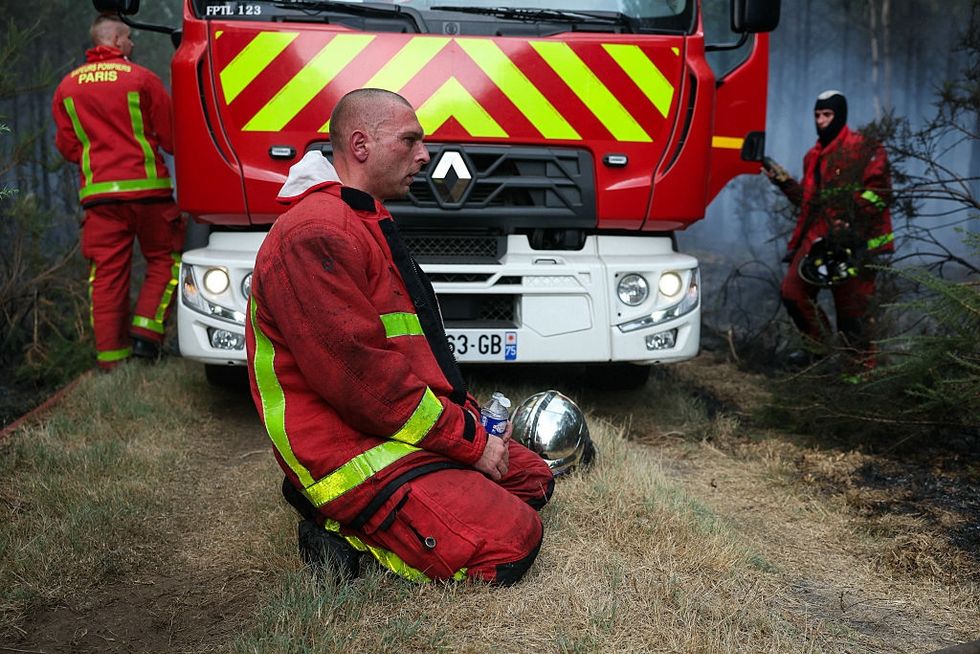 French firefighters near Bordeaux on Sunday. ALAIN JOCARD / AFP via Getty Images