You’re out of free articles.
Log in
To continue reading, log in to your account.
Create a Free Account
To unlock more free articles, please create a free account.
Sign In or Create an Account.
By continuing, you agree to the Terms of Service and acknowledge our Privacy Policy
Welcome to Heatmap
Thank you for registering with Heatmap. Climate change is one of the greatest challenges of our lives, a force reshaping our economy, our politics, and our culture. We hope to be your trusted, friendly, and insightful guide to that transformation. Please enjoy your free articles. You can check your profile here .
subscribe to get Unlimited access
Offer for a Heatmap News Unlimited Access subscription; please note that your subscription will renew automatically unless you cancel prior to renewal. Cancellation takes effect at the end of your current billing period. We will let you know in advance of any price changes. Taxes may apply. Offer terms are subject to change.
Subscribe to get unlimited Access
Hey, you are out of free articles but you are only a few clicks away from full access. Subscribe below and take advantage of our introductory offer.
subscribe to get Unlimited access
Offer for a Heatmap News Unlimited Access subscription; please note that your subscription will renew automatically unless you cancel prior to renewal. Cancellation takes effect at the end of your current billing period. We will let you know in advance of any price changes. Taxes may apply. Offer terms are subject to change.
Create Your Account
Please Enter Your Password
Forgot your password?
Please enter the email address you use for your account so we can send you a link to reset your password:
The Northeast is in the middle of its first true blizzard in years. That long gap wasn’t because of climate change, though.

Happy blizzard day, Northeast. While you might be (okay, or most definitely are) sick of the snow at this point, take comfort in the fact that this storm is different. It meets the definition of a true blizzard, in which a large amount of snow falls with sustained winds over 35 miles per hour and visibility reduced to less than a quarter of a mile for more than three hours. That’s a mouthful, all of which is to say: Complain away! You’ve earned it!
New York City hasn’t issued a true blizzard warning since 2017 — but that isn’t because of climate change. In fact, big, bad storms like this one might be getting even worse.
I spoke with Colin Zarzycki, an associate professor of Meteorology and Climate Dynamics at Pennsylvania State University, on Monday morning about what we can expect from winter storms in a warming climate. Our conversation has been lightly edited for clarity, and the snow-weary should proceed with caution.
I've read both that blizzards will increase in a warming world because the atmosphere can hold more moisture to make more snow, and also that, because it’s warmer, a lot of the precipitation will fall as rain instead of snow, so the storms will decrease. What does the research actually say?
Let’s back up for one second. Blizzards like we have in the Northeast today are a subset of nor’easters. We also call them mid-latitude or extra-tropical cyclones — you hear people talk about “low pressure,” “bomb cyclones.” At the end of the day, these are synonyms for storms that track up the East Coast of the U.S. and dump a lot of snow, particularly along the major metro corridor.
A blizzard is a special subset, where you have strong winds that blow the snow around. And that’s really problematic, because — have you experienced a lot of snowstorms?
I went to college in Vermont and lived in New York City for 10 years, so I’m familiar with snow.
I ask because, every once in a while, you talk to someone from, like, Miami, and they’re like, “I don’t know what you’re talking about.” But during these strong wind events, blowing snow reduces the visibility. That’s very bad for transportation like aviation, but also just driving on highways and roads.
I want to be careful, because there’s been less work done on the wind side of things. The broad consensus is that if you measure nor'easters as a function of their low pressure — which is somewhat analogous to wind speed; they’re not exactly related, but they’re pretty close — there actually doesn’t seem to be a huge shift. For every storm that comes up the East Coast and turns into a bomb that’s blowing 80-mile-an-hour winds, the distribution of the wind looks pretty similar across different climates, whether cooler or warmer.
What you’re referring to about the precipitation: — this is the thing we’re most confident in the science [of]. If you make the very simple argument — which admittedly, our models indicate it is not a bad argument — that if the number of nor’easters that move up the coast stays relatively constant and the intensity of them doesn’t change a lot as measured by wind speed, but if the atmosphere is warmer and can hold more water vapor, then the rates of what’s coming out of the sky essentially increase.
Now if you’re thinking, “Okay, well, that’s snow,” then yes. If you could take this storm and put it in a time machine and move it 50 years from now, and if the atmosphere is 2 degrees [Celsius] warmer, then you’re going to have more precipitation coming out of the sky, all other things being equal.
But you mentioned the other tricky thing that complicates life. When climate scientists think about precipitation in, let’s say, Florida, where it doesn’t snow at all, it generally all just goes one way: It gets warmer, it rains harder. But in the Northeast, we have two things that compete with each other. On the one hand, precipitation increases, as we just discussed. But then obviously, if it warms, more of these storms are likely to produce rain rather than snow.
If you look at just the average number of snowstorms in a warmer world, whether you’re comparing today relative to 1850, or if you’re looking at today and trying to figure out what’s going to happen in 2100, in general, the warmer it gets, the less total snow and the less total number of snowstorms because more of them become rainstorms. The tricky thing is, the decrease really only happens with the weaker snowstorms, the nuisance types.
So if we still get periods in warmer climates where it’s cold enough to snow, and now we’ve turbocharged the atmosphere’s ability to hold moisture by warming, then what we’ve actually done is make it so that when it does snow, it snows harder. In general, we expect to see fewer overall snowstorms when it’s warming, which is very consistent with what we’ve seen in observations in the Northeast U.S. If you look at any major metro area and you plot snow since 1950 it’s generally been on a downslope. But these big blizzard-type storms aren’t going away.
The jury is out as to whether the most, most, most, most extreme snowstorms become a little more extreme. But the big take-home message is that the frequency of big nor’easters isn’t going away, even if the climate warms.
There has been a lot of talk about this being the first blizzard to hit New York City in nine years. I don’t think I can remember a storm quite like this from when I was living there. Is that because this is the most extreme version you’re referring to, that we haven’t seen as often?
If you were to ask someone who has lived in New York City since the 1950s, they would probably tell you that this is a bad snowstorm, but that they’ve seen similar ones. I’m not an expert on the history of New York City weather, but there were a couple of big storms, I think, in the 1970s that were analogous to this, if not a little worse.
What is unique about this storm is that we really haven’t seen one of these tight coastal blizzards this year. We had that storm that came through earlier this year, which also brought a decent amount of snow to New York, but it tracked across the country rather than forming right off the coast and moving up that direction. This one is dragging snow across New York City and Boston; it’s a very classic Northeastern U.S. blizzard.
I think the main aspect is that we have been in a period of luck. We haven’t had these storms as frequently in the past. Some of it goes to that kind of dice-rolling thing with the temperatures. But if you look over the last 10 years, I would assume it’s not that New York City has been nice and sunny and calm in the winter. It’s that you’ve had these wintertime cyclones, but it’s been a lot more rain, or wet, rainy, sleety snow. It hasn’t been cold enough air to really lock in the blizzard conditions.
My understanding is that blizzards are specific atmospheric events in which the wind speed must exceed 35 miles per hour and visibility is limited. How difficult is that to capture in the data? I know from my reporting on tornadoes that it can be really difficult to capture wind events. How do you study this?
The fancy word in climate science is “compound extremes,” and a blizzard is a form of a compound extreme where you have multiple hazards at the same time. Add one layer on top of another, and the more there are, the harder it is to get information out of the data.
Especially in densely populated areas like the Northeastern U.S., blizzards are fairly tricky to look at. When you read the National Weather Service’s definition of a blizzard, it’s like, “It has to be snowing, and you have to have sustained winds, and you have to have decreased visibility.” All of those mean you’re adding layers of complexity to the data.
Tornadoes are a little similar; they’re a discrete phenomenon, and you need specific ingredients to all line up, and there’s also an observation problem. It’s somewhat analogous to blizzards: I could be at JFK Airport in New York, which is right on the ocean. There’s not a lot in the way to slow down the winds. Especially if you have drier snow, it’s very easy for it all to blow around. If I’m a guy working at JFK, I’m saying, “This is really bad, it’s really windy, the snow is coming down, and we can’t see anything. We have to shut everything down.” But put yourself in Midtown or somewhere where you’re surrounded by buildings and a little further away from the ocean, then suddenly the winds might be reduced because you have more obstacles that can slow it down. You’re experiencing the exact same storm, but the impacts are very different.
You said at the beginning that the underlying assumption is that nor’easters will continue at the same rate they’re happening now. Is there anything I should know about the way climate change is impacting those events?
Precipitation is the main thing. There’s been some work on the frequency and track of the storms, and we’ve seen small changes. But we also have a sample-size problem. The more you want to focus on the intense storms, the less you have in your records, and the more challenging it is to tease out what’s going on. That’s one of the reasons I really like models.
So maybe, if you squint, you can see some small changes in the frequency or the track, but it’s on the order of 5% to 10% per year. But the number of nor’easters we actually get in a given winter is not small; depending on how you want to classify it, it’s something like 10 to 15 any given winter. They don’t all produce a lot of snow; some of them go offshore, and if you’re sailing a boat in the middle of the ocean, then you’d be like, yeah, this is a big problem. But generally, we have very high confidence in understanding the precipitation, and decent confidence in understanding how the rain-snow partitioning changes. The winds, I think, are kind of an open question. But we’re talking secondary effects relative to the precipitation for all of them.
Is there anything else I should know about blizzards and climate change?
I do interviews every winter about bomb cyclones and big storms. The fact that I do multiple interviews a winter implies that the storms themselves are not anomalous. If you actually count them, you end up with a decent number. You just need the dice to come up snake eyes — all the ingredients need to line up for it to be something impactful. And that’s what’s happening now.
What climate change does is change the underlying probabilities and distributions. But at the end of the day, the main thing that actually drives what’s going on with these storms is, can the atmosphere put the Lego pieces together for these impacts? Every cyclone that we get during the winter, if you go back and look at the historical record, there’s plenty of evidence for these types of storms.
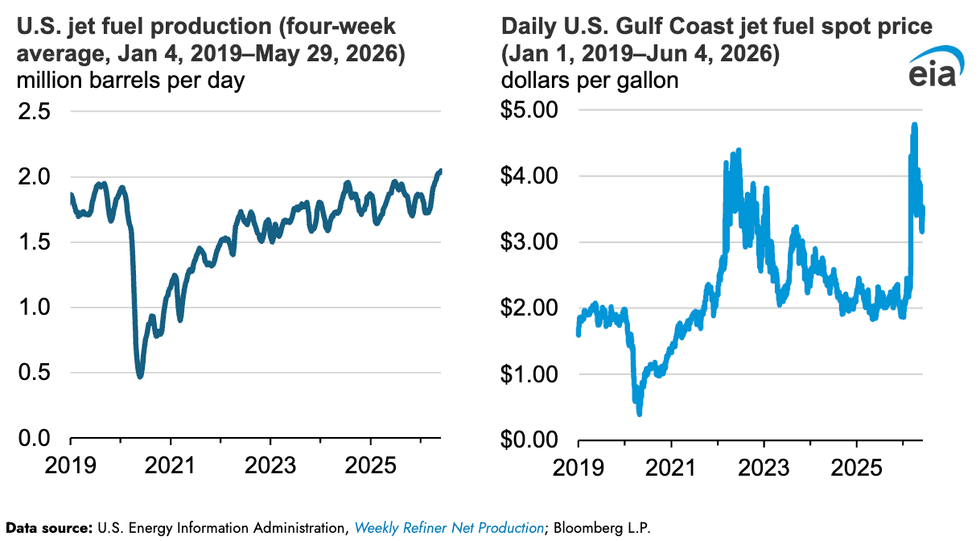
Log in
To continue reading, log in to your account.
Create a Free Account
To unlock more free articles, please create a free account.
Seattle practiced responding to a heat dome during the international soccer tournament. It didn’t go well.
Welcome to Seattle! If you’re one of the 750,000 visitors in town to watch the 2026 North American FIFA World Cup, you’re going to love it here. For one thing, you’ve arrived just in time for the city to suspend its interminable construction for the games. That’s a plus! Be sure to check out our newly pedestrianized Pike Place Market and stroll along the waterfront to “Seattle Stadium” (or sound like a local and call it “Qwest”). You might even get a little chilly from the wind off the bay — you can thank our “temperate, oceanic climate” for that. It’s what makes Seattle the safest place in the United States to attend (or play in) a World Cup game, per researchers at Queen’s University Belfast — at least, from the perspective of extreme heat.
That’s worth bragging about. Extreme heat has been a concern at almost every subsequent World Cup going back to the 2014 World Cup in Brazil, including the 2022 tournament in Qatar, which FIFA had to reschedule to the winter. The 2026 World Cup could get dicey, too. Of the 104 scheduled matches in 16 host cities in the U.S., Canada, and Mexico over the next month, at least half have a 50% chance or greater of being played in temperatures of 82 degrees Fahrenheit or higher, according to research by Climate Central — that being the threshold at which player performance begins to suffer, with athletes slowing down, getting sick, and making poorer decisions because of the heat. The odds of there being impairing heat during the World Cup final in New York on July 19 are basically a coin flip, and 17% higher than they otherwise would have been due to climate change-induced warming.
All of that is just part of what makes Seattle’s host city status so appealing. There is only about a 3% chance of performance-impairing heat during its two mid-June fixtures, rising to 6% later in the month and into July.
Unless, of course, there’s another heat dome.
In 2021, temperatures in Seattle peaked at 108 degrees on June 28, which this year will fall between when the city hosts Egypt vs. Iran and a Round of 32 match. Needless to say, 108 degrees is not just perspiration-inducing; it is well beyond the 89.6-degree wet-bulb globe temperature threshold at which FIFA considers postponing matches. While the possibility of another heat dome in the next few weeks is admittedly an edge case — before 2021, Seattle had only touched 100 degrees three times in 126 years of recorded-keeping— it’s still a realistic enough possibility that last spring, the National Weather Service’s Seattle office ran a tabletop exercise with its local partners to game out just that.
“Before 2021, heat [in Seattle] was just another hazard alongside fire and smoke and those sorts of things,” Reid Wolcott, the warning coordination meteorologist with the NWS Seattle, who helped lead the two-day-long run-through, told me. The heat dome “really highlighted that heat is a powerful hazard that can cause significant loss of life.”
After more than 400 people died in Washington alone, the NWS dedicated considerable time and resources to its heat preparedness and messaging in the Pacific Northwest. Beginning in 2022, the National Integrated Heat Health Information System began offering technical support for heat tabletop exercises in communities around the country. Seattle was supposed to participate in 2024 but “due to some logistical reasons, we ended up delaying it until 2025,” Wolcott said. “And because of that, we were like, We’re well on our way into World Cup planning, here.”
The idea of the “Heat Dome Cup” exercise was to kill two birds with one stone — to test the Seattle area’s response four years after the heat dome, as well as its ability to respond to a weather crisis when thousands of visitors are in the city for the World Cup. Participants included representatives from surrounding cities such as Bellevue, Everett, and Portland, Oregon; county-level offices including from climate, emergency management, and public health; the University of Washington; and the Port Gamble S’Klallam Tribe.
The results of the exercise were both encouraging and not: For every core capability tested, from “threat/hazard identification” to “communication” and “community resilience,” the after-action report found that Seattle “performed with some challenges.” There was “limited local data” on the compounding hazards of heat, cooling center efficiency, and — particularly alarming — the local healthcare system’s ability to respond during such an event. “Prehospital triage, surge planning, and better integration with public health systems are urgently needed,” the report found. Because paramedics attempt to bring down a heat stroke patients’ temperature before transporting them to a hospital — a laborious process often involving filling a home bathtub with ice, setting the patient in it, and waiting — the emergency response during heat events is slow, and can quickly back up and overwhelm the system.
Heat Dome Cup partners directed my questions about King County’s readiness to handle extreme heat during the World Cup to the public health office, which told me no one was available for an interview.
Carlos Martinez, a senior climate scientist with the climate and energy program at the Union of Concerned Scientists who did not participate in the exercise, told me that after reading the report, he hopes that “there’s a recognition and awareness of the fact that there’s a lot of work that needs to be done.” He also flagged an observation from the exercise regarding the development of stronger workplace protections during the World Cup.
“That sometimes can be neglected,” he went on. “You have folks in construction, food service, retail, landscaping, and sanitation who work a full day outside during these events. What are the protocols that are out there to ensure that they are protected from heat-related illnesses?”
I put the question to Hollie Stark, the communications coordinator for the Office of Emergency Management in Seattle. (While Stark’s office participated in the exercise, Stark did not.) She told me that Washington’s Department of Labor & Industries offers recommendations for how employers can protect their workers from heat and smoke, including running trainings and publishing posters and pocket cards in multiple languages that promote offering adequate water, shade, and breaks. “We’re thinking about maybe bars and places that might be hosting [FIFA viewing parties] that don’t have access to AC but might have an influx of people,” she said as a hypothetical, “and we’re encouraging them to listen to those recommendations.”
In general, the people I spoke with in Seattle who were involved in the exercise acknowledged that messaging and communication were the areas the city struggled with the most. “That has definitely been the single biggest thing — trying to make sure that we’re all singing from the same sheet of music,” Wolcott told me. “Because we weren’t prior to 2021.”
One of the biggest hurdles has been figuring out exactly how to communicate potential extreme heat warnings to the thousands of visitors traveling to Seattle. During my conversations with officials involved in the Heat Dome Cup, officials pointed me to myriad preparedness websites, real-time risk tools, opt-in alert systems, and health and safety resources for out-of-town visitors, which left me — a local fluent in English — feeling even more confused.
Language itself is one thing — on that front, Stark told me her office has already pre-scripted messaging for extreme heat translated into Spanish and the eight threshold languages of King County — Vietnamese, Somali, Russian, Chinese, Korean, Amharic, Arabic, and Ukrainian — as well as seven additional World Cup spectator-specific languages — Arabic, Farsi, Dutch, French, Bosnian, Serbian, and Croatian. But one of the threats of having a heat dome during a major sporting event is that “you have a lot of visitors coming from all different parts of the world,” Wolcott said. “Some come from locations where they are probably more acclimated to heat than we are, but some may be coming from areas that are cooler climates than ours.” Proper acclimation can take weeks, if not an entire season — far longer than most spectators will be in town.
But perhaps the biggest takeaway is that a heat dome isn’t required for people to be under heat stress, even in a place as temperate as Seattle. Wolcott told me the NWS’s seasonal outlook for the summer in the region indicates above-average temperatures, and while that “does increase the risk of a heat event occurring, it has nothing to do with the actual magnitude of it. You could have a 2021-level event, or you could have 30 smaller events, and there is no way to tell exactly what’s going to happen.”
Indeed, even fairly moderate temperatures can sneak up on spectators. While FIFA is in charge of making decisions that impact their athletes’ health, Shel Winkley, the senior engagement specialist and meteorologist at Climate Central, pointed out that “fans are still sitting in the sun in the heat, and if they’re fans like me, they’re not drinking water during [the FIFA-mandated in-game] cooling breaks.” Spectators get to the stadium early, stand in long lines in the sun, sit in crowded stadiums with potentially no shade — and essentially endure an entire day of heat, even if the temperatures seemed manageable when they walked out their hotel door.
At this point, there is nothing to indicate Seattle’s worst-case scenario will come true. (Stark also mentioned that a true worst-case scenario more likely involves the Big One than extreme heat, but we won’t go there.) But “just because historically the odds are low” for a heat dome in the Seattle area “doesn’t mean that they’re zero,” Winkley said.
Martinez, the climate scientist with UCS, stressed to me that while the Heat Dome Cup was an engaging thought experiment, bringing together 30 distinct partners for two whole days, he fears that a gutted NWS and Federal Emergency Management Agency might lack the funding or personnel to act on the weaknesses the exercise exposed. “If you have this one exercise but no follow-through, that can risk eroding trust by those populations who gave time out of their day to come and speak to the federal government about the importance of this issue,” he told me. “We shouldn’t just do this for well-renowned events. This should be an evergreen thing.”
But Wolcott, the lead on the Heat Dome Cup, sounded to me like he was at the end of a long marathon when I spoke to him. “I’ve been planning for [the World Cup] for three years now. I’m ready for it to be over,” he told me, laughing.
“We are always doing this; it was just one exercise that we did last May,” he added. “I’m just looking forward to late July at this point.”
Current conditions: Tropical Storm Cristina is inching north toward landfall in Central America, threatening floods, landslides, and winds of up to 73 miles per hour • Washington, D.C., is poised for rain for the rest of the week as temperatures rise to nearly 100 degrees Fahrenheit by Friday • By contrast, Cartersville, Georgia, where the solar manufacturer Qcells just started up its factory, is looking at a two-day break of sunshine from an otherwise gray and wet forecast.
At the start of 2023, South Korea’s biggest solar manufacturer, Qcells, began construction on a sweeping new factory northwest of Atlanta in Cartersville, Georgia. Betting that U.S. tariffs on Chinese solar panels were here to stay, the company gambled on bringing most of the supply chain under one roof. On Tuesday, Qcells started producing solar cells at the plant, marking what it called “a major milestone toward completing the country’s only vertically integrated solar manufacturing plant.” The firm expects to reach full production by the third quarter of this year. The factory’s module assembly line, meanwhile, is now at full capacity, building 16,700 panels per day. “Producing the first solar cells at Cartersville is a milestone for Qcells and for American manufacturing,” Andy Park, the global chief executive of Qcells, said in a statement. “As our ingot, wafer, and cell lines reach full capacity, we’ll be making the major components of a solar panel right here in Georgia.”
The U.S. could be seeing the start of a small solar boom. Last year alone, at least 30 new utility-scale solar factories came online, as Heatmap’s Emily Pontecorvo reported last month.
Over the weekend, as I told you on Monday, a federal court blocked the Trump administration’s rules for using the soon-to-expire tax writeoffs for investing in or producing electricity from solar panels and wind turbines. But with just 24 days to go until the tax credits officially end, few developers are likely to move quickly enough to benefit from the ruling. “Practically speaking, I don’t think this is likely to have much impact on the market or behavior in the coming weeks,” Heather Cooper, a tax lawyer at McDermott Will & Schulte, told E&E News. “The deadline is less than four weeks away.”
Investments into electrical grids are on track to surpass $650 billion globally this year, according to new data from the consultancy Rystad Energy. That’s up 5% from last year and more than double the investments recorded in 2020, PV Magazine reported. The high cost comes as long lead times and pricy components for transformers, high-voltage circuit breakers, and switchgears strain and stall upgrades and expansions to power systems all over the world. The soaring growth of wind and solar is propelling grid investments, which are needed to patch more intermittent and often far-flung renewables onto the system. In 2010, wind and solar made up just 2% of global generation. By 2040, Rystad expects them to make up nearly half the mix.
Sign up to receive Heatmap AM in your inbox every morning:
Everyone recognizes Canada as a major oil producer, metal miner, and hydroelectricity generator. But did you know the Canucks are not just a serious player in nuclear power, but actually have their own domestically-designed reactor that can run on raw uranium? Get this, it even has a catchy name: the CANDU. Pronounced CAN-do and short for Canada Deuterium Uranium, the pressurized heavy water reactors are among the only commercial designs in the world that can run on unenriched, natural uranium. The advantage, especially for a country like Canada with vast uranium deposits, is that they’re faster to build, cheaper to fuel, and free of the international scrutiny that comes with enriching uranium. The downside is that they break down faster than the light water reactors that make up the entirety of the U.S. fleet. But Canada is demonstrating that isn’t a big problem. On Monday, the Bruce nuclear power station brought its Unit 3 reactor back online, completing refurbishments seven months early and $107 million under budget, NucNet reported. You don’t need to know a lot about the American or European nuclear industries to know “early and under budget” aren’t words typically associated with any recent or ongoing projects.
The best-proven way to make truly green steel involves turning iron ore into direct reduced iron through a process that, when powered by green hydrogen instead of natural gas, significantly slashes any carbon emissions associated with its production. Assuming it’s finished off in an electric arc furnace, it’s green steel — and even greener if that final process was powered by renewables or nuclear. Yet despite some high-profile projects, green hydrogen has remained too expensive in the West, even as China’s industry starts to boom. That could be changing. On Tuesday, the German steelmaker Salzgitter inked its first major offtake agreement for green hydrogen from the supplier EWE, Hydrogen Insight reported. One of Germany’s largest steel producers, Salzgitter will buy roughly 10,000 metric tons of hydrogen per year from the electrolyzer plant EWE is building in Emden, near the Dutch border.
Meanwhile in America, U.S. Steel unveiled plans to invest up to $2.5 billion into upgrading the Mon Valley Works, southeast of Pittsburgh. The renovations come after Japanese steel giant Nippon’s takeover of the iconic American firm last year. To win President Donald Trump’s blessing, Nippon gave the federal government a “golden share” in the company. As Heatmap’s Matthew Zeitlin wrote last year, that could ultimately give a future administration leverage to press U.S. Steel to green its operations.

If you’re booking a flight right now, you might not yet be feeling the difference. But U.S. production of jet fuel has reached record highs as refiners scramble to respond to soaring prices following the closure of the Strait of Hormuz. By the start of May, the four-week average estimate of fuel production surpassed 2 million barrels per day for the first time on record, according to new analysis by the Energy Information Administration. But with domestic inventories still relatively high, much of that increased production is being exported.
Entech’s S2 platform debuted last year to help make century-old boilers more efficient.
Emissions from existing buildings are responsible for about 70% of New York City’s climate emissions, with space heating as the dominant source. Yet most of the city’s multifamily buildings still rely on central steam boilers that cycle on and off when the outdoor temperature drops below a certain threshold, regardless of indoor conditions. The result is a system that leaves many residents sweltering in the dead of winter, wasting fuel and money while releasing unnecessary greenhouse gases.
Completely overhauling and modernizing a central boiler system — many of which date to the early 1900s — and installing a building-scale heat pump could address many of these issues. But that’s an expensive, complex, and disruptive endeavor that many building owners either can’t afford or simply don’t want to undertake. And while heat pump startups such as Quilt and Gradient are making inroads in single-family homes and individual apartment units respectively, neither is working to optimize the operations of existing steam boilers, which remain the dominant heating source for New York’s apartment stock.
That’s where Entech, a 30-year-old building energy management company, comes in. The company’s platform has long used indoor sensors to monitor the performance of central boilers and help them run more efficiently. Last year, however, the company revamped its software to incorporate artificial intelligence. The new system, called S2, autonomously monitors 20-plus sensors installed throughout the buildings where it operates, adjusting heating cycles with greater precision while continuously tracking the overall health and performance of boiler room operations.
On Wednesday, the company announced the results from the S2’s first year of operations: Across 401 New York City apartment buildings, the platform slashed emissions by nearly 25%, avoiding more than 16,000 metric tons of carbon pollution and generating over $5 million in savings for property owners.
Previous iterations of the company’s tech relied on preset rules such as, “When it’s 55 degrees [Fahrenheit], you need a shorter cycle, and when it’s 20 degrees, you need a longer cycle,” Heather Zoberman, Entech’s director of product development, explained to me. Those settings dictated how long a boiler turned on and how long it stayed off. With AI, however, the company can measure how quickly individual units are actually heating up and adjust performance in real-time.
For a company that spent decades focused on incremental improvements to boiler operations, it’s a meaningful shift. “Now we have the ability to do flame modulation — so a higher flame, a lower flame— based on the load, based on the building temperatures,” Zoberman told me. The same level of granular control applies to the fans and pumps that move heat through the building, too. “A little bit slower fan, a little bit lower flame is really where you get those savings that add up,” she said. According to Entech, those savings are typically passed onto the residents, with the average tenant saving roughly $200 on heating costs last year.
While building owners are happy to see these savings too, many are turning to Entech primarily to comply with the New York City Council’s Local Law 97, which requires buildings larger than 25,000 square feet to cut emissions 40% by 2030 compared to 2005 levels, and reach net zero emissions by 2050.
The nonprofit housing developer and operator Breaking Ground, for example, builds supportive housing for low-income and formerly homeless New Yorkers, and has been doing so for decades. It adopted Entech’s new boiler control system just six months ago to comply with the emissions law. While Breaking Ground’s deputy VP of facility operations, Lorenzo Torres, didn’t have exact savings figures on hand, he said the system has saved the organization “a lot of money,” largely by enabling staff to remotely identify equipment issues such as leaks and temperature fluctuations without having to send anyone to the building and before they develop into expensive headaches.
“We do have a work order system, but data is only as true as the person that’s entering the data,” Torres explained. Thus if a tenant misidentifies an issue or fails to file a work order in the first place, Breaking Ground might assume everything is running efficiently. By contrast, “the S2 controller actually is able to, with conviction, let us know that there is an issue with the boiler,” he said.
What Entech’s system still can’t do is solve the problem of unit-level temperature variation. Factors such as floor level, window exposure, and radiator placement mean some apartments will naturally run hotter or colder than others. But because Entech primarily operates in apartment complexes with central boilers, it can still only make adjustments at the building level Because of this, its system could be a complement to something like a smart radiator, which can control how much heat each apartment receives.
Now, Entech is looking to expand beyond New York. Boston is a natural next market, Zoberman told me, given its stringent building emissions requirements. Chicago is also on the company’s radar, thanks in part to incentives from the natural gas utility People’s Gas, which can help offset the cost of energy efficiency upgrades. The company’s ambitions extend beyond just geographic expansion, however — it’s also broadening its platform to monitor and optimize central cooling systems and other electrified technologies such as heat pumps and mini splits.
It looks like it should have plenty of room to run. Additional jurisdictions from Washington D.C. to St. Louis are increasingly adopting hard caps on building emissions, while dozens more now require annual energy-use reporting — often a first step towards more stringent regulation.