You’re out of free articles.
Log in
To continue reading, log in to your account.
Create a Free Account
To unlock more free articles, please create a free account.
Sign In or Create an Account.
By continuing, you agree to the Terms of Service and acknowledge our Privacy Policy
Welcome to Heatmap
Thank you for registering with Heatmap. Climate change is one of the greatest challenges of our lives, a force reshaping our economy, our politics, and our culture. We hope to be your trusted, friendly, and insightful guide to that transformation. Please enjoy your free articles. You can check your profile here .
subscribe to get Unlimited access
Offer for a Heatmap News Unlimited Access subscription; please note that your subscription will renew automatically unless you cancel prior to renewal. Cancellation takes effect at the end of your current billing period. We will let you know in advance of any price changes. Taxes may apply. Offer terms are subject to change.
Subscribe to get unlimited Access
Hey, you are out of free articles but you are only a few clicks away from full access. Subscribe below and take advantage of our introductory offer.
subscribe to get Unlimited access
Offer for a Heatmap News Unlimited Access subscription; please note that your subscription will renew automatically unless you cancel prior to renewal. Cancellation takes effect at the end of your current billing period. We will let you know in advance of any price changes. Taxes may apply. Offer terms are subject to change.
Create Your Account
Please Enter Your Password
Forgot your password?
Please enter the email address you use for your account so we can send you a link to reset your password:
A tale of two coal economies, one post-industrial, one industrializing.
For those living near the Port of Baltimore, the transportation and storage of coal on its way from mines in the Appalachian Mountains to far-flung foreign kilns is “a mundane but ever-present imposition,” Chloe Ahmann, a Cornell University anthropologist, told me. Ahmann once worked as an elementary school teacher in Curtis Bay, a residential neighborhood adjacent to the working port, and wrote a book on the area’s post-industrial present.
“There are stories going back generation,” she said. “Coal dust covering everything in the neighborhood — bicycles, porches, windowsill. People wipe coal dust off their windows as a daily ritual.”
With the collapse of the Francis Scott Key Bridge and subsequent shutdown of the port, that coal now has nowhere to go for the foreseeable future. Baltimoreans don’t want it, but its intended recipients thousands of miles away in India most certainly do.
“The top recipient of U.S. steam coal shipped from Baltimore by far over the past five years has been India, where the brick manufacturing industry has been a major customer,” the U.S. Energy Information Administration said in a report on the impacts of the bridge disaster. In January alone, the Port of Baltimore exported almost a million tons of coal to India, up almost three-fold from January of last year, according to Argus, a commodity data provider. In total, 17 million tons of thermal coal — the type used in power plants and brick kilns — left the U.S. via Baltimore in 2023, S&P Global found by analyzing Census Bureau data.
India is the world’s second largest consumer of coal after China, and coal accounts for over 70% of India's emissions from burning fuel, according to the International Energy Agency. (In contrast, coal accounts for a fifth of the United States’ emissions from combustion.) About a quarter of India’s emissions come from industry, much of which uses coal in its processes, including steelmaking, and cement and, yes, brick manufacturing.
Brickmaking in India is often done on small scales by local producers, but even so, its energy consumption is “comparable to the organized construction industries such as cement and steel,” according to research published in Nature India. Many of those bricks are used to build homes, part and parcel of the country’s astounding economic growth. Along with its steel and cement industries, brickmaking has transformed India — whose inflation-adjusted per capita GDP of around $1,800 in 1990 would have made it one of the world's poorest countries today — into the third-largest carbon dioxide emitter in the world.
The same brick industry that produces the literal building blocks of India’s homebuilding sector is also responsible for immensely damaging particulate pollution. The combination of coal and biomass used to fire brick kilns is responsible for around 75 million tons of carbon dioxide emissions — comparable to the total emissions of Washington State, Arizona, or the 2021 California wildfires — and 100,000 tons of black carbon emissions, according to the Climate and Clean Air Coalition.
Air pollution in South Asia is one of the largest public health problems in the world. India, Pakistan, Nepal, and Bangladesh all ranked in the bottom 10 of 180 countries for air quality, according to the Yale University Environmental Performance Index. In 2019, air pollution was estimated to account for around 1.7 million premature deaths in India. “Brick kilns, involving the burning of low-grade coal, are one of the major sectors that contribute to air pollution in South Asia,” a World Bank report said, with the brick industry making up over 90% of particulate emissions in some South Asian cities and 15% of the most dangerous small particulate emissions in Delhi.
In a story that will be familiar to much of industrial and post-industrial America, these industrial processes are both an important economic engine and an obvious detriment to health locally and are contributing to the climatic changes that are already having devastating effects in South Asia. Efforts to regulate the brick industry have already run into complaints that efficiency requirements will be too expensive for cash-strapped businesses and will result in lower employment in the sector.
In the vertiginous world of globalized capitalism, different regions using the same resource — the Appalachian coal mines, the Baltimore port, and the Indian brick manufacturers — can all at the same time be at different stages of industrialization and post-industrialization, with differing attitudes toward the coal that powers and pollutes them. In South Baltimore, the people living with the dust from the coal pier no longer sees any positive relationship between industrial activity and their own well-being, Ahmann told me.
The Baltimore and Ohio railroad, which has been part of the rail conglomerate CSX since 1980, began construction in 1827 and has long shipped coal from West Virginia and other Appalachian states to the East Coast. Baltimore’s Curtis Bay neighborhood, where Ahmann lived, is adjacent to a coal pier operated by CSX. “It’s an iconic local scene, right by a local playground, stone throw from several elementary schools and homes,” Ahmann said, making the neighborhood both “heavily industrialized and very much a lived-in place.”
While the Maryland government trumpets direct and indirect employment at the port of around 15,000 people, that’s about half the number that worked there in 1970.
“It’s no longer the case that industry is a major employer in South Baltimore,” Ahmann said. “It’s not like it was 40 years ago, when everybody knew somebody whose livelihood was attached to industrial production in this place.” Instead, people in the area “cobble together lives from low-wage service jobs,” she said. Overall, manufacturing employment in Maryland has been roughly cut in half since 1990.
In late 2021, a CSX coal facility in Curtis Bay exploded, damaging nearby homes and spreading tremors for miles. Following the blast, a coalition of community groups and the Maryland Department of the Environment investigated particulate pollution in Curtis Bay and found coal dust “present throughout the community,” with coal dust coming from the terminal itself, as well as train and truck traffic.
“We should not have open air coal piers period, and certainly not in a residential area behind a playground,” Ahmann said.
Among the many fears locals are nursing as the Key Bridge lies in ruins is that the coal will simply pile up at the port as long as it remains blocked. “These piles are going to grow every day,” Ahmann told me, describing it as “stark visual evidence of the untenability of this situation.”
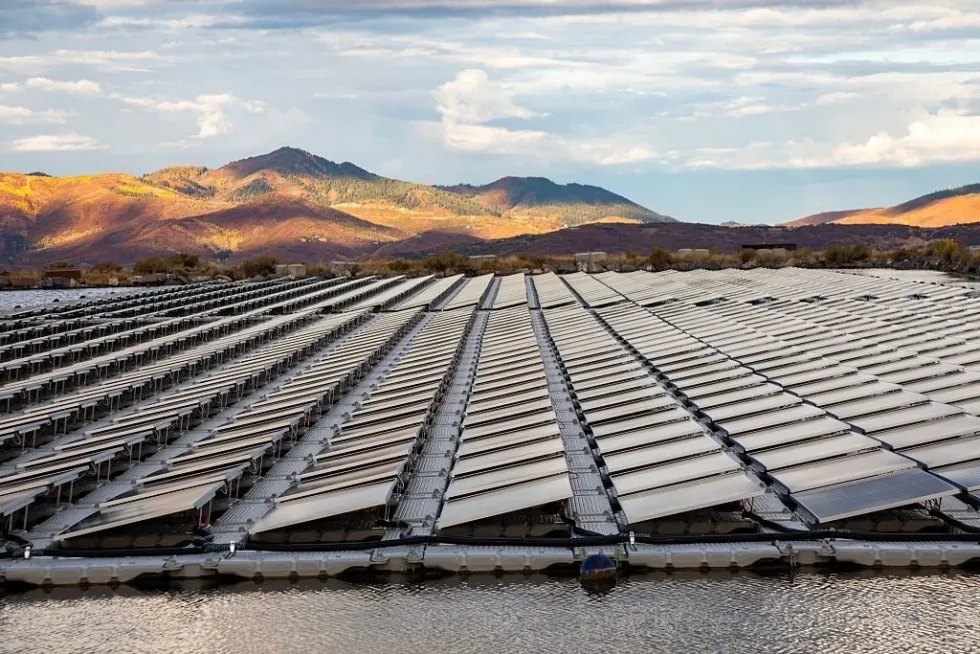
Log in
To continue reading, log in to your account.
Create a Free Account
To unlock more free articles, please create a free account.
Some simple charts show there’s no real relationship to speak of.
Electricity prices are going up at about twice the rate of inflation. This is becoming a political problem for anyone currently in power, including President Donald Trump.
“Any State that has built and relied on WINDMILLS and SOLAR for power are seeing RECORD BREAKING INCREASES IN ELECTRICITY AND ENERGY COSTS,” the president posted Wednesday on Truth Social, calling these renewables “THE SCAM OF THE CENTURY!”
But … are they? Is there a clear relationship between the spread of renewable energy and electricity prices at the state level, let alone one that’s driving up prices?
In a word, no. Here is a chart of average electricity prices in all 50 states compared to how much of their electricity they get from renewables.
There is, if anything, a slight negative correlation between renewables penetration and electricity prices, but as you can see, the dots are all over the map.
In fact, in some of the states with the highest level of renewables, prices have either risen more modestly than average or even fallen, as is the case with North Dakota. The state formerly governed by wind-hostile Secretary of the Interior Doug Burgum has seen its average electricity price fall to just over $0.08 per kilowatt-hour in May of this year, from $0.09 in May, 2019; meanwhile 36% of the state’s electricity comes from wind, the sixth-highest percentage in the country, according to Energy Information Administration data.
In Iowa, the state with the most renewables usage (again, thanks to wind), the average electricity price in May was just over $0.09 per kilowatt-hour, compared to just below the same level in May 2019.
But let’s expand the aperture out a little further. Have the states with more renewables on their grids experienced faster than average growth in electricity prices?
Again, no, and if anything slightly the opposite. “Many of the states with the largest increases in wind and solar generation since 2010 — including Iowa, New Mexico, Kansas, and Oklahoma — have seen rates rise slower than inflation,” according to research from Energy Innovation. You can see the relationship in this chart.
It’s true that both California and Maine, which are outliers in terms of electricity price increases, also get more than the national average share of their electricity from renewables.
In California, most of that rise comes down to costs related to wildfires, which also drove the utility PG&E into bankruptcy in 2019. And while many Mainers have blamed the state’s solar incentives for rising bills, an examination by Canary Media found that natural gas price volatility had more of an impact. Typically, states near the edge of or isolated from larger energy networks — including California and Maine, but also Hawaii, Alaska, and certain other New England states — have the highest electricity prices, regardless of how much renewable energy they have on the grid.
But make no mistake, prices are rising all over the country. The U.S. average electricity price has gone up by around 27% in the past six years, from around 10-and-a-half cents per kilowatt-hour in May 2019 to more than $0.13 this year. The biggest surge happened in 2022, when average electricity prices jumped from $0.11 per kilowatt-hour at the end of 2021 to well over $0.13 by the following August. Electricity prices have risen 5.5% in the past year alone, according to the Bureau of Labor Statistics, while overall prices have risen 2.7%.
If you’re trying to explain why electricity prices have risen, the answer, my friends, is not blowing in the wind — or shining in the sun, or anywhere else, for that matter. The real reason involves a host of factors, as my colleague Robinson Meyer explored earlier this week. Top of the list is the physical reality of the grid itself – which, yes, includes some costs associated with the buildout of renewable energy and the transmission infrastructure required to get it to customers, but is mostly related to local distribution, i.e. bringing power to people’s homes. Beyond that, extreme weather, natural gas prices, and data center-induced demand growth all play a part.
Whatever the reason for the rise in prices, though, it’s not good for Trump, who promised during the campaign that electricity prices would go down by half during his first year in office. Halfway through, things do not look promising, with more price hikes likely on the horizon.
Secretary of Energy Chris Wright acknowledged the present-tense price increase earlier this week when asked about rising prices. “And who’s going to get blamed for it? We’re going to get blamed because we’re in office,” Wright told Politico.
Wright’s comments have put some pep in the step of a beleaguered renewables industry. “When government officials start PR campaigns claiming something is not their fault … It’s their fault. Obstructing the fastest growing source of American power during a period of high demand is going to hurt consumers,” Jason Grumet, the head of renewables trade group ACP, wrote on X Wednesday.
Despite it all, renewables and storage make up the vast majority of planned new generation in the U.S. More than half of the 64 gigawatts of capacity planned to be added to the grid this year will come from solar, according to recent EIA data, with 18 gigawatts coming from battery storage and 8 gigawatts from wind. If recent history is any guide, any electricity price hikes we see going forward won’t be the fault of that new generation.
With data assistance from Charlie Clynes.
On copper chaos, a solar surge, and transformer hopes
Current conditions: Hurricane Erin is generating waves up to 6 feet high in North Carolina as the storm brings dangerous riptides up the East Coast • Heavy rainfall is causing deadly landslides and flooding in Senegal • Isesaki, northwest of Tokyo, is sweltering in temperatures above 100 degrees Fahrenheit as a heat wave that already broke records this month persists.
Mikie Sherrill, the Democratic nominee for governor in New Jersey, pledged Wednesday to build a new nuclear plant near the Delaware border in Salem County. At a press conference, the sitting U.S. Representative vowed to “massively expand cheaper, cleaner power generation” and build “an energy arsenal in our state.” That could mean building one or more Westinghouse AP1000s, the gigawatt-sized old-fashioned reactor for which the local utility giant, PSEG, already has early site permits from the Nuclear Regulatory Commission. “I’m going to immediately develop a plan for a new nuclear power site in Salem County,” Sherrill said at a rain-soaked press conference in Kenilworth, a suburb on the north end of the state outside New York City. “It demands urgency.”
The proposal will face challenges. The U.S. hasn’t built any new commercial nuclear plants in states where the grid is managed by regional transmission organizations that formed following a deregulation push in the 1990s that broke up traditional electrical monopolies. New York Governor Kathy Hochul announced plans in June to build her state’s first new nuclear plant since the 1980s, but has a tool New Jersey lacks: the New York Power Authority, the nation’s second-largest government-controlled utility after the federal Tennessee Valley Authority. In that sense, as Heatmap’s Matthew Zeitlin wrote, New York’s plan mirrors the TVA’s own nuclear ambitions. Even if Sherrill finds a surprise fix to finance a new nuclear plant, she said she expects to face difficulties just dealing with the PJM Interconnection, the nation’s largest power system, of which New Jersey is a part. If elected, she said she will “instruct our attorney general to take on our grid operator.”
The chief executives of mining behemoths Rio Tinto and BHP met with President Donald Trump to push for a long-stalled joint copper mine. In a post on LinkedIn, Rio Tinto CEO Jakob Stausholm said he “highlighted the opportunity at the Resolution Copper project in Arizona” and cheered “BHP’s CEO Mike Henry as we outlined the enormous potential of this project to provide domestic copper and other critical minerals for decades to come.”
The project has faced recent troubles. On Monday, the 9th U.S. Circuit Court of Appeals issued a temporary restraining order to prevent a transfer of land to the mining giants as the court considered challenges brought by opponents including the San Carlos Apache Tribe, which wants to block the mine on religious, cultural and environmental grounds. (Here’s Heatmap’s Jeva Lange with a deep dive on the fight’s long history.) Following the meeting with executives on Tuesday, Trump posted on Truth Social: “It is so sad that Radical Left Activists can do this, and affect the lives of so many people. Those that fought it are Anti-American, and representing other Copper competitive Countries.”
Solar power, in dark blue, dominates new generating capacity in the U.S. this year. EIA
Developers added 12 gigawatts of new utility-scale solar power capacity in the U.S. in the first half of 2025, and plan to add another 21 gigawatts by December. If that all comes to fruition, more than half of all the 64 gigawatts of new power slated to come online in the U.S. this year will be solar. That’s according to a new analysis of survey data the U.S. Energy Information Administration released on Wednesday. Battery storage, wind, and natural gas plants account for virtually all the other half. Assuming developers follow through, it will be the largest amount of new capacity added since 2002, when developers completed 58 gigawatts of new power plants, 57 gigawatts of which were fueled by natural gas.
Solar growth almost mirrors that of natural gas in the early 2000s. EIA
In China, the world’s largest annual emitter, the growth of solar reduced planet-heating pollution from the power sector during the first half of this year. While China’s overall carbon output dropped 1%, emissions from the electricity generation — the country’s largest single source of planet-heating gases — plunged by 3% as solar panels met new demand, according to analysis published Thursday morning by Carbon Brief.
Not to be outdone by a Garden State politician’s energy ambitions, New York announced a new pot of funding Wednesday for low-carbon fuels. In a press release, the New York State Energy Research and Development Authority made nearly $8 million available to “support innovation in the development of low-carbon fuels,” including a program to convert sewage, agricultural waste and other garbage into energy. “Early-stage innovation is a valuable tool that benefits all New Yorkers by accelerating the adoption of technologies that ultimately help to lower emissions from hard-to-electrify sectors such as aviation, maritime and heavy-duty industrial processes,” NYSERDA CEO Doreen Harris said in a statement. Proposals are due by January 22, 2026, and projects will move forward in three phases, from site selection to engineering design and construction.
This follows a series of other New York moves to step up its energy investment, including laying out plans for its new nuclear plant in June and putting out its first bulk order for energy storage last month.
Power equipment giant Hitachi Energy is investing $106 million into building North America’s biggest factory to manufacture a key component in electrical transformers. The U.S. has for years now faced a shortage of both power and distribution transformers, the equipment that modifies the voltage of electrons traveling from generating stations to the outlets in your wall. The problem is only getting worse. Manufacturers have struggled to keep up with surging demand from replacements of aging equipment and new additions as the grid expands — which, as my colleague Robinson Meyer explained yesterday, is a factor pushing up electricity prices well beyond the pace of inflation.
The problem has bipartisan origins. The Biden administration pushed to increase the efficiency of new transformers, forcing manufacturers to decide between ramping up production of existing models or preparing assembly lines to meet new standards. While the Biden-era Department of Energy backed off its plans, the Trump administration slapped new tariffs on steel and other imports needed to make transformers, and sowed new chaos for factory owners calibrating the right amount of demand to the shifting requirements of federal energy policy since the passage of the One Big Beautiful Bill Act.
When Trump made an historic investment into the nation’s only active rare earths producer, MP Materials, his Department of Defense set a price floor of $110 per kilogram meant to spur more U.S. production of the metals needed for modern weapons and clean-energy technology. But in its deal to buy the critical minerals company ReElement Technologies on Wednesday, Vulcan Elements, a North Carolina-based rare earth magnet manufacturer, said it could generate the metals at a price “significantly below” what the Pentagon promised to pay MP Materials. “This pricing will enable Vulcan to be competitive in global markets,” Vulcan CEO John Maslin told Reuters. “We wanted to make sure the unit economics made sense.”
You’ve probably noticed — even Trump has noticed — but the reason why is as complicated as the grid itself.
You’re not imagining things: Electricity prices are surging.
Electricity rates, which have increased steadily since the pandemic, are now on a serious upward tear. Over the past 12 months, power prices have increased more than twice as fast as inflation, according to recent government data. They will likely keep rising in years to come as new data centers and factories connect to the power grid.
That surge is a major problem for the economy — and for President Trump. On the campaign trail, Trump vowed to cut Americans’ electricity bills in half within his first year in office. “Your electric bill — including cars, air conditioning, heating, everything, your total electric bill — will be 50% less. We’re going to cut it in half,” he said.
Now Trump has mysteriously stopped talking about that pledge, and on Tuesday he blamed renewables for rising electricity rates. Even Trump’s Secretary of Energy Chris Wright has acknowledged that costs are doing the opposite of what the president has promised.
Trump’s promise to cut electricity rates in half was always ridiculous. But while his administration is likely making the electricity crisis worse, the roots of our current power shock did not begin in January.
Why has electricity gotten so much more expensive over the past five years? The answer, despite what the president might say, isn’t renewables. It has far more to do with the part of the power grid you’re most familiar with: the poles and wires outside your window.
Before we begin, a warning: Electricity prices are weird.
In most of the U.S. economy, markets set prices for goods and services in response to supply and demand. But electricity prices emerge from a complicated mix of regulation, fuel costs, and wholesale auction. In general, electricity rates need to cover the costs of running the electricity system — and that turns out to be a complicated task.
You can split costs associated with the electricity system into three broad segments. The biggest and traditionally the most expensive part of the grid is generation — the power plants and the fuels needed to run them. The second category is transmission, which moves electricity across long distances and delivers it to local substations. The final category is distribution, the poles and wires that get electricity the “the last mile” to homes and businesses. (You can think of transmission as the highways for electricity and distribution as the local roads.)
In some states, especially those in the Southeast and Mountain West, monopoly electricity companies run the entire power grid — generation, transmission, and distribution. A quasi-judicial body of state officials regulates what this monopoly can do and what it can charge consumers. These monopoly utilities are supposed to make long-term decisions in partnership with these state commissions, and they must get their permission before they can raise electricity rates. But when fuel costs go up for their power plants — such as when natural gas or oil prices spike — they can often “pass through” those costs directly to consumers.
In other states, such as California or those in the Mid-Atlantic, electricity bills are split in two. The “generation” part of the bill is set through regulated electricity auctions that feature many different power plants and power companies. The market, in other words, sets generation costs. But the local power grid — the infrastructure that delivers electricity to customers — cannot be handled by a market, so it is managed by utilities that cover a particular service area. These local “transmission and distribution” utilities must get state regulators’ approval when they raise rates for their part of the bill.
The biggest driver of the power grid’s rising costs is … the power grid itself.
Historically, generation — building new power plants, and buying the fuel to run them — has driven the lion’s share of electricity rates. But since the pandemic, the cost of building the distribution system has ballooned.
Electricity costs are “now becoming a wires story and less of an electrons story,” Madalsa Singh, an economist at the University of California Santa Barbara, told me. In 2023, distribution made up nearly half of all utility spending, up from 37% in 2019, according to a recent Lawrence Berkeley National Laboratory report.
Where are these higher costs coming from? When you look under the hood, the possibly surprising answer is: the poles and wires themselves. Utilities spent roughly $6 billion more on “overhead poles, towers, and conductors” in 2023 than in 2019, according to the Lawrence Berkeley report. Spending on underground power lines — which are especially important out West to avoid sparking a wildfire — increased by about $4 billion over the same period.
Spending on transformers also surged. Transformers, which connect different circuits on the grid and keep the flow of electricity constant, are a crucial piece of transmission and distribution infrastructure. But they’ve been in critically short supply more or less since the supply chain crunch of the pandemic. Utility spending on transformers has more than doubled since 2019, according to Wood Mackenzie.
At least some of the costs are hitting because the grid is just old, Singh said. As equipment reaches the end of its life, it needs to be upgraded and hardened. But it’s not completely clear why that spike in distribution costs is happening now as opposed to in the 2010s, when the grid was almost as old and in need of repair as it was now.
Some observers have argued that for-profit utilities are “goldplating” distribution infrastructure, spending more on poles and wires because they know that customers will ultimately foot the bill for them. But when Singh studied California power companies, she found that even government-run utilities — i.e. utilities without private investors to satisfy — are now spending more on distribution than they used to, too. Distribution costs, in other words, seem to be going up for everyone.
Sprawling suburbs in some states may be driving some of those costs, she added. In California, people have pushed farther out into semi-developed or rural land in order to find cheaper housing. Because investor-owned utilities have a legal obligation to get wires and electricity to everyone in their service area, these new and more distant housing developments might be more expensive to connect to the grid than older ones.
These higher costs will usually appear on the “transmission and distribution” part of your power bill — the “wires” part, if it is broken out. What’s interesting is that as a share of total utility investment, virtually all of the cost inflation is happening on the distribution side of that ledger. While transmission costs have fluctuated year to year, they have hovered around 20% of total utility investment since 2019, according to the Lawrence Berkeley Labs report.
Higher transmission spending might eventually bring down electricity rates because it could allow utilities to access cheaper power in neighboring service areas — or connect to distant solar or wind projects. (If renewables were driving up power prices as the president claims, you might see it here, in the “transmission” part of the bill.) But Charles Hua, the founder and executive director of the think tank PowerLines, said that even now, most utilities are building out their local grids, not connecting to power projects that are farther away.
The second biggest driver of higher electricity costs is disasters — natural and otherwise.
In California, ratepayers are now partially footing the bill for higher insurance costs associated with the risk of a grid-initiated wildfire, Sam Kozell, a researcher at the E9 Insight, told me. Utilities also face higher costs whenever they rebuild the grid after a wildfire because they install sensors and software in their infrastructure that might help avoid the next blaze.
Similar stories are playing out elsewhere. Although the exact hazards vary region by region, some utilities and power grids have had to pay steep costs to rebuild from disasters or prevent the likelihood of the next one occurring.
In the Southeast, for instance, severe storms and hurricanes have knocked out huge swaths of the distribution grid, requiring emergency line crews to come in and rebuild. Those one-time, storm-induced costs then get recovered through higher utility rates over time.
Why have costs gone up so much this decade? Wildfires seem to grow faster now because of climate change — but wildfires in California are also primed to burn by a century of built-up fuel in forests. The increased disaster costs may also be partially the result of the bad luck of where storms happen to hit. Relatively few hurricanes made landfall in the U.S. during the 2010s — just 13, most of which happened in the second half of the decade. Eleven hurricanes have already come ashore in the 2020s.
Because fuel costs are broadly seen as outside a utility’s control, regulators generally give utilities more leeway to pass those costs directly through to customers. So when fuel prices go up, so do rates in many cases.
The most important fuel for the American power grid is natural gas, which produces more than 40% of American electricity. In 2022, surging demand and rising European imports caused American natural gas prices to increase more than 140%. But it can take time for a rise of that magnitude to work its way to consumers, and it can take even longer for electricity prices to come back down.
Although natural gas prices returned to pre-pandemic levels by 2023, utilities paid 30% more for fuel and energy that year than they did in 2019, according to Lawrence Berkeley National Lab. That’s because higher fuel costs do not immediately get processed in power bills.
The ultimate impact of these price shocks can be profound. North Carolina’s electricity rates rose from 2017 to 2024, for instance, largely because of natural gas price hikes, according to an Environmental Defense Fund analysis.
The final contributor to higher power costs is the one that has attracted the most worry in the mainstream press: There is already more demand for electricity than there used to be.
A cascade of new data centers coming onto the grid will use up any spare electron they can get. In some regions, such as the Mid-Atlantic’s PJM power grid, these new data centers are beginning to drive up costs by increasing power prices in the capacity market, an annual auction to lock in adequate supply for moments of peak demand. Data centers added $9.4 billion in costs last year, according to an independent market monitor.
Under PJM’s rules, it will take several years for these capacity auction prices to work their way completely into consumer prices — but the process has already started. Hua told me that the power bill for his one-bedroom apartment in Washington, D.C., has risen over the past year thanks largely to these coming demand shocks. (The Mid-Atlantic grid implemented a capacity-auction price cap this year to try to limit future spikes.)
Across the country, wherever data centers have been hooked up to the grid but have not supplied or purchased their own around-the-clock power, costs will probably rise for consumers. But it will take some time for those costs to be felt.
In order to meet that demand, utilities and power providers will need to build more power plants, transmission lines, and — yes — poles and wires in the years to come. But recent Trump administration policies will make this harder. The reconciliation bill’s termination of wind and solar tax credits, its tariffs on electrical equipment, and a new swathe of anti-renewable regulations will make it much more expensive to add new power capacity to the strained grid. All those costs will eventually hit power bills, too, even if it takes a few years.
“We're just getting started in terms of price increases, and nothing the federal administration is doing ‘to assure American energy dominance’ is working in the right direction,” Kozell said. “They’re increasing all the headwinds.”