Shift Key is hosted by Robinson Meyer, the founding executive editor of Heatmap News.
Subscribe to “Shift Key” and find this episode on Apple Podcasts, Spotify, Amazon, or wherever you get your podcasts.
You can also add the show’s RSS feed to your podcast app to follow us directly.
Robinson Meyer:
This episode of ShiftKey is brought to you by Tandem PV, the leader in perovskite technology. Heatmap Labs recently sat down with Jennifer Granholm, the former Secretary of Energy and Governor of Michigan, and a newly minted board member at Tandem PV.
Daniel Palken:
You know, I would love it if people look back and say that this was one of those technologies that changed the economics of clean energy. You know, solar is cheap, and this can really take it to the next level. When we invent and we build and we manufacture, America wins. And if in five years from now, Tandem has helped to prove that advanced solar can be invented here and manufactured here and deployed around the world, I will feel very good about this decision.
Robinson Meyer:
Stay tuned at the end of this week's episode to learn more about Secretary Granholm's decision to join the board of Tandem PV.
Robinson Meyer:
Hello, it's Wednesday, July 29th. If anything in clean energy is going to happen in this Congress, that's the Congress that ends at the end of this year, 2026, it is permitting reform. That is a bipartisan compromise deal to streamline the paperwork and all the procedure that's required when you build any kind of infrastructure in the United States, be it a bridge or a tunnel, a solar farm, a wind farm or a power line, or yes, a natural gas pipeline. The permitting system affects where infrastructure gets built, who can build it, how easy and cheap it is to build, and how much paperwork you have to do along the way. And in many cases, it places much larger burdens on clean energy than on fossil fuels.
I think permitting is really important. I talk about it a lot. When we had Lily Burmel on the show a few weeks ago, she talked about how the biggest obstacles to building more, say, solar or wind in the United States at this point are often as much about permitting as they are about financing or local climate legislation or anything that we have historically thought of as quite important. McKinsey says that roughly one to one and a half trillion dollars of infrastructure projects are currently held up in the federal permitting process somewhere in the country. So that's just a lot of growth and jobs that's currently being constrained by the permitting process. And at Heatmap, we've covered how the Trump administration has aggressively weaponized the existing permitting process to block wind and solar. But there's actually lots of other examples of where I think good environmental policies have been held up by some, I would call it a permitting procedure. So for instance, as you'll hear about on the show today, New York City congestion pricing was delayed for years basically because of a permitting issue.
So on this show, I wanted to talk about this potential permitting reform deal that could come together in this Congress. You know, I wanted to talk about what's in it, why it's important, why it would need to happen soon, who the winners and losers are, and some of the history here. This is our permitting reform omnibus episode, and we have a great guest for it. So Daniel Palkin worked on Capitol Hill for many years. He worked for a lot of Democrats, Senator Whitehouse, Senator Hickenlooper, and Senator Manchin. He's now Director of Infrastructure for Energy and Permitting at Arnold Ventures. We're going to talk about the history, the policy, what a deal could look like, all the good stuff on this episode. I'm very excited. We're just going to cut right to it. I'm Robinson Meyer, the founding executive editor of Heatmap News, and you are listening to ShiftKey. Daniel Palkin, welcome to ShiftKey.
Daniel Palken:
Thank you for having me, Rob.
Robinson Meyer:
Okay, so at this point, we've been talking about permitting reform for so long, and I feel like it has a bit of a mythic quality. But my understanding is that if it is ever going to happen, it would happen in the next few months, and that we're entering a critical time for permitting. The possibility of any kind of package coming together here. So let's just start with this conversation. You're like, where do we stand on permitting reform today? And what's your role in the process?
Daniel Palken:
Yeah. So for my part, I work at Arnold Ventures. I know listeners are likely at least somewhat familiar with the organization since you had John Arnold, one of our founders on the show recently. And we're a philanthropy that grants money to organizations that do work to make it easier to build better, faster, and at lower cost in this country. So we're very interested in the permitting reform discussion, and we're interested in getting the details right and also encouraging passage. And so we support a number of groups who we think are doing good work at kind of, you know, building the record and helping inform the people who are actually n the seats of policymaking and their staff.
So, you know, where we are today, you know, permitting reform has been something that has been debated in Washington and acted upon in Washington for decades, primarily through the series of surface transportation bills, which are authorized every five years or so. And for about two decades, those have kind of played around the edges with reforms to NEPA, primarily focused on transportation projects. But then starting in 2015, there were a set of bigger reforms in the FAST Act called the FAST 41 reforms that allowed certain projects to get preferential treatment, including through more favorable judicial review, statutes of limitations. And then that kind of led into the more modern era. And in the kind of modern permitting debate that we're having now, I consider it maybe the fourth incarnation in a series of kind of once a year or every other year discussions. The first one kind of came immediately out of the Inflation Reduction Act. So you'll recall the big bill that was passed near the start of the Biden administration or middle in like 2022.
And Senator Manchin, who I didn't work for at the time, but would come to work for, was a pivotal vote in passing that. And he insisted that as a condition of doing that, if we're going to invest so much money, we need to set the conditions that you can deploy the money cost effectively. And so he and Senator Schumer reached an agreement that they were going to try to move a permitting bill forward. And that was kind of permitting 1.0 in our recent history. And they had a bill that included some reforms to transmission. It included some other things initially around the Clean Water Act that ended up being controversial. It included some things around NEPA, but it wasn't able to quite garner the votes. It deadlocked 47 to 47 in a vote to attach it to NDAA in December of 2022. And the conversation then kind of went dormant only to revive in what I would call the second permitting 2.0 incarnation of the discussion, which happened during the Fiscal Responsibility Act. So phase two was the Fiscal Responsibility Act. This was kind of a really odd way for a permitting debate to happen, in my opinion. But we were heading towards a default on the federal debt and we had to raise the federal debt ceiling as a country.
Robinson Meyer:
This is the Biden era. This is the second half of the administration. So Republicans have won the House. So now it's a split Congress or a Republican controlled Congress. And as has happened during previous Democratic administrations, Republicans, I would say, extremely irresponsibly don't want to raise the debt ceiling without extracting some kind of leverage. And what emerged was this Fiscal Responsibility Act. This is, I believe it's 2023 is when this happened.
Daniel Palken:
May of 2023, yeah, it passed. And there was a negotiation on permitting reform. And there was a threshold question of, is this going to happen at all? And Democrats said, OK, we are game to play ball. And then there was a question of, how big are we going to go? And there were kind of some base level NEPA reforms that are more than symbolic. They matter. But there are page limits and time limits on the National Environmental Policy Act. 75 pages for an environmental assessment, 150 pages for an environmental impact statement. Sounds pretty strict when you consider that sometimes these reviews are 10,000 pages plus.
But in particular, you know, there were some loopholes. You could simply fit everything you wanted in an appendix. And the time limits, which were one year and two year respectively, depending on the stringency of review, the agency could simply extend at its own discretion in consultation with the applicant. And there was a question of, would you go a lot further than those reforms? And Democrats at the time said, we would want to see some transmission policies. And at the time, there was a bill that I had worked on for my then boss, Senator John Hickenlooper of Colorado, called the Big Wires Act, which entered into the discussion. And the Republicans said, we would want to see some real judicial review reforms in exchange for that. And there just wasn't a meeting of the minds. And so they kind of went with the smaller ball NEPA stuff. They also went with a transmission minimum transfer study in lieu of actually enacting a minimum transfer requirement. And then they kind of moved on. And then there was a real question of, well, have we scratched the itch? Is permitting gone? But the answer to that proved to be no. Permitting 3.0, which is the one kind of immediately proceeding where we are, was the effort that really focused on the Senate side last Congress around the Energy Permitting Reform Act, or EPRA. And that was a bill that came out of the Energy and Natural Resources Committee, Chairman Joe Manchin, who I was working for at the time in partnership with then ranking member now whip of the Senate Republicans, John Barrasso. And it was a bill that included a number of provisions that included provisions on planning and siting.
Of interstate transmission. It included provisions to fix a court decision that had made it very hard to do waste disposal associated with hard rock mining. It included provisions to kind of limit the administration's ability to pause the export of liquefied natural gas. It included requirements for onshore and offshore leasing of oil and gas and coal. It included a bunch of different ingredients that were all within the jurisdiction, crucially, of the Energy and Natural Resources Committee. And that was a bill that was negotiated in a divided government. And it was, you know, we kind of knew when we were negotiating it, that the worst case scenarios for the bill politically going into the 2024 election was either side winning a trifecta. The euphoria that a political party experiences when it sees itself coming into control of all three seats of government tends to lead one to forget about pesky things like the filibuster, which mean that you have to have some measure of bipartisan support in order to pass something that has to go through regular order. And so there were a lot of arguments at the time that, oh, you know, Republicans, we can pass things in the next Congress. We can pass whatever we want. And people tried to say, you know, there's still the filibuster. This isn't going to clear through the parliamentarian. And then they tried to, at the start of this Congress, put things in a reconciliation bill, the one big beautiful bill. And sure enough, the parliamentarian said, no, you can't pass those.
So, you know, permitting 3.0 kind of ended with a whimper. It passed the Senate Energy and Natural Resources Committee 15 to 4, a very strong bipartisan showing, an impressive dynamic range of senators voted for it. But it made it no further than that. The House had been won by a very thin margin. And I think there was nervousness around, are we going to bring something controversial in the lame duck when we're setting up a new Congress and all of that.
So that brings us to the heart of your question of like where we are now. There have been negotiations going on from fairly early in this Congress, in the Senate, and the House has actually done a lot of its part. The House has passed some major pieces of legislation on a mostly but not entirely partisan basis. So they've passed bills.
Like the SPEED Act, which is a big set of sweeping reforms to NEPA and associated judicial review. They've passed bills like the Permit Act, which reformed the Clean Water Act, and they've passed a number of things that have been very bipartisan, like the E-Permit Act, which does digitization of various permitting things. In the Senate side, the negotiations are really unlike the EPR negotiations, which were just the E&R committee until the very end. These are really Four Corners negotiations. So it's on the Environment and Public Works Committee, It's Chair Shelley Moore Capito and Ranking Member Sheldon Whitehouse. And on the Energy and Natural Resources Committee, both chair and ranker have turned over. It's now Chair Mike Lee of Utah and Ranking Member Martin Heinrich of New Mexico. And I would say the defining characteristic of these negotiations is all four parties are really sincerely interested in good faith in getting to a deal. Like I've been really impressed with kind of the tone and tenor from the outset to where we are now. They're facing a lot of challenges, right? There's stuff going on in the background. There's withdrawals of permits that are making it very hard politically, you know, for this and that side. And this hasn't been a historically productive Congress. It's been quite the opposite. But if anything can pass this Congress in the energy space, I think it's certainly permitting reform.
Robinson Meyer:
That was an incredible history, and I want to thank you for it. Let's talk about the current deal for a second, then I want to get into some of that history. But what do you think are the current biggest obstacles to getting a deal through? Because I think one thing you just said is quite important to call out, and actually something I've encountered when I've gone on other podcasts to talk about permitting reform. I mean, I realize your context of putting things diplomatically, but I've encountered some skepticism that I think especially on the Democratic side that Senators Whitehouse and Heinrich are committed to a deal.
But it sounds like you are both convinced that they are. So what are the biggest obstacles to getting to yes on this package?
Daniel Palken:
Yeah. So, I mean, they're committed to a deal as long as the deal, you know, has the has the right elements. I think Capito and Lee and their counterparties would say that, too, and also is occurring in an environment in which they can have, you know, some degree of faith that the bill will be implemented fairly. And so to that point, one of the big obstacles is, you know, this the cancellation and the revocation and the failure to grant permits that under regular order and routine circumstances would normally be granted. So there's, you know, more things than we could list here, but there's been a lot of actions taken by the Trump administration to make it unreasonably hard to apply for permits that even under the first Trump administration would have been viewed as routine. In the most extreme cases, there's, of course, been revocations of permits like the five wind farms off the Atlantic coast that some of them have been, you know, at the time, 80 percent under construction and had their permits pulled. Courts, thankfully, have been very quick to react to those and say, no, you know, these are they've actually used words like this. This appears to be pretextual and said, you can't do that.
And in some instances, the administration has failed to kind of file certain appeals and has made strategic moves to move a few dozen projects forward through its Department of Interior pause on permitting. So there have been some signs of goodwill, but it's been rocky. And I think there was a quote that Josh Siegel had from Sheldon Whitehouse as recently as like this morning or last night where he keeps saying it's going to be really hard to sell my caucus on a deal if we're in an environment where you can't permit things. And, you know, I don't want to paint with a single brush here like the, you know, Donald Trump is certainly the one who is responsible for this. Now, there is a broader history of not just permit revocations. I think it's fair to say that Trump has done a lot more to revoke permits of existing projects. Biden certainly did it with the Keystone XL pipeline. But, you know, the Biden administration had its own list of things that it did that really upset people like Senator Barrasso when he was trying to negotiate a deal. It less took the form of revocations and more took the form of proactive restrictions. So everything from.
You know, leasing pauses of oil and gas and coal offshore and onshore and LNG pauses, of course, which was addressed in the EPRA bill, and a much longer list besides of kind of rules that made it very hard to invest and move forward with, in that case, fossil projects. And so there's been a long history of tit for tat. That is a major headwind. The other big obstacle is time. You know, we're running out of time, this Congress, for reasons we could discuss. Next, Congress is likely to be a less hospitable environment to a bipartisan permitting deal. And then maybe the last barrier is there's always stakeholder politics, like permitting deals impact a lot of stuff.
You know, there was a McKinsey analysis that said there's about $1.1 to $1.5 trillion of infrastructure projects that are currently in some stage of their NEPA review at any given time. The transmission provisions, the provisions that could impact pipelines, you know, there are not no trade-offs to these things. There are different business models in the power sector, all of whom stand to potentially gain or lose from this or that deal. I sincerely believe that a permitting deal can be very positive some, but there are always some people who will feel like they're not getting as much as they could, or they're losing something here or there. And those stakeholders, you know, tend to be pretty concentrated in their focus when coming out and saying, please don't do a deal. And it's easier to play defense against something than to pass something in Washington.
Robinson Meyer:
It's so interesting to hear you talk about kind of the history of, let's say, permit interference. I'm not sure what to call it, because I think it's important to emphasize that as you were doing that, what the Trump administration has done, I think, especially on onshore and offshore wind, but on all clean energy projects is.
As we have described it at Heatmap, kind of this extrajudicial killing of an industry. I mean, it's all these regulatory processes that in normal times would be approved.
On the same day, that were completely pedestrian, quotidian, things that it made sense to route through the federal government. For instance, it makes sense to check in with the Pentagon before you build a wind farm to make sure that you're not going to interfere with local air bases, with national security, with flight paths. That makes sense to have that as a step in an energy permitting process. It's hard to imagine a world where we don't have that as a step. But what happened until the current administration is that the Pentagon got back to you on the same day and was like, yeah, that's fine, whatever, you can build it. Or within days, right? And now that has emerged as a major bottleneck on permitting. In fact, reporting suggests the Defense Department is just holding up all of these permits in order to block wind. At the same time, it is also true that back during the Biden administration, I mean, famously, Biden revoked the permits for the Keystone XL pipeline on the first day of his presidency, a project that was under construction at the time. And I think it is worth, there's a whole other thing to be done about Keystone XL, because I think one interesting story about that project is that there was far more skepticism about it at the beginning of its journey in the climate movement than there was by the time that it was a day one action from the Biden administration and ultimately.
Whether it was a productive use of time given how much oil was able to get exported from the tar sands just on train cars, not on pipelines. But, you know, there were other things the Biden administration did too. Famously, it was hard to get fossil fuel projects permitted in their interior department, for instance. And that was something that even if it was never a specified policy was something we heard.
Daniel Palken:
Yeah, there was a whole of government approach, right? I mean, it was the things you just mentioned. It was also, you know, there were FERC rules on pipeline, you know, reviews. They were trying to make a lot of pipelines go through environmental impact statements rather than EAs. There was an SEC rule that just imposed a lot of strict disclosure requirements on anybody who was investing in fossil industries. There were a lot of things in Alaska, right? You know, talk to Lisa Murkowski about how she felt. To listen to her remarks. Yeah. You know, in those days, there were all the leasing pauses. You know, there were EPA rules. There were effluent rules. There were mercury and air toxics rules. And there were coal ash rules. There were greenhouse gas rules. And there were more expected to be forthcoming had Kamala won. And I think what it felt like to a lot of Republicans was, you know, gee, some of these you could justify. But they felt that in the aggregate, what was clearly happening was a lot what Democrats feel is happening now. Now, It's different mechanisms, right? I don't want to equate the pulling of a lawfully granted permit, which, again, Biden also did in at least that one instance, with kind of proactive rules to stop things. But it really was the same effect. And if you're arguing to a Republican who cares about the energy sector that these are really different, you're going to be landing on deaf ears. And I think there's an important point of empathy there and there's an important kind of critical evaluation and strategic point for Democrats in the future of, you know, does this tit-for-tat strategy, is this advantageous to clean energy resources given some of the backlash it is contributing to?
Robinson Meyer:
There's one more point I want to hit on the history, which is... Back during the Biden administration, the environmental movement made a bet. They made a political calculation about how this permitting reform conversation was going to work out. And I think it has gone terribly because I think when you look, you can say, if people remember back after the IRA passed, Manchin said, OK, if we pass the Inflation Reduction Act, I also want to pass a permitting reform package. And a number of green groups declared that this package, because it included basically mandatory approvals for a pipeline in West Virginia, the Mountain Valley pipeline, was Manchin's dirty deal. This is the term that they used, Manchin's dirty deal. And they said, no, no Democrats should support Manchin's dirty deal.
That was a political calculation. And it was based on the idea that now the IRA is passed, so we don't need Manchin anymore. And we can block this pipeline successfully. And Congress shouldn't be in the habit of approving pipelines. What actually happened, as we were talking on a recent show with Lily Burmel, who worked in the Biden administration, and as I think modeling from Rhodium and Jesse and others has come to show, is that in fact, you did need permitting legislation to unlock the full capacity of the IRA. Because it's still hard to build transmission in the United States, we weren't able to build as much clean energy under the IRA as we had initially forecast that we might. And every year that the IRA has been on the books, obviously now the wind and solar tax credits have a cliff that we've passed or are in the process of passing. We've realized the hard constraints, the legal constraints on clean energy construction are like higher than we previously thought they were. It would have been really nice to get a permitting deal with the IRA. We would have used that law a lot more. At the same time, the Mountain Valley Pipeline ultimately got approved. It got approved.
Daniel Palken:
It's been built. In that permitting 2.0 I talked about, right? That was in the FRA deal was they just copied and pasted the language. And so it kind of happened for free afterwards. So, you know, there is a moral of that story, which is, you know, jump on the deal when you can. Now, to be fair, the environmental groups who opposed that deal, and I remember the dirty deal campaigns and all the posters around DC, you know, 10 Democrats voted against that. About, you know, 40 voted for it. So they weren't very successful in peeling off Democrats. You know, what actually stopped it was only seven Republicans voted for that deal. And many were ones that had a nexus with the Mountain Valley pipeline itself because they were so eager to see it approved for their states. So it was actually that deal was kind of recognized as not having enough of the Republican priorities. And, you know, for that reason, and maybe for also political reasons of not wanting to give the Biden administration a win there. And as far as that would have been perceived as one, there were a number of Republican votes against it more than Democrats.
Robinson Meyer:
So let's talk about what is in this Yes. Package. So one interesting thing about permitting reform is that we call it by this name permitting reform, but actually it's a bit of a grab bag of different changes to different laws, all of which have some nexus in the selection of siting for large-scale infrastructure or energy projects and the paperwork and studies involved in that siting. But let's just walk through what What would be in a permitting reform package, especially the permitting reform package that is potentially close to coming together in this Congress?
Daniel Palken:
Yeah, it falls into several buckets. I'll put it into six buckets is, I think, the most logical way to think of it for this conversation. One is NEPA and judicial review. So that's the one, that one's one of the very high profile ones that's going to get a lot of attention. The Speed Act is kind of the House's offer there. And I would expect to see elements, but not a kind of copy and paste of the whole text in something that the Senate comes out with. I think they'll leave their own mark on NEPA and associated judicial review reforms.
Another very big one that's going to get a lot of attention is reforms to transmission or reforms to the nation's bedrock power law, the Federal Power Act. The third bucket is Clean Water Act, which has a very significant nexus with pipelines, natural gas pipelines in particular, but also,
You know, depending on how it's done, could have implications for hydropower facilities and other things within and outside of the energy sector. The fourth one is not a single law necessarily, but kind of goes under the heading permit certainty, which is these questions we were just talking about. You know, it's one response to Trump is pulling all these permits is for, you know, Congress to say, well, we don't want to do a deal now. But the other response, of course, is to say we're going to try to stop Trump from doing that through legislating some of it and also potentially through reaching an understanding in the lead up to a permitting deal that like, you know, this has to stop. So permit certainty could be stuff that's within the law. It could also manifest as some form of shared understanding between the parties that happens on the side of a law, or it could be both. The fourth bucket, which is a really interesting one, or I guess fifth bucket now, the newest entrant to the permitting discussion is the National Historic Preservation Act. This is one that Senator Lee has made a signature priority of his. It's kind of the major environmental law that's within his committee, the Energy and Natural Resources Committee's jurisdiction. And then the sixth category is everything else. There's a bunch of odds and ends and parochial things. There's some of those mining fixes that I discussed. Every permitting bill seems to, by mandate, have a geothermal title that unites both parties and makes them feel happy. There could be other hydropower stuff. So there's a grab bag of things that I would say are smaller and less kind of focused on any one specific law, but that will probably find their way into any permitting deal. And those, I would say, are the six major buckets of reforms. And we could dig into any or all of them, depending on how much time you have here today.
Robinson Meyer:
Let's dig into a few of them. Let's dig into a few of them. We don't know exactly what's in the deal yet, but what are the kinds of changes you would expect to see in the transmission section?
Daniel Palken:
Yeah. So just to level set up top on transmission, yes, it's very helpful for new energy sources such as wind that are trying to connect to the grid. What transmission really does is, you know, I almost think of it as synonymous with headroom. When you systematically upgrade your transmission system, you are creating an electrical grid that has spare room on it such that when you add something, you're not always running into a hundred, you know, thermal faults and other things that cause
Years of study and tens to hundreds of millions of dollars of upgrades. So I just want to like to kind of frame out the problem that we're trying to solve with transmission. People, I think, have intuitions that don't match the real way that voltages and currents propagate on the electric system. There was an example of a generator that was being connected in northwestern North Dakota like a few years ago. And that generator, it was an SPP, the Great Plains grid operator, and they had to apply to get interconnected like everybody does these days. And what they found, what SPP found, was that they were going to trigger grid upgrades because they were going to change power flows all over the system, right? When you hook something up new to the system, the grid operator doesn't get to say to the physics, hey, make the power flow here, but not there. It just flows down the path of least resistance on the wires, and you solve Kirchhoff's laws, which are not laws that Congress can amend. And it triggered upgrades 1,000 miles away at the furthest. So it triggered grid upgrades that were needed outside of SPP's territory, in the territory of a cooperative utility called Associated in the state of Missouri.
And this was a generator that was coming online in North Dakota. And so with transmission, that's the microcosm of it. You're trying to systematically upgrade your system. Sometimes that means building big new lines to places that don't have the capacity. Sometimes it means doing the boring and dirty work of systematically upgrading transformers and substations and relays to accommodate much greater power flows to anticipate the next 10 or 15 or 20 years of stuff you might add on the system. And it's relevant for generation, but it's also super relevant for demand. Right now, the stuff that's coming online, you know, five years ago, we were only talking about all the wind and solar coming online. Now we have a lot of data centers that are coming online. And if we fail to upgrade the grid, we're going to perpetually find ourselves in a situation where supply is way behind demand. And that leads to high prices.
Robinson Meyer:
I've wondered if the politics of data centers are making the politics of transmission easier, because for a while during the Biden administration, you know, look, what happens is that a lot of new, especially clean generation gets built in rural areas, which are in our current political system, basically red areas and sent to suburbs and cities, which tend to be bluer. And so when you shift the resolution to state level politics, what that meant is that Democrats often wanted to build transmission or they were interested in transmission for a number of reasons, for improving the overall electricity market, for improving the carbon intensity of the electricity system, for lowering energy costs. And red states, which often had cheap electricity, in part because of clean energy, saw that.
As an arbitrage that they were on the wrong side of, because they said, well, if we build better transmission, then suddenly our price equalizes with your price and our prices go up and we're not necessarily compensated for it. And this is why a lot of the arguments over transmission go to kind of how you pay for the price imbalances that are created or who pays for the new infrastructure. But I've wondered if data centers, because they are getting built in rural and exurban areas that have... Very cheap electricity. Because in some ways, as a data center developer, what you're trying to do is go find, the places where land is cheapest, power is cheapest, but abundant, and you can maybe hook up to some water system, have already changed the politics of transmission in that everyone's electricity prices have gone up. This is not a story where we have too much supply in some areas and too much demand in others. Everywhere is seeing screaming demand, basically. And so it's easier to make a case that we need to expand the market and expand the infrastructure overall because basically load growth is now kicking systems across the country into a more congested state.
Daniel Palken:
That's a great synopsis of it, right? You know, data centers, their political ramifications for permitting reform are complicated because they're incredibly unpopular at the local grassroots level. And I think a lot of that is people mapping their fears about the technology onto the siting of the infrastructure. I think some of it has to do with the siting of the infrastructure. But I think if it were any other type of infrastructure that spit off this much local revenue and had this small land footprint, you know, it wouldn't attract quite the same level of attention. At the same time, as you say, data centers at the national level have been a huge priority for the Trump administration because they correctly recognize that it is a big national security vulnerability if we cannot build these things at home. Imagine that Claude Mythos model that was finding 250 zero-day hacks in Firefox alone to say nothing of all the other web browsers and open source software. If China has the next version of that and the U.S. is two years behind because we don't have the energy. We live in a very fragile state relative to our geopolitical peers and rivals. And so in the data centers, if you talk to any of the hyperscalers and say, what is your number one ask in permitting reform? The answer is transmission, because transmission is the headroom on the grid that allows them to have a reasonable path to interconnect on a reasonable timeline and not be hit with five years of wait in a queue. So that has been really important to the politics. And I have seen the politics around transmission change for that and other reasons.
Robinson Meyer:
But I think that actually matters to the emissions intensity of data centers, because when you can't hook up a data center to the grid and can't use whatever the local grid mix is, what you do is you build an onsite gas plant. And so you shift from a local grid.
Daniel Palken:
Or you build a diesel plant, right?
Robinson Meyer:
Or diesel generators. You hook up 100 diesel generators like Elon Musk did, and you pollute your local area, right? When you can't, like, If you can hook up to the local grid and use power from the local grid, you know, it's the United States. We have a gas-heavy grid. But the grid, let's say, is going to be 66% gas or 50% gas. Or, you know, and that creates the opportunity.
Daniel Palken:
Well, actually, it's actually even more than you're thinking, right? Because you're thinking, oh, how much of that grid is going to be renewable? So that's the, you know, discount you get on emissions. But actually, if you look at the data centers that are hooking up off grid, they are using like simple cycle, you know, when they're not using repurposed jet engines, they're using 20% thermally efficient, you know, gas plants. Whereas if you're hooked up to the grid, there's really two types of gas plants that live on the grid. There's like 60% efficient combined cycle gas turbines, which are most of the gas power that's generated. And then there's peakers, which have that low efficiency, but are run at capacity factors of like 5%. So from an emissions perspective, they don't matter all that much. You know, even if solar and wind didn't exist at all, and nuclear didn't exist, and hydro didn't exist, it would still be a much, much cleaner option. Like we're talking factors of three in efficiency to connect your data center to the grid if it was purely powered by gas, which is, I think, an important point to understand.
Robinson Meyer:
So there's been a lot of reporting on NEPA over the past few years. I'm going to give a very capsule summary of it. NEPA was created. It was actually the first environmental law passed by the Nixon administration. It preceded the Clean Air Act and Clean Water Act. And it was initially conceived as a way of granting a broad and comprehensive environmental right to the American people. What actually resulted from it was that it requires that basically before the federal government does anything, it conducts an environmental study. And these studies, through pressure from the court system over time, where someone sues the government for not studying some environmental impact, the courts say, oh, actually, you didn't. You got to study it. These studies have become quite long. And this is partially a story of permit weaponization, too. But famously, congestion pricing in New York City, which has been an incredible success, a runaway success, was delayed for years because the, huge NEPA study, like a multi-volume, tens of thousands of pages NEPA study about it. And I would add, by the way, NEPA systematically discourages public investment in the energy system. Because if you're a private company, you want to build something, it requires a much less intensive study than if you are the government who wants to build something. So if you have any idea about building public renewables or building public nuclear or building public hydro. We're building public anything, transmission.
Right now, NEPA is one of the biggest obstacles to it because it systematically helps private investment over public investment because it creates regulatory burdens on public investment on the government that don't exist on private developers. But anyway, I've gone on my little NEPA rant. What would this law do for NEPA?
Daniel Palken:
So there's several major areas of reforms that you can consider within NEPA and the associated, as you correctly indicated, right? NEPA has kind of morphed into the form it has in the 50 plus years since its enactment because of its feedback through the judicial system. The U.S. is a famously litigious society, even by developed country standards. And so there's, you know, from Nader's Raiders onward, there was just a lot of pressure put on the federal government to always be dotting its I's and crossing its T's and then some or else they would lose a case. And then when they lose a case, the next time the agency has to make a decision, they're told to be that much more careful. But, you know, when it comes to what we're looking at here, we're looking at reforms to what remedies are allowed. So that's the first category upon judicial review. If an agency is found to be deficient in its NEPA report, what is a court allowed to do to that? Today, there's mixed standards. The different appellate courts, the different circuits in the nation have different standards they apply. So in some, vacature or just vacating the entire decision is held to be the only, the sole remedy. No matter how small the error, you have to throw out the whole decision and the agency has to kind of go back to square one and go through the process. And if it wants to try to permit it, you know, go from start to finish again. And then in many other circuits, there's this two factor test called the allied signal test, which is like how severe was the error and how costly would it be to, you know, to remedy it or something like that. And those are two very subjective factors.
And so it basically makes things very unpredictable for developers. And so remedy, I think, is the most important area of reform. I think that what we're likely, what the SPEED Act does is it says you just can't vacate and you can't enjoin things. I think what we may be headed towards is some compromise position where Democrats and Republicans agree we're going to meaningfully raise the bar on what it would take in order to vacate a decision.
Daniel Palken:
Other areas of NEPA and judicial review reform are super easy to remember because they all begin with S. So you have scope, standing, statute of limitations, and the standard of review. Standard of review is, you know, what do you evaluate the agency's decision on? This was actually changed recently by the Supreme Court in the seven counties ruling. They set up a substantial deference standard and said that you should afford substantial deference to the agency. This is like a really interesting area of like Democrat-Republican psychology, because six out of seven days of the week, Democrats are the party that want to afford a lot of deference to federal agencies in making decisions. But of course, when it comes to permitting decisions, the valence flips. And Republicans who are cheering the Loper Bright ruling and saying, yay, less discretion for agencies, are now the party that is very happy to say agencies should have a lot of discretion in making decisions around permitting. And Democrats are like, no, no, no.
Robinson Meyer:
That's a whole running story, though, because the Reagan administration initially created... In fact, Neil Gorsuch's mom, as a Reagan official, initially created Chevron deference, and then it turned out that Republicans hated this thing they had done. But We're now in such the legal history weeds that we've alienated all but our five law professor listeners.
Daniel Palken:
For the two listeners left, yeah, the statute of limitations is simple. It's how long you have to bring a lawsuit. Today, it adopts the standard from the Administrative Procedure Act, which is six years, which is a long cloud of legal uncertainty to hang over a project. Standing is who can bring a lawsuit. So Article 3 of the Constitution provides some basic guidance on that. You have to have some particularized harm that's redressable, et cetera, et cetera. But there are some laws that have what's called exhaustion provisions, which say that in order to bring this litigation, you have to have put the agency on notice in the public engagement period that you have this issue. You can't just bring it de novo in a lawsuit for the first time and allege that the agency was missing something you didn't even tell them about. So there's a question of would you put some sort of standing requirement in? And then there's scope, which is what does NEPA apply to in the first place? There's questions of upstream, downstream, right? If you're permitting, you know, some pipeline, but it causes emissions downstream of it or upstream of it. But there's also questions of what types of action, you know, should NEPA apply to decisions that are made by the federal government, like an agency like, you know, the Bonneville Power Administration and on federal lands and waters? And should it also apply to federal spending decisions? Right. There's kind of an irony in the energy space where Democrats, most of the money they gave to clean energy under the Biden administration was given through tax credits, which are exempt from NEPA because it's really a ministerial duty of the IRS to just let the credits be claimed. But when it's the government's own Department of Energy or Department of Commerce making a decision, all of a sudden, here's several years of NEPA review and six years of legal exposure and you might lose the lawsuit and et cetera, et cetera. So do you want to do something about that is one of the questions that comes up.
Robinson Meyer:
I mean, that goes back to one of the big fights between liberals and leftists about the Inflation Reduction Act, a fight I should add, which didn't appear until after the law was passed. Passed, but now I'm being too grumpy, which is that people said that simply doing the amount of clean energy that the build out that the IRA tried to do through the tax credit was de-risking and it should have happened through the federal government instead, instead of just kind of, encouraging the private developers to do it. That is partially because of NEPA. It all comes back to anyway, let's get into two more buckets and then we're going to move the conversation along. So these changes to the Clean Water Act, I think that is going to make a lot of people very nervous because the Clean Water Act, unlike NEPA, creates big substantive protections. It's like the Clean Air Act. This is a substantive environmental law. It creates a lot of substantive environmental protections for the American people. And my understanding is that the mooted changes to the Clean Water Act are primarily around this question about pipelines crossing bodies of water. This has been a Republican goal of permitting reform basically since it became clear this would have to be a bipartisan deal because of the Senate filibuster.
Robinson Meyer:
Tell us a little bit about this passage and then tell us basically, I mean, is this kind of good for pipelines and climate advocates are just going to have to eat it because the rest of the package is so good for clean energy? Or are there other projects here that are as affected by this Clean Water Act title as pipelines are, and there could be some upside for other types of energy projects beyond just oil and gas pipelines, presumably.
Daniel Palken:
Yeah. So the answer is yes to all of that. It is a set of reforms that primarily has pipelines in mind, but that may also have meaningful upside for other forms of energy, including transmission lines and including, depending on how the reforms are done, potentially hydropower could also potentially have implications for wind and solar and other projects that are in wetlands or have have a nexus with federal waters.
But the reforms we're looking at specifically there likely center on two sections of the Clean Water Act. And you're right to point out at the outset that the Clean Water Act, unlike NEPA and unlike the National Historic Preservation Act, by the way, is a substantive, not a procedural law, but it also has procedural elements. And most of the reforms were really all of the reforms that I would imagine we're talking about here are reforms to procedure within the Clean Water Act. So nobody is talking about, to my knowledge, changing the substantive standards for effluent discharge or for water quality within the Clean Water Act, which is a really important distinction. And so the sections we're talking about in primarily Section 401, which is the state certification section, and then also potentially some changes to Section 404, which is where permits are granted for dredge and fill operations. When you're laying a pipeline or sometimes a transmission line, you're going to have to dredge up some sediment on the bottom and the body of water, the wetland, the stream, and that's going to, you know, discharge, you know, potential pollutants downstream of you.
And so there's things called nationwide permits, which grant the ability to do certain categories of activities for periods at a time. And there's talk of extending the duration of those nationwide permits from five to 10 years. So that's one sort of reform. But the more interesting reforms kind of center around Section 401, which that's a section. So if you read the language of it, it says something like it covers any time the federal government grants a permit to conduct any activity that may result in any discharge into the navigable waters. And so all of those words have almost like a Talmudic level of case law.
Robinson Meyer:
And regulatory text. Well, famously, and to introduce those uninitiated readers, the Clean Water Act, large sections of it apply to the waters of the United States. And despite the fact that this is now a 50-year-old law, we've spent 50 years arguing about what falls under the ambit of the waters of the United States, but that's neither here nor there.
Daniel Palken:
What the Clean Water Act does in Section 401 is it basically it's regulating, there's words like discharge and activity. And this is kind of where the crux of it is, is what is meant by those words. Does a discharge mean you're actually putting something out of something? There's phrases like direct discharge, which don't show up in the law, but which sometimes show up in the regulation. Activity is obviously a broader word that shows up in the statute near discharge. And And so a lot of the fights are really around exactly how do you use the words activity discharge? Do you use words like direct in conjunction with them? Do you change the role of the states vis-a-vis the feds? And all of these things, especially kind of the wordplay things, have a lot of implications that probably won't be perfectly understood unless and until you enact a law and kind of see how it plays out. But the more you cabinet to the direct impacts of something on water quality, because some of what is at debate here is that blue states in particular have used the Clean Water Act to deny or consider denying pipelines, gas pipelines in particular, for reasons that don't really have to do with water quality directly. So sometimes you'll see a state like New York say, we have a climate law. And the climate law says you can't emit so much emissions. And we know this pipeline is moving gas and that gas is going to be emitted somewhere. So therefore, we can't certify this pipeline. And pipeline companies have cried foul at that. And so to fix that, you're going to have to play around with some of these words or otherwise change Section 401 of the Clean Water Act to make it so that states can't do that. There's other tactics, too. There's something called like the withdraw and resubmit tactic, where some states there's a statutory deadline in the Clean Water Act. It says you have one year if you're a state to respond to a request for certification from a developer. And so some states got the clever idea that instead of responding within a year, what you could do is at day 364, tell the applicant that their application was incomplete and they needed to submit more information and send it back to them. And then, you know, 364 days later, rinse and repeat. The courts have somewhat tamped down on that, but there's questions of would you want to apply some fix to that statutorily? And then there's a constellation of questions around that. But they all have the focus of making sure that the Clean Water Act really is about water, preserving the substantive protections, because that is something that I just think that Democrats and a lot of Republicans aren't going to want to change, and making it easier to build linear infrastructure in particular. And I think it will apply more in practice to pipelines than to transmission lines for reasons we could get into, but it has definite potential upside for transmission lines as well.
Robinson Meyer:
This recent addition to the process, the NHPA, the National Historic Preservation Act, This was not part of the discussion. So the National Historic Preservation Act, my understanding, is a procedural law. It requires the government to study kind of cultural sites, places of architectural significance, of which the definition can be quite broad, before it conducts a project. It requires various forms of consultation. It was not part of the permitting reform conversation, to my understanding, until Senator Lee introduced it as a topic perhaps six or eight weeks ago. What's kind of on the table with this law?
Daniel Palken:
Yeah, a little more than six or eight weeks ago. So he started with a hearing on it several months ago at this point. And, you know, to understand why this law kind of makes it into the debate, you want to understand a little bit of the inside baseball of congressional politics. A lot of how permitting reform has grown up has been shaped by the peculiar jurisdictions of the different committees as discussed, right? I think that it's a common fiction, but I think it's not correct that like transmission is the democratic ask and NEPA is the Republican ask, you know, and things like that. In reality, I think changes to both of those laws done well have meaningful upsides for both parties' priorities, as we've already discussed at length. But, you know, NEPA is in the Environment and Public Works Committee's jurisdiction and Transmission Federal Power Act is in the Energy and Natural Resource Committee's jurisdiction. So people are always looking for things, you know, when you're the chair of that committee or a member of that committee was to justify a vote, you're not getting to vote on the other part of the deal.
Robinson Meyer:
Crucially, Senator Heinrich, who has been on the show in the past year, is actually going to be on again in the next few weeks, is a big transmission advocate and is on the ranking Democratic member of Energy and Natural Resources. So lots of transmission policy has to flow through that committee kind of on the Democratic side, so to speak.
Daniel Palken:
Yeah. And so Senator Lee said, well, you know, I really, in my state, I've seen a lot of problems throughout the West with siting things due to the National Historic Preservation Act, which, as you know, is kind of this almost sister law to NEPA, but for historic properties rather than just other environmental harms. And the law was enacted around the same era as many of these other statutes. I think it was something like 1966. It's called a stop, look and listen law. So that's kind of the moniker it goes by. And what it requires you to do when you're an agency is if you have some federal nexus, so you're making some decision to permit something on your land or spend federal money, just like under NEPA, you have to first identify, you know, who the stakeholders are. So usually states and tribes, these offices called SHIPOs and TIPOs, state and tribal historic preservation offices. And then you identify the area that your project is going to impact. And then you identify any historic properties within that area. And then you have like a consultation process to see what, if anything, you're going to do about the potential impacts of your infrastructure on that. So sounds simple enough, but like the there's a lot of devil in a lot of details. So like when you build a transmission line, like the Sunzia line was famously held up in Martin Heinrich state of New Mexico.
Robinson Meyer:
A lot of the endgame delays in Sunzia came down to the use of the National Historic Preservation Act.
Daniel Palken:
Yeah, huge NHPA litigation that happened way more than six years after it kind of there was some somewhat novel jurisprudence on, you know, I said earlier, there's a six year statute of limitations that applies to NEPA. And also, you know, we thought to the National Historic Preservation Act. But the appellate court at the time overturned a district court and decided to rule that if the agency was kind of granting these decisions to move forward on specific construction steps, that itself was an independent agency action. And a new six-year clock was started each time an agency did that. So that project was something like 14 years into permitting when it lost an HPA suit. And it's now operational, right? It's supplying a bunch of energy, you know, through that power line. And it's still under litigation. And there's some risk that it could be stopped. They could tell that you have to shut down.
Robinson Meyer:
The organization, let's just put this in climate terms, the organization Archaeology Southwest, which has been leading a lot of that litigation, during the period of litigation, or at least quite recently, a pipeline was built through the same area. And I asked the head of that organization on the record, why are you fighting this clean energy project when a pipeline was built through the same area? And his answer was basically, well, the pipeline isn't like, it doesn't have big towers. And so I don't care about it. Like I care about the transmission line, even though notionally, this was an environmental protest. He was basically like, oh, pipeline, whatever, that's fine. And so there are ways in which, at least in the Sun Zia case, the NHPA wound up actually prioritizing the wrong kind of energy, so to speak.
Daniel Palken:
So there's a huge asymmetry is what you're getting at, which is correct, between objects that are tall and objects that are not tall when it comes to the NHPA. And you can just see this, there was a Ben Shiffman at the Institute for Progress just published a little explorer website like earlier this week in which he maps out what are the visual areas of potential impact. Yeah, the areas of visual impact that are considered for these different transmission lines, pipelines, gas producing projects, you know, what have you. And it turns out that the transmission lines, it's called an area of potential effect. That's how far away radially you look from the line. Pretty typical distance is three to five miles. For Sunzia, they did five miles. So you had to go five miles in either direction from the line in order to see is anything being visually impacted. If you're on the mall in D.C. near the historic buildings there, that's like worrying about the visual impact of something in Fort Tyne. Like that's a very far distance. And so for a line like Sun Zia, which is hundreds of miles long, the area swept out that they had to consider the impacts on anything of was about twice the size of Delaware.
And you would expect to see that pretty much any time you build a transmission line of comparable size, especially in the West where there's a lot of large open landscapes. Some of the lines in Schiffman's database had actually APEs up to 25 miles, and some of the offshore infrastructure had areas of potential effect of 40 miles or more. Some of them were set by the curvature of the Earth. This is a law that I think it's fair to say has, in certain cases, some excesses where you could apply a rule of reason and say maybe we don't need to look that far away in order to determine who is really materially suffering from this. And you're right. It does accrue more to tall infrastructure. So that's wind. But also solar has surprisingly far APEs. A lot of the solar has five miles. Anything that's within five miles can claim that there's some visual impact.
And then there's a whole process. Unlike NEPA, which has been litigated at the Supreme Court almost a dozen times, I don't think there's any major Supreme Court cases for the NHPA, which means the case law is a bit more incoherent and scattershot. One circuit says this, another circuit says it's actually kind of this way.
And so it depends where in the country you are. It's a less litigated law than NEPA. And it is particularly acute out West. Like when I've done kind of my own informal survey of developers where when this kind of came on the scene, I called up a bunch of transmission developers who I know and said, you know, is this law a problem for you? And the ones out east were like, you know, not that much. Sometimes there was one out east that said it had been a big problem. The ones out west, I actually wrote down the phrases. They used phrases like atomic risk and nightmare. There was really a lot of like this law is imposing a lot of burden on us and it's forcing us into these multi-party negotiations with dozens of states and tribes at once. And if any one of them decides that they don't like what we're doing, then there's a big lawsuit and it's potentially years in a Sunzia-like result. And so it's a big deterrent when you're trying to finance a big project and you go to a bank and they say, you know, well, what are the risks? And, you know, the few samples of transmission that have been built you can point to have things like the Sunzia case, which has been a real albatross there.
I think there's a zone of reasonableness on reforms to NHPA. I think, you know, I haven't spoken to the other side of this, but there are real tribal equities. We have not treated tribes well historically in this country. And I would be remiss not to say the NHPA is there for a reason. There's a lot of nexus with tribes. They have a lot of historic resources. Sometimes those resources are not on the reservation they live on because they have been forcibly moved in their history. And so they have a legitimate claim to say, well, we have a burial ground or we have sites that are sacred to us far from us. And that's all fair. And like you want to strike a balance with reforms to this law that make sure you really are capturing the things that are really important to people. But you are also recognizing we don't live in a tradeoff free world. And if we can carve out some of the more egregious cases, we can have a law that really works well enough for everyone.
Robinson Meyer:
I think it's important that the U.S. has made this commitment that basically before there's a big infrastructure project out west, we look to see that it's not going to build across. I mean, this is inspired by decades of cultural and ethnic cleansing, right? I mean, out west that like we write that like before there's a big infrastructure project built, you make sure that there's no major tribal equities there. I think the issue with Sunzia became that actually the developer of Sunzia had documented and found, and I think in some cases rerouted around major tribal equities, the claim that the archaeology Southwest was making was that the entire valley that this project had to cross through, in order to get was a historic resource and therefore, could not be moved through at all. And actually what they wanted to do was send the project into, a very, very low-income community in Tucson. It was a whole mess.
Daniel Palken:
And that's actually a really good microcosm of a lot of permitting, right? Because in permitting debates, you kind of end up of, well, do we build where there's nobody? But there are people who will come out and say, don't do that. That's pristine wilderness. Do we build where there are people? And people will say, don't do that. Those are your low-income neighborhoods in Houston. They have been burdened enough. Or maybe you think you can find some magic sweet spot where there's nobody, but there used to be people, so it's previously disturbed. But in those places, you can be sure somebody's going to make a historic preservation argument. So there's nowhere you can build without upsetting people. Now, that's not to say we should just throw up our hands and say, well, you can build anywhere now. But it really is like every parochial interest has a reason you shouldn't build near them. And what we need to do in this country, what policymakers should do, is say, we're going to make it somewhat easier to build in all of those places without treading on the things that are sacred about any of them.
Robinson Meyer:
I think that's right. And I found this whole episode quite radicalizing because for someone affiliated with the Center for Biological Diversity to tell me on the record that a valley, a massive valley, which was a beautiful place. I mean, I went to it while I was reporting on this story. It's a beautiful landscape. You cannot build a transmission line through a valley because that would hurt the entire valley as a cultural resource. But you could build a natural gas pipeline, Because that was just a little thing. It just went through the valley. If we are now at the place where it's like whole swaths of land are off limits to clean energy development, to transmission, to the clean electricity economy that we allegedly are trying to build to avert, global climate change, but it's fine to build fossil fuels there, then we might as well. I was just like, I can go home. I'm going to switch beats. You know, like if this is an amazing story.
Daniel Palken:
Yeah.
Robinson Meyer:
If this is what advocates are doing, I have to say, I got into this podcast being like, we're going to get talk about the pros and cons of permitting reform. Like we're going to talk about it. And now it has brought back reporting to me so viscerally that I've just been like, and then remember this.
Robinson Meyer:
Back during the Biden administration, during phase two of permitting, Congress passed these page limit and time limit restrictions. I think there's a sense that they didn't work or they haven't worked as well as maybe we had hoped. Why don't page limits, time limits work?
Daniel Palken:
I mean, I think it's a little it's a little premature to say, you know, so they were passed in May of 2023. I think we have seen time improvements. But the simple reason why, you know, there's two reasons why they don't work in a vacuum. One is that there were loopholes, which I mentioned. So the, you know, one year, two year timelines start when the agency determines that they're going to prepare a NEBA report, what's called the notice of intent stage. Well, an agency can simply defer doing that. So an agency can do a bunch of, quote unquote, pre-application stuff for as long as it wants. And then once it's been going two years, say we're starting the NEPA process. So that's a pretty obvious loophole.
The appendix loophole for the page limits you know if you have 10 000 extra pages of stuff you want to write you can put it in the appendix and circumvent the 150 page you know eis limit in that circumstance but the broader the more fundamental reason why time and page limits on their own are not likely to work is the reason nipa takes a long time is because when it doesn't agencies get sued sometimes for very legitimate deficiencies but sometimes for deficiencies that are quite small and probably wouldn't change by any reasonable person's estimation, the outcome of the agency decision. And if you're not changing any of that, if you're not saying that, you know, we're raising the bar on how big an error you have to make in order to have your decision overturned, but you're only saying you have to fit it into a shorter number of pages and do it quicker, you're actually potentially engineering a worse result. You're potentially engineering a result where agencies have to go quick and have to be concise. And by definition, that means missing certain things in the text, which creates all the more opportunities for litigants to come in and say, we're going to sue you. And then a court looking at existing case law in seven counties. Maybe helps with some of this, but it doesn't help with a lot of it because a lot of the things that Seven County appears to do, it does in dicta. It does in things that aren't part of the actual holding so that other courts are not bound to obey it. And different courts have really different feelings about NEPA. So the Ninth Circuit is generally a very progressive circuit and it interprets NEPA like a pretty left-wing organization that is willing to say, we don't want any of these things to go through unless everything is perfect. And the Fifth Circuit is a much more like oil and gas industry friendly circuit, which is willing to say almost anything can move. And you have a whole spectrum between those two. And so I think a lot of the reason those things don't work is because you need to actually change some of the substance of what's under consideration and how it's under consideration in order to get the results you're driving at through the page and time limits.
Robinson Meyer:
Something I've heard about this go at permitting reform is that this might be it. Now, maybe that isn't true. But what I've heard is basically, you know, next Congress, it's unlikely to be as productive for permitting reform as this Congress will be. Of course, something I've also heard is that if Democrats want to set themselves up to do big public investments in the energy system, when the next president takes office, whoever that may be in 2029, then you need to get the statutory changes. And now because the implementation will then take long enough that it won't really start to kick in until 29.
But why is it important that this happens now that this Congress finds a deal as opposed to future Congresses?
Daniel Palken:
This goes back to more inside baseball, but like, you know, the Senator Whitehouse and Senator Heinrich, we mentioned near the top are two Democratic senators who are really eager to find if there's a workable bipartisan space for a deal by all outward indications. You know, it's not a given that every Democrat and every Republican, for that matter, you know, feels exactly that way. So part of it is just we have a cadre of four senators at the top of these committees on both Democratic and Republican side who are really approaching this constructively and in good faith. That doesn't mean success is guaranteed, but there's going to be turnover next Congress. So with Senator Durbin, who's currently the head of the Judiciary Committee retiring, there seems to be a good likelihood that Senator Whitehouse will head over to the Judiciary Committee. And then you'll likely get someone like Senator Merkley atop the Environment and Public Works Committee. Now, Senator Merkley is by some measures on environmental issues, the most progressive senator.
It just may be hard for him to find a bipartisan deal space between someone like Senator Merkley on the one hand and something that like President Trump might sign off on on the other hand. The usual status quo in D.C., the default assumption we should have is that there's a non-overlapping Venn diagram space between Democrats and Republicans on any given issue that like isn't NDAA and doesn't have to pass. And the reason we know that is because most issues don't pass major reforms in their space most years. And so the presumption should be that it's very hard to pass something. And then in the House, you have a situation where, you know, if you go on polymarket, it will tell you that Democrats have a meaningfully better than not chance of taking the House. And I think that the people who will chair the relevant House committees, I think there's some level of interest in exploring permitting reform, but they haven't been at it, you know, for as long in the way that Senator Whitehouse and Heinrich have. And I kind of think that we have been very blessed with some senators atop these committees now that really have a vision on this, right? I haven't said this explicitly, but one of the things that really is the motive force that is enabling permitting to happen is that both sides don't agree on much, but they agree on one crucial fact, which is that their resources are better than the other side's resources. Republicans have an absolute conviction that in a free market that, you know, gas and coal and sometimes nuclear will outcompete, you know, Democrats' resources. And Democrats have an absolute conviction that wind and solar and sometimes nuclear will out-compete Republicans' resources. And, you know, the market is going to determine who is correct on that. But the fact that both sides – and it's good that both sides – we would want – you know, it would be weird if people were supporting resources they had no confidence in. The fact that both sides have confidence in their resources is kind of what is enabling this to happen in the first place. Because if either side, like, firmly believed that the other side's resources were better, they wouldn't want to do something necessarily that enables the other side. So those are kind of the elements of what I think makes this Congress a particularly ripe environment. And also there's one other thing, which is next Congress is a presidential election cycle. And it's harder to do something much harder the closer you get to a presidential election where everybody's distracted versus a congressional midterm election.
Robinson Meyer:
From the deal, as you currently understand it or think it might look like, who are the winners and losers of this deal? Can you answer that?
Daniel Palken:
I think it's a very positive some deal. So I'm going to name for you a lot more winners. And I don't think there are truly any losers of a permitting deal. I'm not just saying that to be diplomatic, but I do think there are some constituencies that get nervous enough that they perceive themselves to be potential losers. And it's the job of government affairs departments for companies, right? We'll get into this in a second. But like if you're in the government affairs department of a company and there's a deal that's moving along and like the median outcome, if you go 10 years down the road, is like there's a more thriving, vibrant economy that's cleaner and that you get more of an opportunity to compete with
Robinson Meyer:
50 other thin margin. That's not your job at all.
Daniel Palken:
You don't care about any of that. You could be fired overnight if it's found out that you let a law pass that, you know, caused your company to have even one project canceled or bid out to somebody else. So there's a huge small C conservative bias within companies, especially in heavily regulated businesses like utilities, where a lot that happens is downstream of what FERC and the federal government's rules are. So, you know, first, let's talk about winners, right? Winners are anybody that's trying to build this infrastructure within the confines of what are still very important substantive and procedural requirements on how to conduct business. But it has just become very hard to build things in the United States. And, you know, another winner, therefore, is all of the kind of demand side industries that depend on cheap, affordable, abundant, available, resilient, reliable electricity. Right. So that's everybody from the very largest data centers and aluminum smelters to you and me. It will be a brighter, better future for you and me and our electric bills, I believe, in the medium to long run if we pass reforms that grow the headroom on our grid so we're not constantly in a situation where supply is short of demand on a very inelastic good, which leads to, of course, very high prices. And then national security is a big winner. You know, I talked earlier about what if we live in a world where You know, China has access to the zero-day hacks of all of the bedrock software of our utility and water and military systems, and we have none of that because we're two years behind them on a technology that, you know, doubles in its quality every six months. And to say nothing of electricity's role in being able to manufacture advanced technologies of the future, you know, warfare for better or worse seems to be largely a contest of drones fighting other drones in foreign theaters and having the energy supply to be able to manufacture these things and keep up with China is no small task that we have ahead of us because they're the most formidable manufacturing power in the world today. So there are a lot of winners when it comes to everybody from individual, you know, residential rate payers to medium to large companies to the nation's security footing as a whole to, you know, workers, both union and non-union go down the list on the side of, you know, are there people that potentially oppose this or view themselves as losers? I don't want to paint with a broad brush here, but there are parts of the environmental constituencies, folks like you were talking about earlier, who litigate these projects, often for some reason indiscriminately litigate the ones that are associated with non-emitting energy sources even more, who will see taking away those litigation hooks and making it so we build more of these things and it's harder to challenge them for sometimes frivolous reasons as a negative. So there's definitely that constituency. Then there's the question of utilities. And, you know, when it comes to utilities, you really can't paint with a super broad brush. Where each one stands depends on where each one sits. But at a high level, it's counterintuitive that utilities would be the stakeholder group of all groups that is like, we don't like transmission. Because the first thing you learn about utilities and utility class is they like building things. They want to build more infrastructure so they can put more stuff into rate base and make a greater regulated return. Transmission is a thing that they build, so why don't they want more transmission built? And the reason is that the types of transmission we're talking about trying to build in a bill or what are called regional and particularly inter-regional transmission. By definition, regional and inter-regional transmission is transmission that goes between utility service territories. So by definition, it is not within any one utility's territory to serve.
And therefore, there is no obvious God-given reason why the home utility would get to build that transmission because there is no one home utility. And in fact, in recognition of the fact that there's no such God-given reason, regulators at the Federal Energy Regulatory Commission have created rules where if a line is above a certain size or insignificance, it gets bid out competitively. And utilities would, in the main, rather not have that happen. They would rather have a monopoly on lines, and so they would rather build within the territory. That's the first reason. The second reason is that even worse than being a line that bridges multiple territories and therefore doesn't necessarily get to get built by you, whatever's on the other side of it doesn't get to get built by you. Maybe it's just picking up spare power that's being curtailed in another region. Maybe somebody is building a gas plant or a wind farm or a nuclear plant or a geothermal on the other side of it. But that somebody probably isn't you because that somebody isn't in your territory. So there's a bit of a market failure here where like we try to run an electric sector, but, you know, the electric sector is a mix of kind of market forces. We have these things, you know, these RTOs that really create functional markets and then, you know, old school monopoly vertical integration and transmission is some weird thing that occupies a hinterland between them where it's like, you know, territory on territory competition. It's we're linking up these territories. So they kind of, even if they don't want to, there's a kind of rudimentary form of competition where one is just naturally positioned to sell into the other, which is a good thing for consumers, which is why the hyperscalers down to a lot of just ratepayer advocate groups all support the transmission side. But there are definitely parochial interests. Now, I personally view that as like overstated. I think that a growing pie is good for everybody, including the utilities. And utilities have a much brighter future in a world where the U.S. Is able to structurally grow load, which is synonymous with structurally growing the economy at a healthy clip over the next several decades. And people are falling into this government affairs staffer trap where they're mitigating against the unlikely outcome that could get them fired one day, rather than thinking about the kind of median growth trajectory of the company. But that's kind of my answer to your question of who are the perceived winners and losers.
Robinson Meyer:
Well, there's so much more we could talk about, but we're going to have to leave it there. Daniel Falcon, thank you so much for joining us on Shift Key. This has been a fantastic discussion.
Daniel Palken:
Rob, thank you for the conversation and thank you for having me.
Robinson Meyer:
And that will do it for us this week. We'll be back later this week, I think, with the new episode of Shift Key, but don't hold us to it. It's a it's a funny season here. Stick around for the end of this episode, by the way. We have a whole great conversation between Heatmap Labs and former Energy Secretary Jennifer Granholm, Just join the board of our sponsor, Tandem PV. Stick around for that.
Daniel Palken:
It should be great.
Robinson Meyer:
Until then, ShiftKey is a production of Heatmap News. Our editors are Jillian Goodman and Nico Lauricella. Multimedia editing and audio engineering is by Jacob Lambert and Nick Woodbury. Our music is by Adam Kromelow. Thanks so much for listening. We'll see you soon.
Jennifer Granholm:
Tandem PV has shown over 30% efficient, which means roughly a 20 to 40% more electricity from the same footprint, depending on what you're comparing it to. That is game-changing. And, you know, for people who are listening, why does it matter that it's so much more efficient? Because every additional percentage point of efficiency lowers the amount of land and steel and wiring, and labor, and installation, all of that needed for every megawatt that you build. And that means lower costs, and that means faster deployment.
Mike Munsell:
That was Jennifer Granholm, the former Secretary of Energy, former Governor of Michigan, and newly minted board member of Tandem PV. And I'm Mike Munsell, HeatMaps Vice President of Partnerships. In today's conversation, I sit down with Secretary Granholm and Tandem PV CEO Scott Wharton to discuss why Granholm is so excited about perovskites. Secretary Granholm, Scott Wharton, welcome to Shift Key.
Scott Wharton:
Hi.
Jennifer Granholm:
Thanks so much.
Mike Munsell:
Jennifer, how did Tandem PV and Scott first get on your radar? And what was your first impression of the company?
Jennifer Granholm:
As you can imagine, I've spent the last several years talking with companies across the clean energy ecosystem. And after leaving government, I wanted to stay close to the technologies that I felt could really move the needle. So I happened to be a big fan of perovskite technology. And I met Saritha Peruri, who's part of Scott's team at Tandem at a clean tech event. And she invited me to visit. Plus, they were a DOE-supported company, so I knew they were good because companies don't get DOE support unless their technology has been thoroughly vetted. And people I respect kept mentioning them as one of the most exciting next-generation solar companies. Then I met Scott and the rest of the team. And Scott has such an interesting background because he comes from a tech-to-manufacturing perspective. And so what struck me wasn't just the science, although, of course, the science is remarkable. It was that Tandem was obsessed with manufacturing and commercialization. Former governor of Michigan, I'm obsessed with manufacturing in the United States. I've certainly seen a lot of breakthrough technologies that never make it out of the lab. And Tandem was singularly focused on how you can actually build an American company that can compete globally. That sold me.
Mike Munsell:
And now you're on the board. So I guess, Scott, on your side, why did you think Jennifer was the right person to join Tandem's board?
Scott Wharton:
Well, like a lot of people listening here, I got to know Jennifer from watching her on TV and obviously being our energy secretary. And from that, I had a positive experience. But I really, as I got to know her better, I had an even more positive experience. For example, when Jennifer came on the factory tour with us, a lot of the other people with her stature would come with a big entourage and come with a lot of the answers. But I found that she came by herself and she's incredibly down to earth and asked a lot of thoughtful questions, very respectful for the team. So I just became more impressed with her. And then we actually had a dinner together with Saritha and really just got to know her better as a person than I was sold. And I'm so pleased to have Jennifer as a partner and on the board.
Mike Munsell:
Jennifer, you've seen a lot of clean energy companies over the years through your role as Secretary of Energy, Governor of Michigan. What made you want to go beyond being supportive and actually join the board?
Jennifer Granholm:
Great question. I mean, I've actually been more selective about where I spend my time. And for me, I guess three things have to line up. First, the technology has got to solve a real problem, not just be incrementally better, but really solve a problem. And then second, the leadership's got to be exceptional. And third, there has to be a path to manufacturing at scale. And Tandem checked all three of those boxes. We're entering into an era where obviously electricity demand is growing because of AI and advanced manufacturing and electrification. And we need dramatically more electricity. And of course, the fastest and cheapest source we have today is solar. So making every panel significantly more productive has enormous implications. You know, people sometimes ask whether I'm optimistic about meeting this moment. And I truly am because innovation has always surprised us. And Tandem is definitely one of those innovations I'm really proud to be affiliated with.
Mike Munsell:
Let's dive into that. For listeners who may not follow solar closely, what should they understand about perovskite-silicon tandem solar cells, and why does it matter now?
Jennifer Granholm:
Yeah, I think about it this way. I mean, today's silicon solar panels are already one of the cheapest ways to generate electricity, if not the cheapest. But they are approaching sort of practical limits of how much sunlight they can convert into electricity. And perovskite allows you to capture parts of the solar spectrum that silicon alone doesn't capture efficiently. So by stacking the two materials together, you get substantially more electricity from the same panel footprint. And today's commercial silicon panels are generally in the low 20s for efficiency. The very best maybe are around 25%. Tandem PV has shown over 30% efficient, which, you know, means roughly a 20 to 40% more electricity from the same footprint, depending on what you're comparing it to. That is game-changing. And, you know, for people who are listening, why does it matter that it's so much more efficient? Because every additional percentage point of efficiency lowers the amount of land and steel and wiring and labor and installation. All of that needed for every megawatt that you build, and that means lower costs, and that means faster deployment. And at a time when we're trying to power AI data centers and factories and communities, while affordability is on the tip of everybody's tongue, this is exactly the kind of innovation that we need.
Mike Munsell:
And after your secretary of energy role, you could be spending your time on a lot of different things. When you decided to join Tandem's board, you were making a real bet on the company and on this moment in clean energy.
If we're talking five years from now, what would make you say that was exactly the right bet?
Jennifer Granholm:
I love this question. I'd measure it in a few ways. I'd say first that in five years, Tandem is manufacturing at meaningful scale here in the United States. And they've already started, but really taken this whole technology to scale. I want us making the technologies of the future and not importing all of them. I want us in the United States making those. So that's number one. Second, that utilities and businesses and homeowners are getting more affordable electricity because higher efficiency solar is driving the cross down. That would make me super happy five years from now. And then maybe one other thing, which is, you know, I would love it if people look back and say that this was one of those technologies that changed the economics of clean energy. You know, solar is cheap, and this can really take it to the next level. When we invent and we build and we manufacture, America wins. And if in five years from now, Tandem has helped to prove that advanced solar can be invented here and manufactured here and deployed around the world. I will feel very good about this decision.
Mike Munsell:
And how would you feel about that, Scott?
Scott Wharton:
I think I feel pretty good, too.
Jennifer Granholm:
I would hope so.
Scott Wharton:
It's like we're on a path to do it, a lot more to do, but that's the dream I think we should hear.
Jennifer Granholm:
Yeah, it's exciting, exciting times.
Mike Munsell:
Anything else either you want to touch on?
Scott Wharton:
Just really grateful for having the partnership with Jennifer and look forward to realizing all the things we just talked about.
Jennifer Granholm:
Amen, brother.
Mike Munsell:
Well, thank you so much for taking the time today.
Scott Wharton:
Thank you.
Jennifer Granholm:
Thanks so much, you guys.
Mike Munsell:
That will wrap up our mini-series with Tandem PV. If you missed any conversation, tune in to the previous two episodes of Shift Key. Thanks for listening.


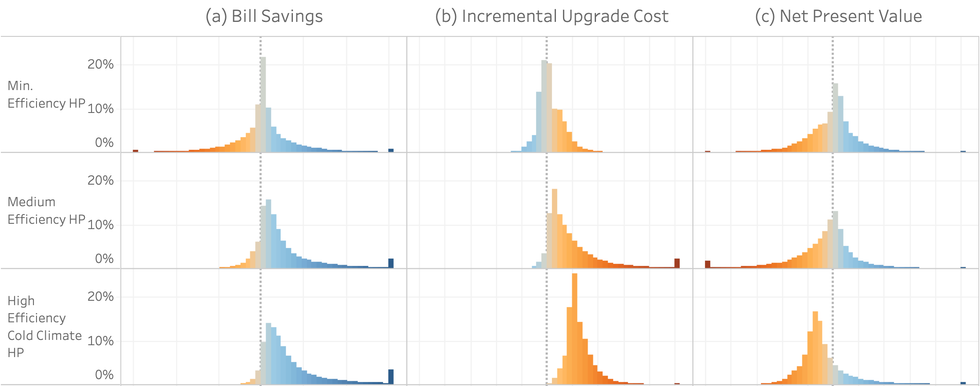 Distribution of energy bill savings, upgrade costs, and unsubsidized net present value, relative to a reference equipment replacement scenario, using energy prices from winter 2021 to 2022 Courtesy NREL / Wilson et al., Heat pumps for all? Distributions of the costs and benefits of residential air-source heat pumps in the United States, Joule (2024),
 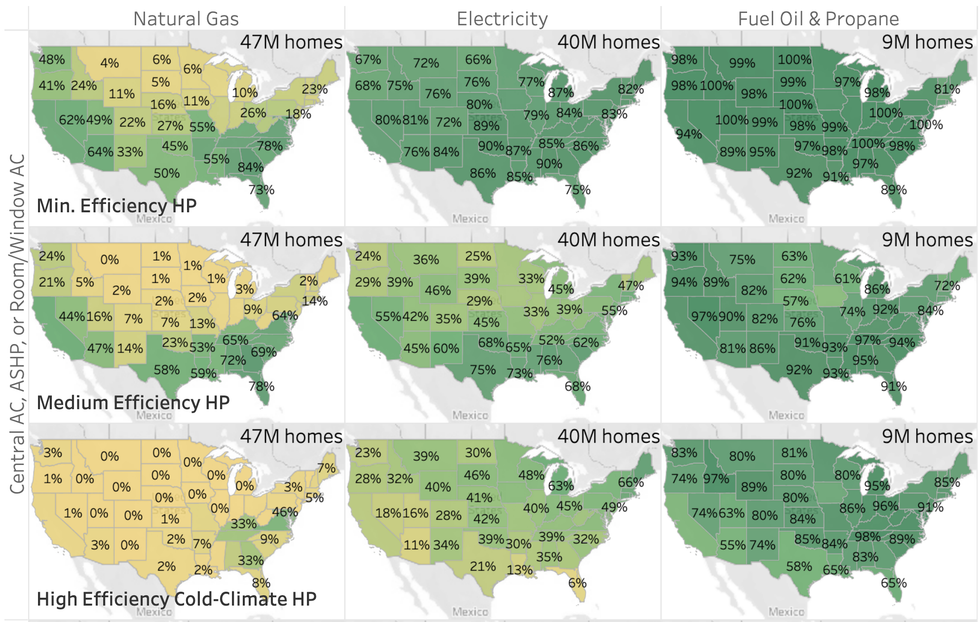 Percentage of homes that currently have air conditioning that will see a positive cash flow from switching to a heat pump from natural gas, electricity, and fuel oil and propane. Courtesy NREL / Wilson et al. 2024
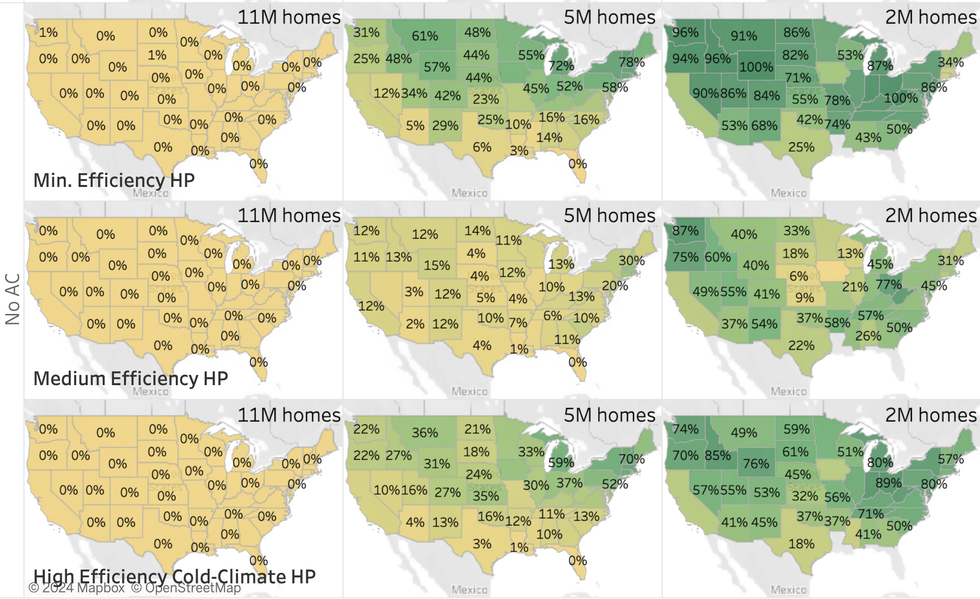 Percentage of homes that do not have air conditioning that will see a positive cash flow from switching to a heat pump. The first column is homes that currently use natural gas, the second column is those that us electricity, and the third is those that use fuel oil and propane. Courtesy NREL / Wilson et al. 2024


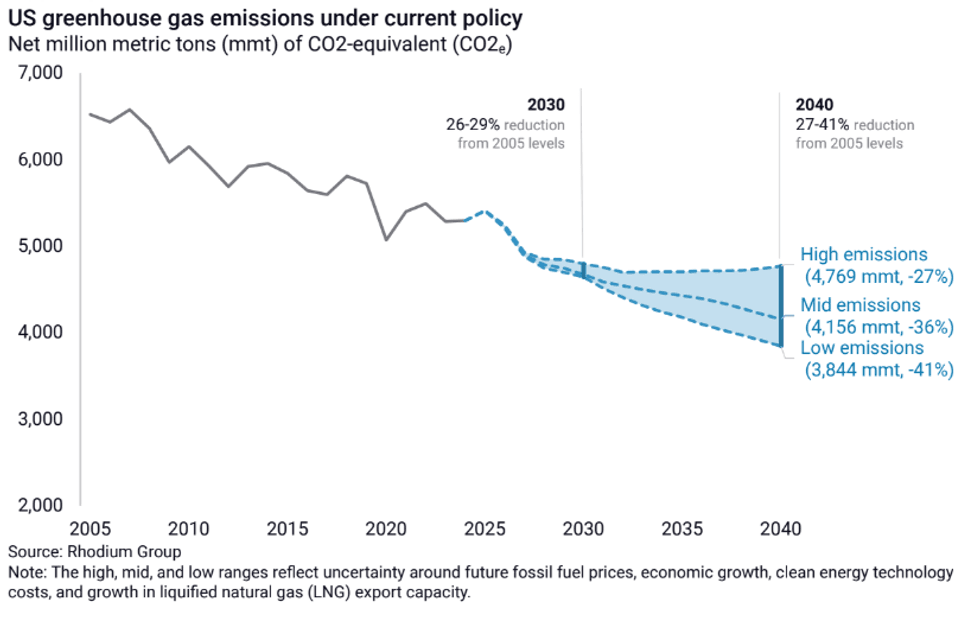 The 2030s crossroads.Rhodium Group