More than 200 pending data center projects are now being fought at the local level nationwide. This could mean that a project faces lawsuits, physical protests, contentious public hearings, or an ad campaign.
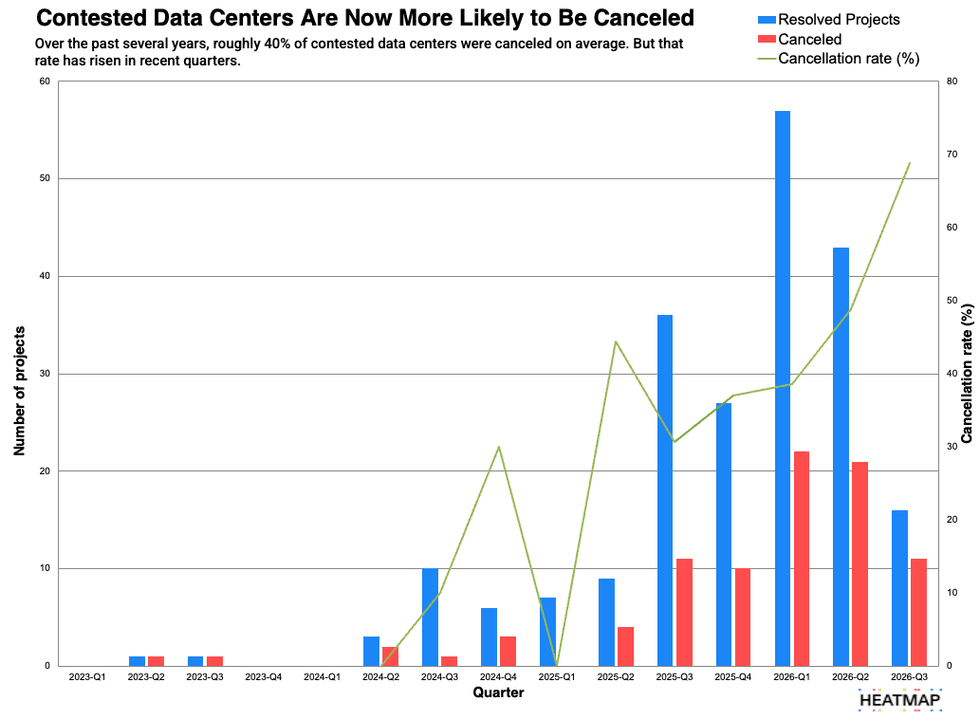
About 430 data center projects have been contested over the past five years, including the roughly 200 that are currently being fought, the data shows. Roughly 40% of data center projects that faced some kind of local challenge over that period were eventually canceled, according to Heatmap Pro data.
But that figure has gone up in recent months. Today, a data center project that’s challenged by local activists has about a 50% chance of being canceled. A contested data center now has roughly the same odds as a contested solar or wind farm of getting canceled, Heatmap Pro data suggests.

Data center proposals of every size have faced major delays and cancellations this year. Earlier this month, a sprawling campus that would have built 37 data center buildings near Manassas National Battlefield Park in Virginia was canceled after sustained local protest.
Even the economy’s largest companies have abruptly withdrawn major projects following opposition. Amazon, Microsoft, and Google each canceled large-scale proposals after sustained pushback in Arizona, Wisconsin, and Indiana in the past year. Susan Li, the chief financial officer at Meta, described the infrastructure building environment as “dynamic and uncertain” on a quarterly earnings call this week.
Some analysts have cautioned that the worsening development environment — and snarled supply chains — could imperil the overall artificial intelligence boom. Earlier this year, a JPMorgan report warned that 60% of data center capacity slated to open in 2027 had yet to start construction as of early June.
“Even the major developers are having trouble with projects, but you always have trouble with projects,” Freed said. The question is whether developers have enough proposals in their pipeline to keep up with surging demand, he said.
“I think the answer is mostly still yes. But it’s getting harder to find,” he added. “The impact is increasingly that developers are stopping efforts in those communities [that pass restrictions] and shifting their attention elsewhere.”
State-to-state cancellation rates can vary significantly. Some 71% of contested data center proposals in Michigan are eventually canceled, as are 56% of challenged projects in Indiana, according to Heatmap Pro data.
By comparison, about 17% of challenged data center projects in Texas are canceled.
Polling suggests that Americans want much more strict data center regulation than is in place right now. About six in 10 Americans would support a data center moratorium at the national, state, or local level, according to Heatmap Pro polling.
Majorities of self-identified Democrats and MAGA Republicans would support a ban at all three levels of government. So far only one state, New York, has adopted a moratorium on new data center permit approvals. That one-year ban is not included in this survey of county and municipal restrictions.
Why moratoriums matter
The hundreds of laws restricting data centers may not be a permanent feature of U.S. land use laws. Many of the ordinances are — at least on paper — set to expire in the coming year to give local officials time to create their own schemes for regulating data centers in the absence of federal regulation.
But many restrictions on wind and solar energy were also initially described as temporary. Officials have still renewed them year after year in order to avoid dealing with a controversial issue.
Even when local moratoriums do not always kill projects, they can ensure that an already troubled project gets the boot.
Last year, the housing developer Deltona Corp. sought to build a 1,300-acre data center campus roughly 50 miles north of Tampa. Citrus County commissioners passed a 12-month moratorium on new data centers, but that law didn’t apply to the proposal, which was already pending and therefore exempt.
But when the county planning commission rejected a rezoning proposal for the site months later, it effectively killed the proposal, which could not file a new application without becoming subject to the moratorium.
“The people are not ok with this and clearly some, if not all, of the commissioners are also not ok with this,” Holly Davis, a county commissioner, told the local paper at the time.
Even relatively small data centers can face obstacles. After the University of Michigan bought 120 acres in a light-industrial area of Ypsilanti Township, Michigan, to build a data center, local residents — and municipal officials — vowed to battle the project.
Residents worried about the data center’s energy use, noise levels, environmental impact and its potential security risks. (The facility will be run with Los Alamos National Lab.) But the facility, at its largest, will demand 110 megawatts of electricity — much smaller than most artificial intelligence data centers.
“There’s literally not a conversation that I have, not a stop that I make, where data centers and AI don’t come up,” Abdul El-Sayed, a Democratic candidate for Michigan’s U.S. Senate seat, said earlier this month. He has not endorsed a data center moratorium, but has said projects should have mandatory “terms of engagement.”
The public’s turn against data centers has been swift. In just nine months, Americans swung 49 points against supporting a data center in their area, according to Heatmap Pro polling from the spring. Other polls have shown similar shifts.
A majority of Republicans, Democrats, and independents now say they would oppose a data center proposal in their area.
Yet even with the new surge of bans, most of America remains open — to some degree — for business. More than 90% of counties nationwide have not banned or significantly restricted data centers.
“I don’t think we’re anywhere close to a breaking point yet,” Freed said. “It’s still a big country.”


 A transformer factory in Jiangsu Province, China. Costfoto/NurPhoto via Getty Images