You’re out of free articles.
Log in
To continue reading, log in to your account.
Create a Free Account
To unlock more free articles, please create a free account.
Sign In or Create an Account.
By continuing, you agree to the Terms of Service and acknowledge our Privacy Policy
Welcome to Heatmap
Thank you for registering with Heatmap. Climate change is one of the greatest challenges of our lives, a force reshaping our economy, our politics, and our culture. We hope to be your trusted, friendly, and insightful guide to that transformation. Please enjoy your free articles. You can check your profile here .
subscribe to get Unlimited access
Offer for a Heatmap News Unlimited Access subscription; please note that your subscription will renew automatically unless you cancel prior to renewal. Cancellation takes effect at the end of your current billing period. We will let you know in advance of any price changes. Taxes may apply. Offer terms are subject to change.
Subscribe to get unlimited Access
Hey, you are out of free articles but you are only a few clicks away from full access. Subscribe below and take advantage of our introductory offer.
subscribe to get Unlimited access
Offer for a Heatmap News Unlimited Access subscription; please note that your subscription will renew automatically unless you cancel prior to renewal. Cancellation takes effect at the end of your current billing period. We will let you know in advance of any price changes. Taxes may apply. Offer terms are subject to change.
Create Your Account
Please Enter Your Password
Forgot your password?
Please enter the email address you use for your account so we can send you a link to reset your password:
Pollution from peaker plants combined with heat and smoke can push summer air quality into the danger zone.

If you ever have to pick a day to stay inside, pick July 5. In cities across the United States, the Fourth of July’s pyrotechnic revelries make the wee hours after Independence Day consistently one of the worst of the year for air quality. Just look at Washington, D.C., which briefly held the distinction of having the world’s most polluted air this past Sunday morning following one of the largest firework displays in history.
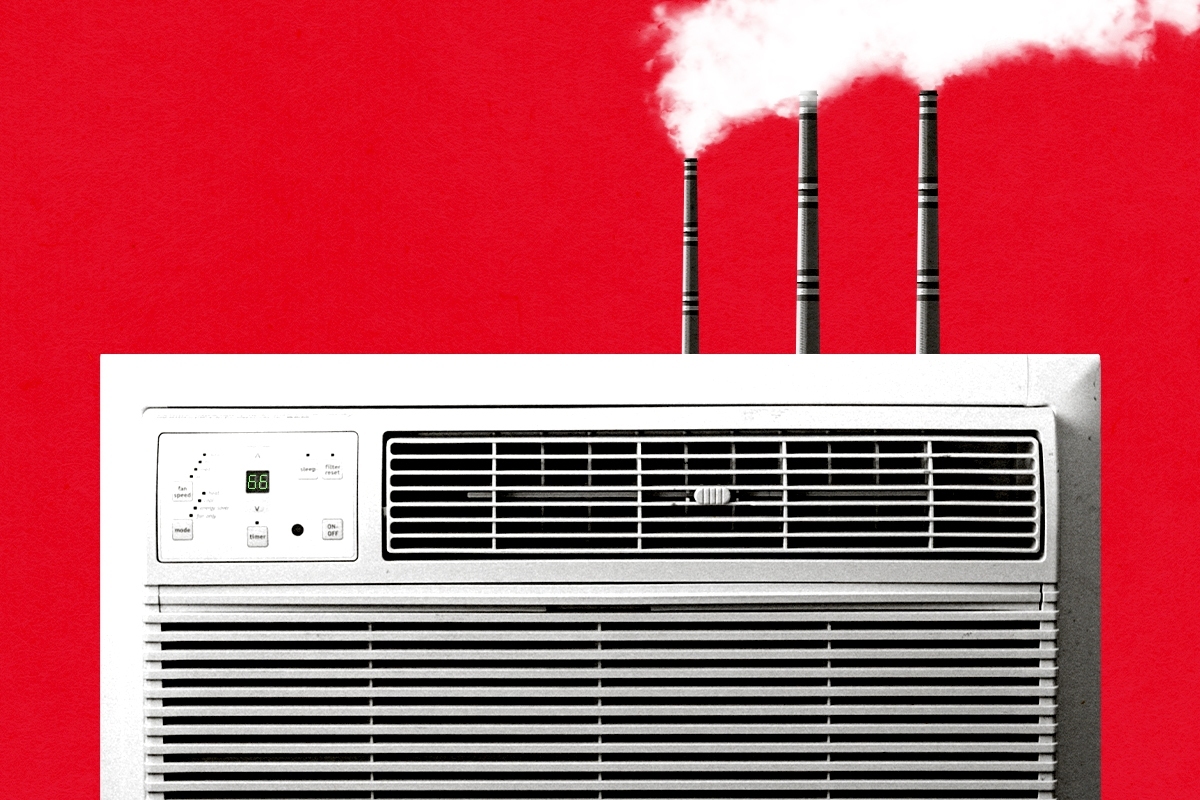
But if you have to pick a second day to stay inside, shoot for one during the second half of July, which is the hottest period of the year in the United States. For one thing, it’s just plain miserable out. For another, the country’s 1,000 or so peaking power plants, or “peakers,” are more likely to be operating to meet the energy demands of heavy air-conditioning use, emitting disproportionately high levels of pollution for the electricity they generate.
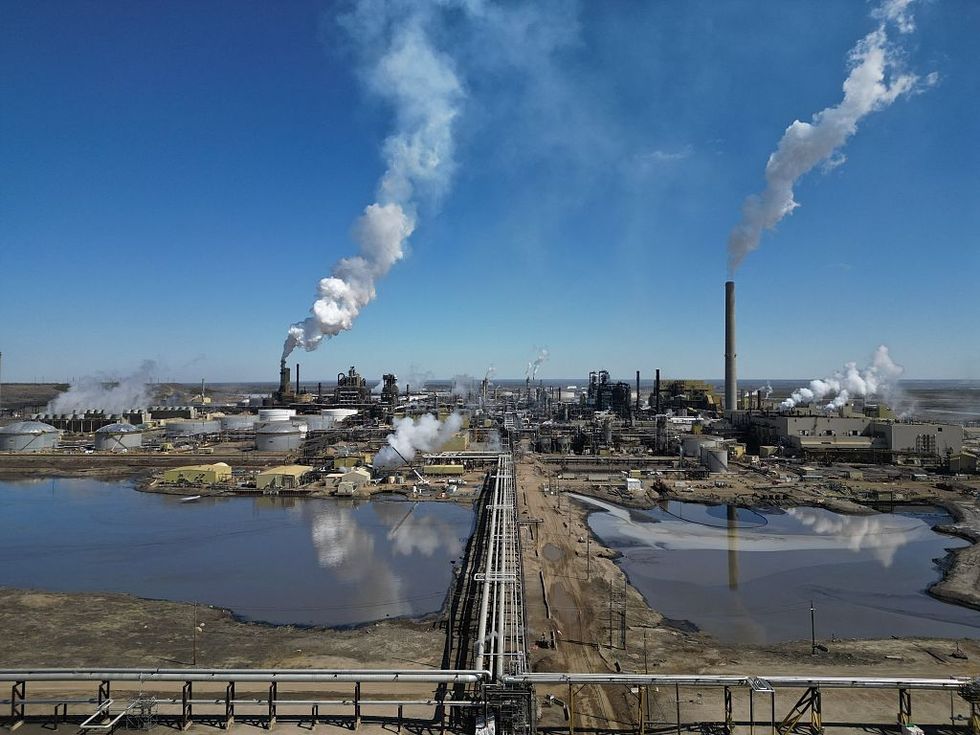
Peakers are the backup power sources operators run only when demand is at its highest, such as during a heat wave. Peakers are also “probably the dirtiest and most expensive energy on the grid,” Abbe Ramanan, who leads the Phase Out Peakers project at the nonprofit Clean Energy Group, told me. “They tend to burn dirtier fuels, such as oil, and typically have older and less efficient emissions control systems.”
Some 63 million Americans live within a three-mile radius of a peaker, according to a 2023 Clean Energy Group report, where they face health conditions including “significant … increases in estimated rates of hospitalization for asthma, acute respiratory infection, and chronic obstructive pulmonary disease,” all conditions associated with proximity to fossil fuel-fired plants. On top of that, historic redlining practices mean two-thirds of peakers are located in communities with a higher percentage of low-income households than the national average, according to the group’s reporting. And yet peakers also provide life-saving power and AC when a blackout could mean death, such as during last week’s heat wave on the East Coast, making them simultaneously a menace and necessity to maintaining public health, at least with our current grid.
What exactly is peaker plant pollution? How does it appear in the Air Quality Index you might see on your phone? And how do local regulators consider pollution when issuing air quality forecasts? I set out to get answers.
To understand peaker plant pollution, let’s start with a refresher on how air quality alerts work.
The AQI scale runs from 0 to 500 and reflects the local concentrations of five major pollutants: particulate matter, ozone, carbon monoxide, sulfur dioxide, and nitrogen dioxide. Each pollutant has an Environmental Protection Agency-regulated benchmark for what is safe (many of which are set at levels clean air advocates argue are too lax). As concentrations increase, the overall AQI rises to warn first “sensitive groups” and then the general public when to take precautions, such as limiting outdoor activity or wearing a mask. (To learn more about the AQI scale, read my colleague Emily Pontecorvo’s explainer here.)
As do all fossil fuel power plants, peakers release planet-warming carbon dioxide as a byproduct of combustion, along with nitrogen oxides, particulate matter, volatile organic compounds, and other trace toxins that aren’t captured in the AQI, such as heavy metals. Oil and coal-fired power plants also release sulfur dioxide, which creates acid rain; natural gas-fired plants, on the other hand, emit comparatively little.
While NOx is an irritant in its own right, it is, more significantly, a key ingredient in the chemical reaction that creates ozone. When NOx mixes with volatile organic compounds — found in vehicle exhaust, personal care products, and yes, also power plant emissions — on a warm, sunny day, the chemical reaction creates ground-level ozone, which is corrosive enough to scar lung tissue with repeated, prolonged exposure. An expert once helpfully likened it to me as “sunburn on your lungs.” Health researchers have determined that, globally, ozone (also known as smog) causes a million premature deaths every year.
Yes, although it’s not an easy or neat measurement.
Peaker plants are used to rapidly supply electricity to the grid when demand exceeds the baseload capacity. As a result, they run infrequently — only about 5% of the year, or 464 hours per plant, in 2022, per Clean Energy Group’s analysis of 2022 EPA data. Using a stricter definition of peakers, the Government Accountability Office found that the plants represent nearly a fifth of the nation’s potential generating capacity but produce only about a 30th of its overall electricity, mostly due to the time they spend sitting idle.
Power plants use a number of emission control systems to limit emissions of various pollutants. But the EPA has much looser requirements for low-operating peakers, which “may not have effective, if any, emissions control technology,” the GAO writes. When operational, peakers emit an estimated 60 million tons of CO2 per year, with a median NOx emission rate about 6.1 times greater per unit of electricity generated by natural gas-fueled peakers compared to non-peaker gas plants.
“One really big issue with peakers is the emissions control systems are not operating during times when the plant is starting up or shutting down, which means that emissions are just unabated during those times,” Ramanan told me. “And because those plants tend to operate in short bursts, such as during a heat wave, they will start up and shut down more frequently.” Even up to a day beforehand, when the plant is running its test cycle, it might be emitting pollutants even while not actually providing any power.
One 2017 study by University of Wisconsin–Madison researchers found that across the Eastern U.S. from 2007 to 2012, total electricity generation rose by about 4% for every 1-degree Celsius (1.8-degree Fahrenheit) increase in daily summer temperature, with NOx correspondingly up 3.6% and CO2 up 3.3%. Though these numbers aren’t peaker-specific, the plants represent a disproportionate share of the rise since they’re reserved for the hottest, heaviest-load days.
Though the slower rise in NOx suggests “slightly cleaner plants … on average,” the authors write, that is “not completely unexpected, as new natural gas plants are required to have controls installed even as some peaking plants do not.” They note, however, that their data does not fully capture grandfathered-in units, since gas- and oil-fired peakers are allowed non-direct-measurement reporting.
In fact, in Maine and Connecticut, which “use more petroleum for electricity generation than most states in the U.S., primarily as peaking plants deployed on the hottest days,” NOx jumped 33% and 23% per degree Celsius, respectively. Separately, a 2016 study found that peaking plants may have accounted for up to 87% of local particulate matter in the PJM Interconnection during a July 2006 heat wave.
Peaker plant pollution is significant enough that chronic exposure in local communities has measurable health impacts. But how does it factor into summer AQI levels?
My colleague Matthew Zeitlin spoke this week with Margaret LaFarr, the New York State Department of Environmental Conservation’s director of air resources, who told him that peaker plant pollution is “one of the factors we consider” in formulating its air quality forecasts. But because the state’s agency uses modeling to predict when and where air quality will be poor, the granularity of a single peaker just isn’t there. “If we have to have specific information on the emissions, it would not be ready in time for a timely advisory,” LaFarr said.
Ramanan, whose nonprofit has diligently recorded the negative impacts of peakers, concurred that it is “difficult to pinpoint just how much peaker plants contribute to local air pollution because those sorts of studies are just very expensive to do.” Studies that look at disproportionate health impacts, on the other hand, are a little simpler to put together.
Additionally, while the AQI might rise locally near peakers during a heat wave, because of the nature of the scale, it can’t neatly distinguish why. A high ozone reading, for example, might just as easily be due to tailpipe emissions on a hot day; in the New York metro area, vehicles are responsible for an estimated 60% of the air pollution. Meteorological conditions — whether it’s sunny, a key factor in ozone formation, or which way the wind is blowing — obscure the picture. Particulate matter readings could be from a peaker, for example, but they could just as easily be from wildfire smoke.
One way air quality activists like to think about peaker pollution is as a co-occurrence — that is, a compounding pollution on top of already degraded conditions. Hot days tend to be the worst for ozone already, because of the aforementioned tailpipe pollution; peakers, activated to help with the heat-related energy load, then release more ozone-generating emissions at the worst possible time.
While a precise breakdown of the AQI might not be there for peakers, “we know the days that are more conducive to ozone formation generally tend to be those same days where people are cranking up their ACs and there is a higher demand for energy,” LaFarr said.
There is some speculation that cleaner input fuels could help reduce the worst peaker plant emissions. Generally, this is true: The 2017 study by the University of Wisconsin–Madison researchers found that from 1997 to 2015, in Texas, petroleum use in electricity generation dropped 85% and coal dropped 12%, while natural gas increased 57%. As a result, Texas had the lowest level of SO2 sensitivity of any state.
But beyond the existing fuel mixes, fuel switching is not a clean fix for peaker plants. “Burning things like hydrogen and [methane captured from waste processing facilities] don’t actually reduce the air pollution burden in any meaningful way,” Ramanan argued. “Hydrogen in particular tends to actually have extremely high levels of NOx emissions when it’s combusted.”
In Astoria, a neighborhood of New York City, activists opposed retrofitting the local oil-powered peaker plant to run on natural gas because doing so would “lock the state into relying on fossil fuels for decades, fly in the face of the state’s climate law that requires a drastic reduction in carbon emissions by mid-century and continue to pollute in an already overburdened community where many residents are immigrants and live below the poverty line,” Inside Climate News reported. At the same time, doing so would “reduce the state’s greenhouse gas emissions by more than 5 million tons through the year 2035,” per its owner, NRG Energy.
But a third way emerged: New York eventually denied NRG’s permit because it violated the state’s climate law, and the utility subsequently sold the Astoria facility to serve as the converter station for Beacon Wind, a development off the coasts of New York and Massachusetts.
While wind, new transmission, and battery storage all face enormous headwinds in the current political climate — meaning that many peaker plants targeted by activists for retirement are likely to stick around for years yet — advocates remain adamant that a playbook exists for decarbonization. “In terms of replacing one-to-one capacity, we’ve been looking at battery storage even just at peaker plant sites that can be paired with renewables or grid connected batteries,” Ramanan said, adding that “really great work is also being done in terms of virtual power plants and demand reduction — because it’s not just about reducing peak capacity, it’s also reducing the peak overall.”
That raises a final, particularly thorny question: Is air pollution from peaker plants “worth it” if it means being able to run AC?
A 2018 follow-up study by the same team of researchers at the University of Wisconsin–Madison explored a similar question. They found that climate change alone would increase summer mortality related to the smallest airborne particulate pollution by more than 13,500 deaths, and ozone-related mortality by more than 3,500 deaths in a mid-century scenario. AC-driven power sector emissions — full-fleet numbers, albeit disproportionately including peakers — would, on top of that, account for 654 PM 2.5 deaths and 315 ozone deaths, a nearly 5% and 9% increase, respectively, over climate impacts alone.
Researchers credit access to air conditioning in the United States with a 75% decline in deaths, and modeling exercises frequently show that a blackout during a heat wave could realistically result in hundreds of thousands of people needing medical attention. But clean air advocates also point to examples like Astoria, where the denial of a permit to retrofit a peaker plant for slightly better fossil fuels resulted in the grounds being used for a renewable energy source instead.
It’s certainly not an easily replicable process given the current political and economic climate, but it also perhaps suggests a false dichotomy of peakers vs. AC. Affordable power and livable spaces are just two among a host of community needs energy and public health officials must keep in mind.
“It’s not enough to just replace the existing system with renewables and battery storage and have fewer emissions,” Ramanan said. “It also has to be equitable, because otherwise we’re just going to replicate the same issues we’re having now in different ways.”

Log in
To continue reading, log in to your account.
Create a Free Account
To unlock more free articles, please create a free account.
New research from Climate Central estimates the rise in heat-related emergency room visits due to climate change.
2027 is very likely to be the hottest year ever recorded. Though heat was the climate story of the summer — the ocean heat that dictates the severity of El Niño; the back-to-back heat domes in Europe that killed an estimated 35,000 people; the U.S. experiencing its hottest month in 130 years, breaking the Dust Bowl record — what lies ahead will be, in all likelihood, nothing our species has ever experienced before.
We need to get better at understanding and adapting to extreme heat because lives are on the line. But there is also a lot of bad stuff that happens to people before they actually die from the heat. While excess mortality rates are an important (albeit tricky) way of measuring how bad a heat wave is, climate change-related heat is also fueling an increase in emergency room visits, new peer-reviewed research by Climate Central found.
In a study released Wednesday looking at warm months in the years 2018 to 2025, Climate Central found that the observed rate of heat-related ER visits averaged 130 per 100,000 total visits, compared to a modeled rate of just 95 visits under counterfactual temperature conditions — that is, what temperatures would be without the influence of human-caused climate change. That means human-caused planetary warming directly accounts for about 35 visits per 100,000, or 27% of heat-related emergencies.
While the Sun Belt had the highest overall rates of heat-related ER visits, as expected, the largest relative climate fingerprint appeared in the Northeast (41%) and New England (37%), likely because these regions are far less acclimated to (or built for) extreme heat. Likewise, while July had the highest overall number of ER visits, being the hottest month of the year in the U.S., September showed the highest percentage attributable to climate change (33%) as heat impacts have begun to extend later into the fall.
Measuring emergency room visits might seem superfluous compared to measuring deaths, the latter being the more traditional headline number after an extreme weather-related tragedy. But Kristina Dahl, the vice president for science at Climate Central, told me that her group’s research is part of an emerging branch of attribution science called impact attribution.
“We’re trying to go beyond attributing the physical climate variables like high temperature and see how climate influence percolates into the whole chain of events,” Dahl said. “There’s a lot of literature that shows that heat-related illness increases when temperature increases, and there are a lot of studies that translate high temperatures into deaths and heat-related mortality. But we haven’t seen anything that looks at the lower-level health impacts related to heat exposure.”
Lower-level health impacts are crucial to understand, though. For one thing, more ER visits strain health systems in potentially lethal ways as wait times, premature discharges, and occupancy climb, resources dwindle, and care is rationed, earlier research has found.
Take the 2021 Pacific Northwest heat dome, the most extreme three days in the entire Climate Central record, with an observed rate of 6,763 heat-related ER visits per 100,000. About 1,834 of those visits, or 27%, are attributable to climate change, the researchers found. The Pacific Northwest “probably still would have seen a big spike in ER visits for heat-related illness during that event, even without climate change, because it was so extreme,” Dahl told me. But even a handful more heat patients than usual can gum up an ER, since treating conditions such as heat exhaustion and heat stroke requires lowering a person’s core body temperature slowly back to its normal range. Separate research has found that hospitals are more likely to discharge patients early to free up beds during heat waves, also raising mortality rates.
A visit to the ER isn’t just scary and disruptive; it can also be extremely expensive for whoever’s in the bed. “Our healthcare system is a really challenging system to navigate. It’s strained in a lot of ways, and people’s wallets are also strained because of it,” Dahl pointed out. Understanding how ER visits strain the health care system at large can also help administrators better stage ambulances and personnel ahead of extreme heat events — and invest in workforce expansion and infrastructure upgrades to prepare for the eventuality. Ideally, interventions can prevent people from end up in the hospital at all. Workplace heat protection policies, community cooling centers, and nature- and infrastructure-based cooling solutions are all vital.
There is a critical caveat to the Climate Central analysis, however: The data it uses to calculate heat-related ER visits comes from a Centers for Disease Control and Prevention initiative called the National Syndromic Surveillance Program. More than 85% of U.S. emergency departments report to the NSSP within 24 hours of a patient coming through the doors, conveying the chief complaint that a patient arrives with. “That could be someone saying, ‘I think I have heat exhaustion,’ or ‘I’m super dehydrated,’” Dahl said.
But because of that human element — and because a person having a heart attack isn’t likely to come in saying, “Hey guys, I think I’m having a cardiac event exacerbated by extreme heat” — Climate Central’s analysis faces the same limitations as other excess mortality reports that rely on reporting systems not designed to measure heat impacts. (This is also why NPR recently calculated that the number of people who die from extreme heat in the U.S. each year is likely five times greater than the official CDC numbers.)
When I pressed Dahl on the question, she agreed that Climate Central’s research offers “a conservative look” that could lead to an undercount. “We also know that in parts of the country where physicians don’t typically see heat illness, they tend to be a little less likely to code a visit as heat-related,” she added.
This isn’t a knock on Climate Central’s analysis — rather, it’s frightening to think that the real rates of heat-related hospital visits, much less all visits directly attributable to climate change, are probably much higher. Researchers, of course, need to be careful not to sensationalize, especially since sloppy data and poor science communication can lead to misconceptions and underestimations about the dangers of heat among the population. But it pays to understand what is happening; a surge in ER visits is another piece of the public health puzzle. Hopefully someone is paying attention, because the planet’s hottest summer — if prevailing trends bear out — is now only 41 weeks away.
Here are the major dates on the climate and energy calendar.
This is an edition of Heatmap Daily, an evening review of the day’s news written by our executive editor. Sign up for it here.
The Labor Day weekend is over, so today marks the unofficial start of fall in the United States — and my return to writing Heatmap Daily. Many thanks to Emily Pontecorvo for holding down the fort while I was on vacation.
As the seasons change (at least in a non-meteorological, non-astronomical capacity), I’ve been thinking about what the rest of the year might look like. Only 114 days separate us from the end of 2026, and between now and then, we're going to get answers about some of the country’s — and world’s — biggest ongoing climate and energy questions. By December 31, for instance, we’ll almost certainly know whether Congress has reached a deal on bipartisan permitting reform, and we’ll be watching a likely record-breaking El Niño kick into high gear around the world. The U.S. political system will also be gearing up for the next presidential election.
I’ll have more on some of the biggest questions I’m thinking about later this week, but first I wanted to lay out the map. Here’s a guide to the biggest remaining dates on the climate and energy calendar in 2026.
September 22 to September 28
Every year, world leaders descend on New York City for the UN General Assembly’s week of high-level meetings … at the same time that climate and energy wonks try to scrounge hotel rooms for New York Climate Week, the closest thing that the climate and decarbonization industrial-advocacy complex has to an annual confab.
This year, another event will be added to the mix. President Xi Jinping of China is supposedly skipping the UN meeting this year, but he will be staying just a few hundred miles away on the same exact days for what seems to be a Trump-hosted state visit in Washington, D.C. This will be the Chinese leader’s first state visit to America in more than a decade, and it will come, presumably, as U.S. relations with its neighbors and allies reach a recent nadir. Given the host country here, I wouldn’t expect to hear too much about climate change, but AI, trade, and Taiwan will all likely be on the schedule.
You can expect to hear a lot about climate change (and national energy policy, and the data center boom, and much more besides) at Heatmap House, our all-day gathering at New York Climate Week on September 23. Subscribers can register now, and speakers include former Vice President Al Gore, Secretary of Energy Chris Wright, and more.
October 4, 2026
Voters in Brazil will elect the country’s president, vice president, and members of its National Congress for the first time since former President Jair Bolsonaro attempted a military coup in 2022. Bolsonaro is under house arrest for his role in the attempted autogolpe, so he can’t run; instead, his son Flávio Bolsonaro is standing. The incumbent President Lula da Silva leads in the polls. Under Lula, Brazil has pledged to cut its greenhouse gas emissions by roughly two-thirds below their all-time high by 2035.
November 3, 2026
On the first Tuesday in November, Americans will vote for the full membership of the House of Representatives as well as one-third of the Senate. Democrats are expected to retake the House — it would, at this point, be a shock if they didn’t — but the president’s polling has become so dire that they’re hoping to beat the odds and take the upper chamber, too. If Democrats succeed in winning Congress outright, expect the second half of President Trump’s term to look quite different, with liberal lawmakers running aggressive oversight campaigns in the run-up to the 2028 presidential election. Interior Secretary Doug Burgum’s plan to overhaul the National Parks Service, for instance, seems like just the kind of effort that could falter in a more scrutinized environment; the Trump administration’s extrajudicial war on wind will also likely face more oversight than it has so far. Trump would also presumably have a much harder time making judicial and Executive Branch appointments.
Even though Election Day isn’t until November, early voting starts in less than a month in some states. Expect to hear a lot more about data centers and electricity bills between now and then. Some state-level races — particularly those in Michigan, Georgia, and Pennsylvania — could also shape the field for the upcoming 2028 presidential election. (Whether Senator Jon Ossoff of Georgia runs for president, for instance, will depend heavily on who wins that state’s governor’s race — and could appoint his successor.)
November 9 to November 20, 2026
The UN’s annual climate conference will be in Antalya, Turkey, this year and begin just a few days after the U.S. midterms. This is going to be a weird summit: Turkey is hosting the physical meeting, but Australia is nominally the “political” host. The conference is supposed to focus on clean energy, zeroing waste, and methane reduction. This will be the 31st meeting of the Conference of the Parties to the UN Framework Convention on Climate Change, and it may offer a look at what a post-Trump, post-1.5 degree Celsius UN meeting could look like.
The industry has gotten excited before, to no avail. Will it stick this time?
Over a decade ago, when the global price of silicon-based photovoltaic modules was roughly five times what it is today, the solar industry and media were already hyping up the next big thing: perovskites, a class of materials defined by their specific cube-like crystal structure. The technology promised to boost photovoltaic efficiency while driving down costs, and the industry was atwitter.
“All the cool solar-cell scientists are working on perovskites photovoltaics,” IEEE Spectrum proclaimed in a 2014 article. In the same piece, Oxford Photovoltaics predicted that it would have commercially available cells within four years. The Wall Street Journal profiled the tech that same year, and in 2015, The Guardian declared that perovskites could be “game changing.” The excitement centered around the potential for higher output at lower costs: Perovskite cells were seeing rapid efficiency gains, could be made from cheap materials, and were remarkably thin and lightweight. When the question of durability came up, it was often as an afterthought. But that has turned out to be the technology’s biggest obstacle.
“What the industry came to understand very quickly is that, yes, you could see higher efficiency, but that material is going to degrade pretty quickly,” Laureen Sanderson, chief communication officer at the perovskite startup Cubic PV, told me. “A lot of the efficiency records that you were seeing were records that were achieved on very small scale devices in a laboratory environment, potentially measured in the dark.” Not ideal for a technology designed to soak up the sun on a large scale.
It’s true that perovskite cells tend to break down rapidly on contact with moisture, heat, and light, a problem scientists have been slowly chipping away at in the lab. That fragility largely arises because perovskites are made of electrically charged ions held together mostly by the attraction between positive and negative charges, much like magnets snapping together. That’s an intrinsically looser structure than the covalent bonds in silicon, which fuse the atoms together via shared electrons. As a result, the ions in perovskites migrate when exposed to the elements, accumulating in places where they react with surrounding materials to form unwanted byproducts that gradually break down the cell’s structure.
But while durability has been its fatal flaw, efficiency is perovskite’s superpower. Silicon’s efficiency tops out at 29.4%, a fundamental physics limitation that no amount of engineering can overcome. But because perovskites can be tuned to absorb different wavelengths of light beyond what silicon can capture, stacking a thin perovskite cell atop a conventional silicon cell lets the combined device make use of more sunlight than either material could alone. In July, one of these silicon-perovskite tandem cells — the industry’s dominant architecture — set a new 35.5% efficiency record.
So while this new tech still doesn’t match the stability of conventional panels, it’s getting much better. Tandem cells hold up increasingly well when exposed to heat, light, and moisture in the lab, and early outdoor trials are starting to produce promising real-world performance data. With headlines about perovskites starting to roll in once more, scientists say there’s good reason to believe that, this time around, the hype might actually be justified.
“Over the better part of a decade, there’s been lots of, for want of a better word, device engineering to engineer the material to just be much more stable,” Sam Stranks, an energy materials professor at the University of Cambridge and co-founder of perovskite startup Swift Solar, told me. That includes swapping out an unstable chemical building block in perovskites called methylammonium with a more stable one called formamidinium, improving the connection point that binds the perovskite layer to the electrode layer, and improving the packaging of perovskite cells to seal them off from air and moisture.
“There’s still work to be done to really get it to the point where you could put it up on a rooftop for 25 years and you know it will last. But the trajectory is very promising,” Stranks said.
Scientists have managed to extend perovskite durability from mere hours to the point where cells and modules are now passing industry-standard tests that suggest they could survive outdoors for five to 10 years. That’s still a ways away from the standard 25-year warranties for silicon solar panels, which typically guarantee that a module will retain 85% to 90% of its original output by year 25. And because these latest perovskites simply haven’t been around that long, scientists have yet to test these more ambitious durability claims in the real world.
Industry experts say there’s no reason continued incremental improvements can’t get perovskites to that 25-year standard relatively soon, however. “If you look at silicon, it’s been 70 years of trial and error,” Scott Wharton, CEO of perovskite startup Tandem PV, told me. “Seventy years of constant tweaking and improvement, whereas perovskites have only had about 12.”
Wharton said that Tandem’s testing indicates its panels will degrade at a rate of less than 1% per year. Furthermore, he predicts perovskites will become the dominant solar technology by 2033, a more ambitious timeline than others in the industry typically project. But as he sees it, seven years is roughly enough time to build and deploy two generations of perovskite factories — the kind of iterative ramp-up he says new technologies typically need to achieve market dominance.
The economics just make sense, he told me. Because perovskites are more efficient, they will produce more power per unit — which means less land, hardware, wiring, and labor needed to achieve the same total energy output, driving down costs at every step of the process. Why wouldn’t everyone jump onboard immediately? “All of our customers have said that once we’ve proven it out, they’re going to move,” Wharton told me. “They’re going to move 100% to tandems because of the power of the efficiency gains.”
Others are somewhat more measured regarding how long this may take. Stranks predicted it would be about five years before perovskites with multi-decade warranties even begin hitting the market, while Sanderson estimated they’ll gain real commercial traction by 2029, with perovskites making up a “significant portion of the market” throughout the 2030s.
While the date of that tipping point remains up for debate, the industry appears to have largely settled the question of materials. At least for now, the preferred configuration is to pair a lead-based perovskite cell with silicon rather than build an all-perovskite cell, which would likely face even greater durability challenges. That’s because such a cell would also need a tin-based perovskite layer to capture lower-energy light like silicon does, but tin degrades even faster than lead. In other words, it’s easier to keep silicon — a proven, durable material — in the mix by building so-called “tandem cells” for the foreseeable future.
But there’s still plenty that remains unknown. Every startup’s exact chemistry is proprietary, and there’s no clearly dominant formula yet. There’s also no industry consensus on the architecture best poised to address perovskite’s stability challenge, either, with leading players typically taking one of two different approaches.
Stranks’ Swift Solar team is pursuing what’s known as a “two-terminal” tandem architecture, in which a manufacturer builds the perovskite layer directly on top of the silicon layer, with the two cells functioning as a single unit. That’s opposed to a “four-terminal” design, where companies build two independent perovskite and silicon cells and then mechanically stack them on top of each other rather than fusing them together.
Two-terminal is the more widely studied approach, pursued by other industry leaders such as Oxford PV — the same company that once predicted commercialization by 2018 — along with Chinese solar giants LONGi and JinkoSolar. Proponents argue that using fewer material layers means less light lost, which translates into greater efficiency and lower costs. In a blog post last year, Swift Solar’s team also argued that the four-terminal designs rely on laser cutting, which it says can create more entry points for degradation.
Two-terminal isn’t just the leading theoretical contender, it’s the first architecture to officially make it to market. Oxford PV’s finally executed its long-delayed commercial launch in 2024, shipping its modules to an undisclosed U.S. customer for use in a utility-scale solar project. It was the world’s first commercial sale of perovskite panels, which Oxford claimed could produce up to 20% more energy than standard silicon modules.
But newer market entrants such as Cubic PV and Tandem PV are bullish on the four-terminal approach. For one, while two-terminal designs use fewer materials, they are more difficult to manufacture. Building a perovskite layer directly onto silicon’s rough surface is more technically difficult than coating it onto smooth glass, as Cubic and Tandem do. And because four-terminal companies manufacture the perovskite and silicon cells separately, they can swap in whatever silicon cell is cheapest or most efficient at any given moment, rather than being locked into a single supplier’s tech.
That flexibility could prove important as the market moves beyond early adopters. For now, Stranks said, customers buying tandem modules are probably doing so for strategic testing purposes — placing small, one-off orders to trial the tech themselves. An installer today can’t simply go buy perovskites on the open market by consulting a public pricing list or product catalogue the way they can with silicon panels. “But it’s not too far away before that would be the case,” he explained.
For its part, Swift is moving … swiftly, acquiring the manufacturing assets and IP of the bankrupt Swiss silicon cell maker Meyer Burger this spring. The company plans to use those assets first to build a U.S.-based gigawatt-scale silicon cell and module factory to meet demand for domestically manufactured solar cells, eventually adding silicon-perovskite tandem module production to that same facility.
Tandem PV is also pushing ahead with plans to begin selling to customers by the end of this year “in a volume that would be big enough to hit bankability goals,” Wharton told me. It also plans to bring a gigawatt-scale factory online by 2028. The company is targeting the independent power producers who build, own, and operate most utility-scale solar projects today. And like Oxford, Swift, and Cubic, Tandem is focused primarily on the utility-scale solar market — by far the biggest opportunity for perovskite technology.
Cubic scrapped plans in 2024 to build a facility producing silicon wafers — the raw material used to make solar cells — amid collapsing wafer prices globally and surging construction costs domestically. While Sanderson says the company remains interested in building its own factory, it has no timeline for doing so. But in the meantime, it’s also interested in licensing its IP to other perovskite companies.
The outlook for domestic wafer production has improved in recent years, though, after the Biden administration provided stronger financial incentives for producing wafers in the U.S. The Trump administration has kept these in place, though it’s made domestic content requirements stricter and more complex overall.
There’s also another new policy variable in the mix: Section 232 tariffs on cheap silicon wafers from China. Going into effect this December, the tariffs could benefit producers like Swift and Cubic, which plan to manufacture silicon cells domestically, while potentially raising costs for companies like Tandem that hope to simply source the cheapest, most efficient silicon available on the market.
At any rate, perovskites give the U.S. a chance to secure a domestic supply chain for the next wave of solar tech. Because while Chinese perovskite producers are setting efficiency records, Wharton told me that they tend to be quieter on the question of durability. That could easily give a Western producer with a credible, multi-decade warranty the opportunity to jump to the front of the pack.
And that may happen sooner than you’d expect. “This always follows the same pattern,” Wharton said of technology breakthroughs generally. “You have a bunch of early entrepreneurs who overhype things, and then everybody goes, Yeah, that was a bunch of BS. And then it actually gets real, and then people go, It’s real, but it’s going to take forever. But then it doesn’t take forever because economics always wins.”