For a while now, something weird has been happening in the Atlantic Ocean.
The ocean’s circulatory current, a system called the Atlantic Meridional Overturning Circulation, or AMOC, seems to be slowing down. Scientists have long worried that what used to be a steady exchange of warm and cold water between the tropics and the North Atlantic is being disrupted by cold freshwater from melting Arctic ice, and could even shut down entirely, sending Northern Europe into a deep freeze and causing even more extreme heat to hit tropical regions.
What scientists haven’t agreed on, however, is when the AMOC might stop, though the latest report from the Intergovernmental Panel on Climate Change, or IPCC, predicted it should hold out through the end of the century. A new study, published Tuesday in Nature Communications, says otherwise: the AMOC, its authors say, will reach its “tipping point” by the middle of this century, and could collapse sometime between 2025 and 2095. If it does, it would bring rapid changes to the world’s climate of a type that haven’t been seen in over 12,000 years.
“When we first got these results, we didn't believe them ourselves,” said Susanne Ditlevsen, a mathematician at the University of Copenhagen and co-author, with her brother Peter Ditlevsen, of the new paper. “We were thinking that there's something wrong in what we're doing because we got estimates that are so off compared to the IPCC.”
It’s a striking study, and it can make us feel like catastrophe is not only looming but irreversible. But in many ways, this study is a microcosm of the many challenges that come with trying to predict — and speak definitively about — how our planet will change in the future.
“I personally think it’s very hard to say [a shutdown] is going to happen in the next 50 years,” said Zhengyu Liu, atmospheric sciences director at the Ohio State University. “There are lots of uncertainties.”
The IPCC report’s prediction, which it issued with “medium confidence,” is based on climate models that use supercomputers to simulate the physical processes that will change as the climate changes. Looking at those models, we see a gradual weakening of the AMOC over time rather than a sudden tipping point that leads to a collapse. But it’s possible, Liu said, that those models may present a world that is a little too stable. The influx of freshwater from melting glaciers is difficult to account for, and it’s possible the models used by the IPCC are too conservative.
To sidestep the issue of uncertainty over freshwater inflows (and, similarly, to avoid having to model for how the world responds to climate change over the next century) the Ditlevsen study instead used statistical modeling based on historic temperature records to study how the ocean’s temperature has fluctuated over time. They then predicted how those fluctuations might become increasingly unstable in the future. The bigger those fluctuations become, Ditlevsen said, the closer the AMOC gets to total collapse, and those fluctuations have recently been growing ever larger.
Temperature is a useful fingerprint when studying the AMOC, Liu said, but it’s just one fingerprint of a system that has only really been studied in earnest since 2004, when a network of sensors began collecting data on everything from temperature to salinity to ocean pressure. It’s difficult to say, with such limited data, whether extrapolating from just one fingerprint alone can truly predict a tipping point for the AMOC.
The big question, said Tom Delworth, a senior scientist at NOAA’s Geophysical Fluid Dynamics Laboratory, is the physics of how such a tipping point would work.
“Our models generally aren't showing these tipping points, and they’re based on our best physical understanding of the system,” Delworth told me. “So my question would be: what is missing from the models?”
Still, Delworth and Liu said, the Ditlevsen study is compelling, and it’s one of the first to attempt to put a timeline on the collapse of the AMOC. It’s also, as these studies tend to be, yet another reminder of the urgent need to reduce our dependence on fossil fuels and dramatically cut down on emissions.
The study’s authors intend to run their analysis again in five years, when they will have more data and should be able to come to a stronger conclusion on when exactly the AMOC could collapse. “We could have said, okay, let’s wait five years to publish this because maybe we are wrong, but I think we have the obligation to actually publish it now, because we believe that it’s correct.” Ditlevsen told me.
“I hope we are wrong,” she continued. “I hope we are wrong.”







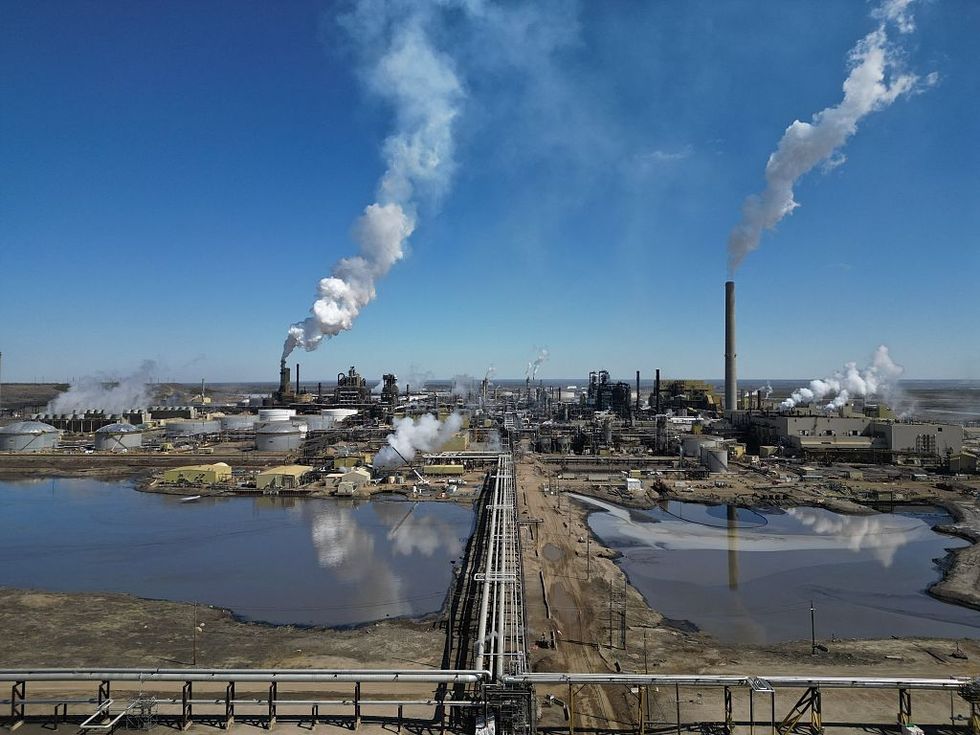 The Syncrude refinery at Mildred Lake in Alberta. Daphné LEMELIN / AFP via Getty Images