You’re out of free articles.
Log in
To continue reading, log in to your account.
Create a Free Account
To unlock more free articles, please create a free account.
Sign In or Create an Account.
By continuing, you agree to the Terms of Service and acknowledge our Privacy Policy
Welcome to Heatmap
Thank you for registering with Heatmap. Climate change is one of the greatest challenges of our lives, a force reshaping our economy, our politics, and our culture. We hope to be your trusted, friendly, and insightful guide to that transformation. Please enjoy your free articles. You can check your profile here .
subscribe to get Unlimited access
Offer for a Heatmap News Unlimited Access subscription; please note that your subscription will renew automatically unless you cancel prior to renewal. Cancellation takes effect at the end of your current billing period. We will let you know in advance of any price changes. Taxes may apply. Offer terms are subject to change.
Subscribe to get unlimited Access
Hey, you are out of free articles but you are only a few clicks away from full access. Subscribe below and take advantage of our introductory offer.
subscribe to get Unlimited access
Offer for a Heatmap News Unlimited Access subscription; please note that your subscription will renew automatically unless you cancel prior to renewal. Cancellation takes effect at the end of your current billing period. We will let you know in advance of any price changes. Taxes may apply. Offer terms are subject to change.
Create Your Account
Please Enter Your Password
Forgot your password?
Please enter the email address you use for your account so we can send you a link to reset your password:
New research published today in Nature shocked even the study’s own authors.

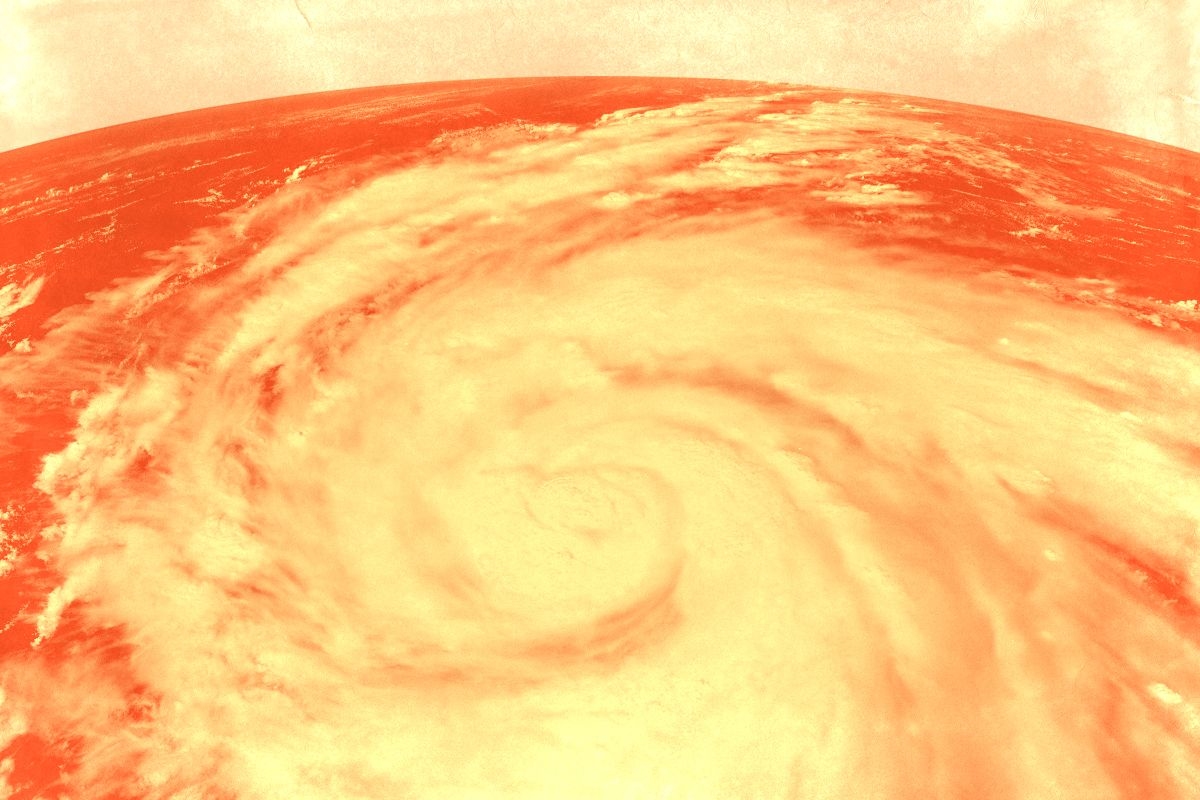
Hurricane Helene is, by conventional measures, the deadliest hurricane to strike the continental United States since Katrina. At least 182 people have been confirmed killed by the storm, with hundreds of people still unaccounted for. Although all hurricanes are deadly, only a handful of storms have killed more than 100 people since 1950. Or at least that is what we have long thought. New research suggests that these conventional tallies may be a vast undercount.
Several years ago, two economists and public policy researchers — Rachel Young and Solomon Hsiang, now of Princeton and Stanford — began to study a seemingly simple question: How many Americans do hurricanes kill each year? According to the federal government, the average hurricane kills 24 people after making landfall. That seemed likely to be a modest underestimate. Economists know that natural disasters can have a long tail of suffering; Hsiang expected the real number to be a “single digit multiple” of that figure — perhaps 50 or 100 people per storm.
Yet when they ran the numbers and looked at mortality in places affected by storms, they were initially perplexed by the results, Hsiang told me earlier this week. The numbers they came up with didn’t even make sense at first.
“It was months of us trying to understand what we were looking at,” Hsiang said. “And then once we realized what we were seeing, it was years of us checking our work to find what we missed.” Only when it was clear that their work resembled other American public health statistics — specifically, that the white-Black mortality mirrored what has been found in other studies — that the horrifying truth sunk in.
The finding: Hurricanes are hundreds of times deadlier than anyone has realized.
Their study, which was published on Wednesday in Nature, finds that the average hurricane kills 7,000 to 11,000 people after making landfall in the United States. These previously uncounted deaths happened not during a storm or in its immediate aftermath, but as a long, slow trickle of mortality that plagues a region long after the clouds have cleared and floods have abated.
In any one year, the number of storm-related deaths is not very high. And yet a wave of excess deaths is visible in population data for at least 15 years after a storm hits an area, they found.
“It lasts for so many years, and because there’s so many storms hitting so many states, once you add up, it becomes this enormous number,” Hsiang told me. When added together, hurricanes’ long-term death toll exceeds American combat deaths in all wars, combined. The number so dwarfs previous estimates that it suggests tropical cyclones alone are a major determinant of public health across the United States.
Kerry Emanuel, an MIT meteorology professor who studies climate change and hurricanes, told me that the results were “truly astounding” and “persuasive,” although he noted that he is not an expert in the statistical approach used in the paper.
“Summed over all hurricanes, this amounts to three to five percent of all deaths near the Atlantic coast,” he said. “I expect this result will prove controversial and will be followed up by many other studies of long-term mortality from natural disasters.”
The paper fits into a growing body of research on what others have called the hidden or invisible public health threat of environmental threats. For years, researchers have known that air pollution and heat waves, seemingly silent hazards, can in fact kill tens of thousands of people. Lately they have begun to apply the same techniques to other hazards, with outsized results.
Officially, Hurricane Maria killed 64 people when it struck Puerto Rico in 2017. But when researchers surveyed households across the island months after the storm, they found the death toll was closer to 4,600. (The territory’s government later revised the official figure to 2,975.) These deaths were caused not by the cyclone’s high winds or torrential floods, but rather by secondary effects of the storm’s destruction. Maria took out the island’s power grid and road networks, for instance, and preventing people with heart attacks and strokes from reaching the hospital in time.
That paper was written six months after Maria struck the island; this new hurricane paper considers a wider time horizon, finding that more than 80,000 Americans die each year as a result of a hurricane, whenever it occurred. Black people were disproportionately killed by the aftermath of hurricanes, at least partly because a larger share of the country’s Black population lives in storm-afflicted areas. About 37,000 white deaths each year are due to a prior tropical cyclone.
How could such storms cause such a long tail of deaths, affecting areas 10 or 15 years after they come ashore? The paper cannot answer those questions today. But Hsiang and Young hypothesize that hurricanes cause extreme economic distress, which can resonate for years or decades afterward. “If someone suffers a loss and can’t invest in their business, then it will have ramifications for their income long into the future,” Hsiang told me. “If someone is on a fixed income and their garage is destroyed, and they pull from their retirement funds to fix the garage, then eight years later when they face a big medical decision, they might choose” a cheaper or less effective form of treatment.
“When you talk to people, you hear stories like this,” Hsiang added. The time and money invested in dealing with the storm is often a “pure loss,” even if some of the damage ultimately gets reimbursed. “Even if you have insurance, that just means you already paid for it in some way,” he said.
Storms cause disruption in other ways. They can break up communities and social networks. (If children move away, for instance, their parent can face higher medical bills.) Hurricanes can also impose high costs on states, towns, and cities, which may then have to reduce or restrict other services as a result.
“When you think about how communities rebuild — local municipalities and states — they also play a lot of games with their budget” in the aftermath of a storm, Hsiang said. “If they spend a lot of money to rebuild a bridge or boardwalk somewhere, does that come out of some social program 10 years later? Or building a new NICU hospital?” That could explain why an infant — even one born 15 years after a storm struck a given area — could face a higher chance of death.
Young and Hsiang think that these economic drivers are most likely to be the big reason for the excess deaths — the effect is just too big and drawn out to make any other cause likely — but other possibilities exist, they recognize. Hurricanes could be deadly simply because they are highly stressful events. “We see an effect on cancer rates and also cardiovascular illness. Stress matters a lot to those,” Hsiang said. It’s also possible that hurricanes unleash contamination into the environment that then makes people sick. A flooded basement can become a breeding ground for mold. “There’s gas stations in every town. What chemicals come out when there’s flooding?” Hsiang wondered.
The paper may also help resolve a riddle in American public health. On average, Americans die earlier in the eastern half of the continental United States than in the western half. This effect is worst in the Gulf Coast and Southeast but persists to some degree in the Mid-Atlantic and Northeast.
The paper suggests that hurricanes may have something to do with this geographic phenomenon. For infants, people below the age of 44, and Black people of all ages, hurricanes may explain a large share but not all of the mortality gap.

Log in
To continue reading, log in to your account.
Create a Free Account
To unlock more free articles, please create a free account.
This is an edition of Heatmap Daily, an evening review of the day’s news written by our executive editor. Sign up for it here.
El Niño is here.
The world’s largest ocean slipped into the weather pattern in the spring, according to the National Oceanic and Atmospheric Administration, and the sea surface is now significantly warmer than average in one important region. When you chart ocean temperatures on a map, the “El Niño tongue” (yes, that is what scientists call it) clearly appears:

It might be more accurate to describe El Niño as something that happens to the planet, though. The Pacific occupies about one-third of Earth’s surface. When that third becomes unusually warm, it transforms weather around the world, driving wetter conditions in California, Central America, and South America; and drier weather in Asia, Africa, and Australia.
So far, so normal. El Niño is a standard fluctuation in the Earth’s climate system; we experienced the last one in 2023 and 2024.
But that is roughly where what’s normal about this year’s El Niño ends.
For one, this El Niño is far more intense than we should expect at this time of year. In an El Niño, the Pacific’s average temperature usually rises through the end of December or so; the phenomenon’s original name in Spanish, El niño de Navidad, alluded to the surprising arrival of warm currents in South America around Christmas. In the modern satellite era, the warmest El Niño ever measured happened in 2015, and ocean temperatures peaked at 3.1 degrees Celsius in November and December of that year. We called that a “Super El Niño” for just how abnormal it was.
Yet the Pacific is already more than 2.6 degrees Celsius (or nearly 5 degrees Fahrenheit) above normal — making this the third strongest El Niño ever measured in the satellite era — and it is only August. We still have four months to go, and this El Niño is already a record-smasher. More ominously, models expect that this El Niño could eventually grow to more than 4 degrees Celsius, or 7 degrees Fahrenheit, above normal.
What will that mean for the world? According to a recent Science study, the average El Niño can cost the global economy more than $3 trillion. The world is richer now than it was a decade or two ago, which should make it better able to withstand disaster. But this El Niño is so far out of sample that it’s hard to know what it could do.
And perhaps more importantly — as the climate scientist Zeke Hausfather, the guest of our new episode of Shift Key says today — it will offer a kind of preview of what the planet’s normal climate will resemble a decade from now. This El Niño is likely to push 2027’s average temperature above 1.5 degrees Celsius, the nominal threshold at which countries hoped to limit warming as part of the Paris Agreement (although, as you’ll hear, it is slightly more complicated than that).
Which is all to say: I encourage you to listen to our new episode, which is available on Apple, Spotify, or RSS. (A transcript is also available for Heatmap subscribers.) We tackle questions including:
There’s one thought that I didn’t include in the episode, however. Since late 2023, political discussion of climate change has decreased. This isn’t a phenomenon limited to any one faction of the Democratic Party — the progressives Abdul El-Sayed and Zohran Mamdani have downplayed climate policy roughly as much as, say, moderates like Mary Peltola and James Talarico have — but it is a clear trend. The American media’s coverage of climate change has declined during the same period. This “climate hushing” is not because politicians stopped caring per se, I think, but because nobody is sure how to talk about the issue in a politically useful way anymore, especially after the “climate = jobs” rhetoric that underpinned the Biden administration’s policy failed to retain voters in 2024.
I don’t believe (and think that political science has disproven) that extreme weather can “awaken” the public to climate change. Even against a gradually warming baseline, the weather — and public attention — shift far too often for that. But media coverage is loosely responsive to events. When the super El Niño of 2015 and 2016 smashed the then-record for the hottest year ever measured, it helped initiate a new era of public and elite concern about climate change. That El Niño’s heat waves, wildfires, and mass coral bleaching previewed the far worse disasters of the decade that followed. This El Niño’s disasters and broken temperature records could be worse — and even less ignorable.
On copper prices, nuclear’s jellyfish woes, and Leo DiCaprio’s Chilean NIMBYism
Current conditions: The death toll from Colombia’s earthquake has risen beyond 250 • A severe thunderstorm flipped a car in Columbus, Ohio, as a large system swept across the Midwest • A partial solar eclipse is set to occur the Northeast.

David Crowley, a moderate Democrat and local official in Milwaukee, narrowly defeated Francesca Hong, a leftist state lawmaker and former ramen chef, in the Democratic gubernatorial primary in Wisconsin last night. The race marked one of the most significant tests of Democratic voters’ willingness to elect a member of the ascendant Democratic Socialists of America, now the most popular socialist group in U.S. history. Her campaign promised to make childcare and school lunches free, repeal anti-union laws, and give renters more protections against eviction. She also pitched what she called her “control-alt-delete” plan to eliminate tax credits for data centers and put a statewide moratorium on permits for new artificial intelligence facilities.
Ahead of Tuesday’s primary, the AI developers Vantage, Oracle, and OpenAI announced a $60,000 community investment in Port Washington, which my colleague Jael Holzman described as “the most controversial data center development area in the state.”
Just last week, the Trump administration agreed to pay the energy giant RWE more than $1.2 billion to abandon an offshore wind project, the latest in a series of deals in which taxpayers hand over billions to not receive new sources of clean electricity they badly need. On Tuesday, Senators Alex Padilla, the California Democrat, and Angus King, the independent from Maine, introduced a bill that would give companies that reject Trump’s payouts an expedited route to more development. “The Trump Administration is doing everything it can to kill California’s offshore wind future, handing energy companies billions of taxpayer dollars to walk away from projects that would have powered millions of homes,” Padilla said in a press release. “This bill makes sure their destructive approach doesn’t waste what’s already been invested so we can get these leases back to work, create the jobs Trump killed, and keep energy bills low for working families instead of letting his war on renewables cost Californians even more.”
The bill has one potential flaw, other than the fact that Republicans are unlikely to pass it and President Donald Trump is even less likely to sign it. That, as my colleague Robinson Meyer wrote this week, is that the roughly $4 billion in payouts so far went to projects that were “already dead or dying.” The money spent, in other words, is “for nothing.”
Please read the following two sentences in the tone of the famous scene of Tony Soprano defending Christopher Columbus: In this newsletter, Ea-nāṣir, the Mesopotamian copper merchant from Bronze Age-era Ur whose stone-carved complaints about a subpar metal shipment remain readable millennia later, is a hero. End of story! Why, you might ask? Because we are once again living through an age where copper, the basic building block of all things electric, is in high demand. Copper soared back to within half a cent of its record high Tuesday of nearly $14,000 per metric ton after an outage at a major smelter in Indonesia rattled global prices, Mining.com reported.
The fight over North America’s only major cobalt refinery, meanwhile, is heating up. The mining giant Glencore made a bid for control of Sherritt International, which has taken a beating from U.S. sanctions due to its 50% stake in Moa, a joint venture with the Cuban government. The joint venture’s assets include the Canadian refinery and Moa nickel-cobalt mine in Cuba. The Glencore-backed consortium is up against Gillon Capital, the family office of Ray Washburne, a Republican fundraiser and former Trump official, according to the Financial Times.
Sign up to receive Heatmap AM in your inbox every morning:
Weeks after Europe’s latest heat wave forced inland nuclear stations to pare down output for lack of cooling water in the continent’s rivers, a “massive influx” of jellyfish has forced France’s EDF to shut down three units at its Gravelines nuclear station and cut power from a fourth. That’s taken at least 3.2 gigawatts of capacity offline, Bloomberg reported, right as temperatures are expected to surpass 104 degrees Fahrenheit in the coming days. The unusually hot temperatures off France’s shores have encouraged jellyfish populations to “bloom,” clogging the pumping stations through which coastal nuclear plants like Gravelines pull in cooling water.
In Egypt, meanwhile, construction crews working on the country’s first nuclear station hit a critical milestone. The containment vessel for the Russian-designed El Dabaa plant’s first unit is nearly completed, according to World Nuclear News.
Digging deep enough into the bedrock around New York City to tap into lava-hot rocks for electricity production is probably still years away, despite the progress that next-generation geothermal companies such as Fervo Energy have recently made. But thermal networks that maintain a steady environment year-round by circulating air at a constant temperature are increasingly popular ways for New Yorkers in private homes outside the city to stay warm in winter and cool in summer. Now the city itself is seeing whether a large-scale version could work for the subway system and municipal buildings. A study is set to begin soon into whether a thermal energy network could be built along subway routes to capture, store, and redirect excess heat that accumulates in the Brooklyn Bridge-City Hall and Chambers Street station complex to municipal buildings above ground. “Radiant cooling technology will absorb heat from the subway platforms and transfer it to geothermal boreholes drilled beneath Chambers Street,” reporter Carlo Cariaga wrote for Think Geo Energy. “This excess heat will then be stored underground until it can be used for supply to nearby municipal buildings during winter.” The contract for the feasibility study is due to be awarded in the fall, with work scheduled to start in early 2027.
“It seems like it’s a good place to test geothermal solutions because it sounds like there is a part of the tracks that isn’t being used, so they don’t have to stop service,” Jack Klein, the citizen researcher who conducted his own gonzo Subway heat study last year, told my colleague Jeva Lange this week.
Leonardo DiCaprio has long been a major donor to environmental causes. But rarely has the actor taken as clear a stance against green development if it comes at any ecological cost as this. On Tuesday, Bloomberg reported that the Oscar winner had told his nearly 60 million Instagram followers that fewer than 1,000 Pehuenche spiny-chest frogs remain in the wild, and that construction of the proposed Chile-Argentina transmission line threatens the amphibians’ habitat. “Conservationists are not asking for the transmission project to be stopped,” the celebrity wrote in the post over the weekend. “They are asking for it to be built where it does not put a Critically Endangered species at even greater risk.”
Rob checks in on this season’s supercharged ocean temperatures with climate researcher Zeke Hausfather.
Every few years, the Pacific Ocean’s surface waters become especially warm near the equator, a climatic phenomenon known as El Niño.
El Niño is a normal part of the climate system, but even in a normal year, it can trigger extreme weather around the world. Forecasters are worried that the current El Niño — which just began a few weeks ago — is going to be anything but normal. Models suggest that we could soon see the hottest El Niño ever measured, with unpredictable and catastrophic effects for ecosystems and societies around the world.
What does that mean? And why does this El Niño look so bad? On this episode of Shift Key, Rob is joined by Zeke Hausfather, a climate research lead at Stripe and a research scientist at Berkeley Earth. They discuss what forecast models are saying about this El Niño, why it gives us a glance at the future, and whether climate change itself is accelerating.
Shift Key is hosted by Robinson Meyer, the founding executive editor of Heatmap News.
Subscribe to “Shift Key” and find this episode on Apple Podcasts, Spotify, Amazon, or wherever you get your podcasts.
You can also add the show’s RSS feed to your podcast app to follow us directly.
Here is an excerpt from their conversation:
Robinson Meyer: How much, at this point, are we in an El Niño that is record-breaking? Like, how much do we see in observations, physical observations of the ocean or the atmosphere and the rest of the climate system, and how much do we think from the models that it is going to get even hotter?
Zeke Hausfather: So the way that we track the strength of an El Niño — there’s a few different ways to track it. But the most common one is from this particular region of the tropical Pacific called the Niño 3.4 region, which is sort of like about a third of the way into the Pacific off the coast of Chile, right around the equator. And that’s where this tongue of warm water forms during El Niño events. That’s sort of the characteristic signal of El Niños. And temperatures in that region, as of today, are at 2.8 degrees centigrade above normal, normal meaning the average of the last 30 years. So it’s sort of a sliding window that tries to remove some of the human-caused warming.
Robinson Meyer: Are we comparing temperatures from that region to another region? Or they’re just in that region two or more degrees above normal?
Zeke Hausfather: So it’s a good question. The traditional way that El Niño has been defined is to just compare that region to itself, but with a 30-year moving average applied to remove the effects of human-caused warming. There is another metric that was introduced by NOAA last year called the Relative El Niño Index, which is a variant where you sort of subtract out the average over the tropical ocean as a whole from that region, so you’re looking at the difference between that region and the rest of the tropics.
There’s pros and cons of that approach. Arguably, it removes the human warming signal a bit better, but it also can overly penalize really strong El Niño events that reach outside of that region because they start warming the whole tropics. So anyway, the details are technical, but the point on the observations is that we’re already seeing a very strong event occurring there today. You know, temperatures as of today, when we’re recording, August 10, are 2.8C above normal. To put that in perspective, the strongest ever anomalies we’ve recorded, at least daily in the satellite record since the 1980 or so, were in 2015, 2016, and those were about 3.1 degrees above normal. And so as of today, by itself, it would be the third strongest El Niño signal ever recorded in that region.
But what’s different is that El Niño almost always peaks near the end of the year. So if you look at all the El Niño events on record, there’s been one or two that have peaked in October, but the vast majority peak in November or December, and a couple as late as January. It’s a very persistent pattern of these events. And so the fact that it’s only the beginning of August now and we’re already at this extremely high level, we’re essentially running two to three months ahead of any other El Niño on record in terms of how quickly it’s developing, which is one of the reasons why we’re increasingly convinced that this is going to be a record-setting event. It’s going to blow any event we’ve seen previously out of the water. And if you look at the latest models that came out this morning, actually, it’s good timing. They’re predicting a peak of around 4C in the Niño 3.4 region, which will be, you know, more than a degree above the previous record and could end up being the strongest El Niño in 500 or 1,000 years. We don’t have great proxy estimates going back, but, it certainly is something well outside of anything we’ve seen since records began in 1850.
Robinson Meyer: The swimmer Katie Ledecky swims a race sometimes in the Olympics and she’ll be out swimming and then behind her there’s a computer-generated line which is the current world record, and she’s way out in front of the current world record, and you’re watching her and then she does she turns around in the pool and then the world record is behind her. That is the current El Niño. This is the Katie Ledecky-style El Niño.
You can find a full transcript of the episode here.
Mentioned:
NOAA’s El Niño page and the relative El Niño index
An Assessment of Earth's Climate Sensitivity Using Multiple Lines of Evidence, the 2020 paper where Zeke was a coauthor
Zeke’s blog post on AI emissions: The real energy use of agentic AI
John Bistline’s post on AI emissions at Watershed
Heatmap’s coverage of AI emissions: A New Guesstimate for Corporate AI Emissions
This episode of Shift Key is sponsored by ...
Discover the Yale Clean and Equitable Energy Development online certificate program at the Yale Center for Business and the Environment. In this fully online, 5-month program, you’ll learn from leading experts, develop practical skills, and grow a powerful network. Visit cbey.yale.edu to learn more and apply.
Music for Shift Key is by Adam Kromelow.