Alistair Hayden, an assistant professor of practice in Cornell’s Department of Public and Ecosystem Health, stressed to me that the tool is a “first draft,” and that his team is still working on getting it peer-reviewed. “We intend it as a hypothesis that people can test in the coming weeks or months to confirm our numbers,” Hayden told me. “I’m really hoping to be proven wrong.”
But Hayden also emphasized that while the West Coast might historically be where many smoke-related deaths have occurred, “this is the third out of four years [in the Northeast] that we’re having the smoke, so it seems like something we should be planning for,” he said. “It reminds me of that saying: ‘Fool me once, shame on you. Fool me twice, shame on me.’”
Admittedly, the smoke this week is a bit of a freak occurrence. A cooler-than-average sea surface pattern across the North Pacific, known as a negative phase of the Pacific Decadal Oscillation, helped produce weak low-pressure areas in the northwestern part of the United States, which in turn allowed for heat domes to develop across the Southwest and Plains. After one did just that earlier this month, the hot, high-pressure dome then shifted north, where it developed “dryness across Canada, followed by the lightning-producing thunderstorms,” Chad Merrill, a senior meteorologist at AccuWeather, told me. Then, boom: widespread fires.
“It is very unusual to have a combination of an El Niño and a negative phase of the Pacific Decadal Oscillation,” Merrill went on. “That’s one of the unusual factors this year, which contributed to the heat dome being farther north in that particular position.” The heat dome and jet stream then worked together to direct the thick smoke down into some of the most populous regions of Canada and the U.S.
That’s what makes this particular smoke event so bad. Were the smoke blowing over remote regions of Canada, as it would under more usual conditions, “then the big cities and the Great Lakes wouldn’t experience the smoke; it would have gone north toward the Hudson Bay and then Greenland,” Merrill said. In fact, the Canadian fire season is tracking below average overall; it’s the meteorological conditions that made this week’s smoke events, as one outlet put it, “the perfect storm.”
Wildfire smoke in the region is not historically anomalous, however. A 1903 article in The New York Times describes a “yellow day” similar to smoky events in 1894, 1881, and earlier. But large-scale burns in Canada’s dense, remote boreal, which produce more smoke, are increasing. Though it’s difficult to attribute any one wildfire directly to climate change because of the complex nature of such events, we do know that fire weather is becoming more common with the warming of the atmosphere from greenhouse gas emissions. As modeled by Zeke Hausfather in the Friday edition of his newsletter The Climate Brink, “hotter, drier seasons burn the most” in Canada — and “recent years cluster there” as the country has outpaced the global average in warming.
But as Hausfather also writes, “While overall area burned is the climate-linked trend, who breathes the smoke on a given week in July is mostly driven by the weather.” This is similar to the way that, though it may be a quiet year in the Atlantic, it only takes one hurricane making landfall in the right (or wrong) spot for the season to be remembered as catastrophic.
On the other hand, as foolish as it might be for the Central Plains and East Coast to still believe smoke is the exclusive domain of Westerners, it is also a mistake to assume smoke only comes from without. As I reported earlier this year, the Eastern half of the country has seen a 10-fold jump in the frequency of large burns over the last 40 years. Nowhere is safe from the smoke.
Planning and preparation, then, should be paramount. But as Grist learned last month, there are no established Air Quality Index numbers that would trigger the postponement, relocation, or cancellation of, say, a FIFA World Cup game, including the final, which is set to be played in New Jersey on Sunday. White House officials are reportedly meeting with FIFA’s president on Friday to discuss contingencies, given the unhealthy air quality in the region.
Which brings us back to Hayden’s modeling. He offered a note of optimism in that research by Stanford’s Sam Heft-Neal and his colleagues indicates that emergency room visits do not rise in tandem with increasing wildfire smoke. “As smoke gets bad, the health impacts get bigger. But then as smoke gets worse and worse, the amount of health impacts actually goes down, measured for emergency room visits,” Hayden said. “The idea is that people modify their behavior in higher smoke” — say, by staying indoors, wearing masks, or canceling outdoor events.
It’s time to treat smoke as an East Coast phenomenon, in other words. Doing so will save lives. “Will [smoke events] become more frequent in the future? Most likely we will see a recurrence,” Merrill, the meteorologist, told me. “How often they happen is yet to be determined.”


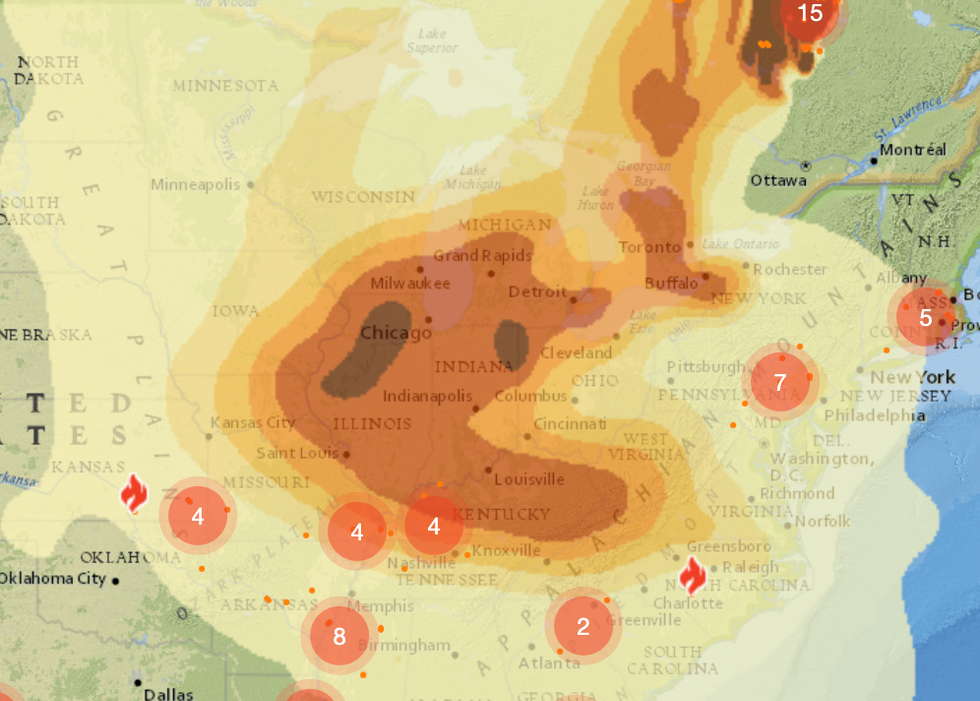 The model for the evening of June 27. Darker colors indicate higher PM2.5 levels, the particles associated with wildfire smoke. The numbered circles refer to the number of regional wildfires.
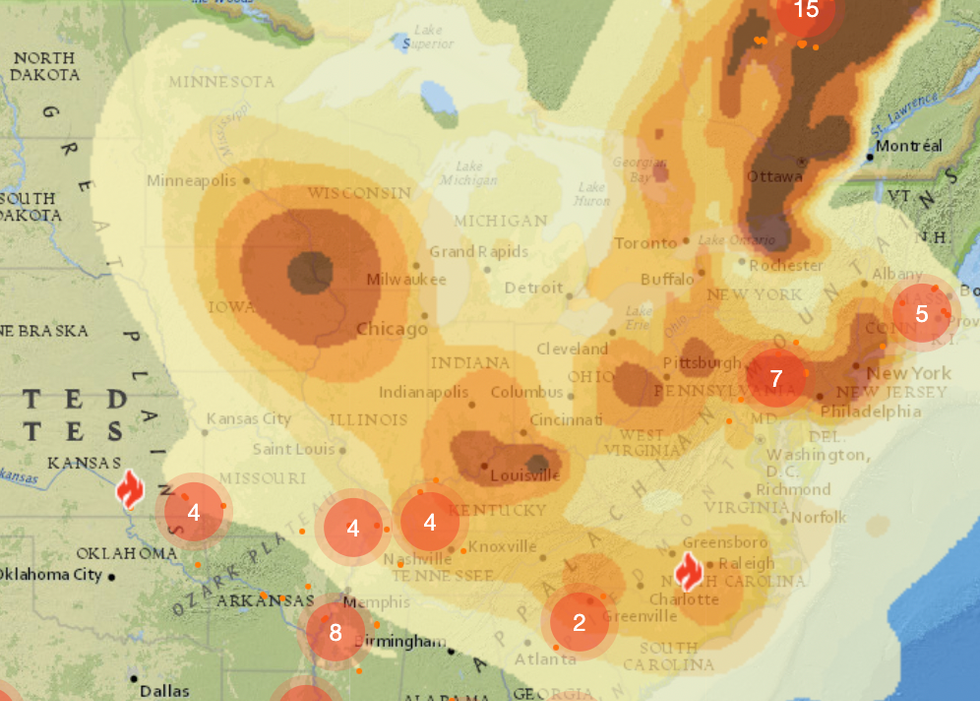 The model for the morning of June 28.
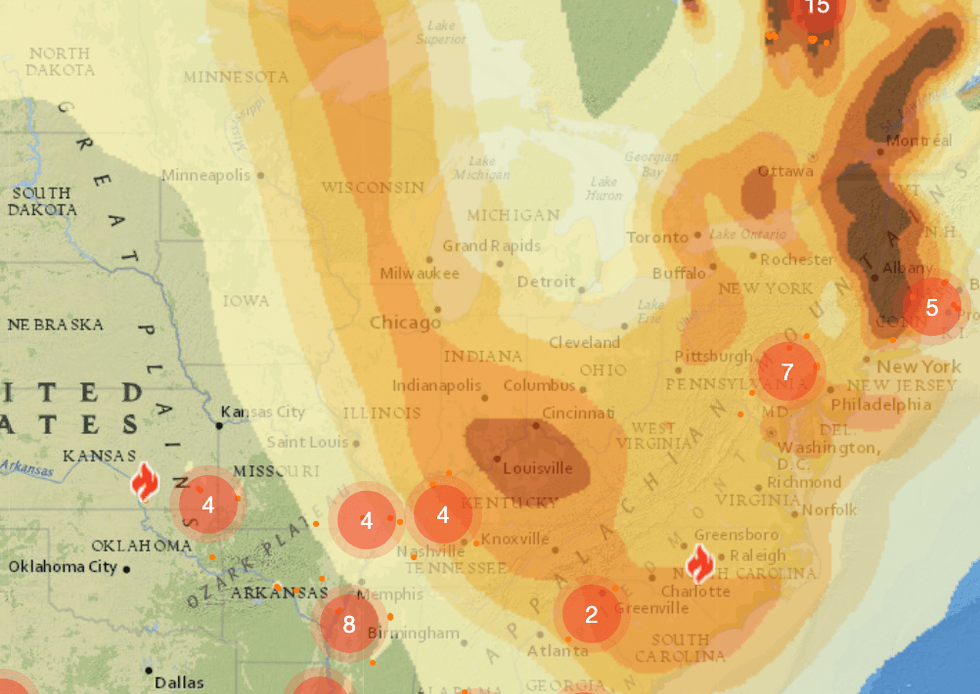 The model for the evening of June 28.