Around the same time, it also announced it was planning to “harmonize” its standards with those developed by the International Organization for Standardization, or ISO, a much larger entity that sets rules for measurement, safety, and quality across a wide range of industries and products. The two organizations operate under very different governance structures, and it was unclear how the marriage would work.
While it’s voluntary for companies to adhere to either group’s standards, most do, as it legitimizes their environmental claims. Soon, though, larger corporations operating in Europe and California will be required to abide by one of the two accounting rules under new emissions disclosure rules. Today, the Protocol has a far larger userbase, but the existence of the two standards is awkward, and business groups have been asking for reconciliation.
Now the Protocol says the merger will have the two organizations consolidate their disparate workstreams into a single corporate carbon accounting standard that will be put out for public comment next year. Meanwhile, the public feedback on the clean energy proposal is out — and the response was overwhelmingly negative.
Here’s what we know so far about what’s next on both fronts.
Companies hate the electricity proposal
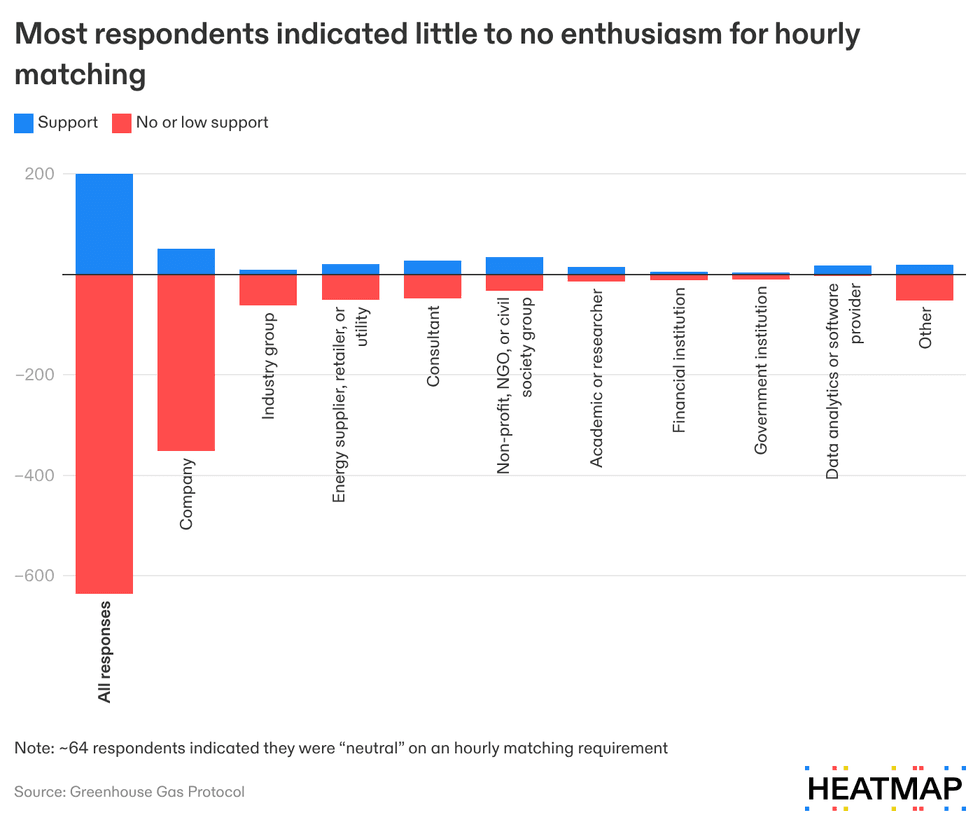
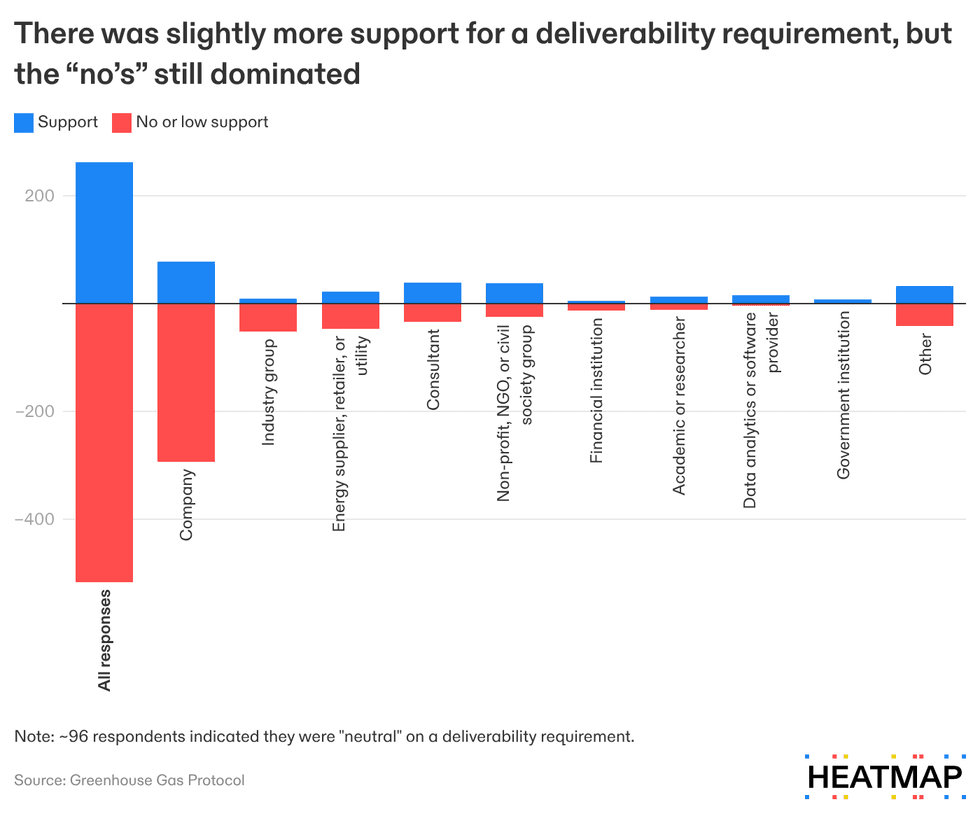
About 70% of the nearly 1,100 respondents to the public consultation opposed criteria that would require companies to match their electricity consumption with purchases of clean energy generated in the same hour if they wanted to claim they used that clean power. A smaller majority, at 59%, opposed a rule to require that the clean energy be generated in the same regional electric grid, a strategy known as “deliverability.”
These results aren’t exactly a surprise given who participated. More than 60% of responses came from the companies that would be subject to these rules and the industry groups and consultants who represent them. They weren’t the only opponents, however. There also proved to be a pretty even split of opinion within the nonprofits and researchers who engaged.

The experts who drafted these rules were trying to improve the status quo, where companies can inaccurately claim they are fully powered by solar panels, even at night, or say they are using wind power that’s generated halfway across the world. Now the authors will have to go back to the drawing board, this time with more explicit direction to find “common ground that the plurality can see themselves in,” Tim Mohin, the CEO of the Greenhouse Gas Protocol, told me.
I’ve written in the past about how the debate over how to measure electricity emissions is just as philosophical as it is technical. Proponents of hourly matching and deliverability argue that these features make for more accurate claims that also incentivize investment in the wider range of resources that will be needed to fully decarbonize the grid, such as geothermal power plants and batteries. Detractors argue such rules will make corporate clean energy procurement more complicated and costly and deter companies from doing it at all.
Both views are present in the results of the consultation — the latter just has more voices behind it. Interestingly, about only about 20% of the government institutions that participated supported the hourly matching requirement, but all of them were either supportive or neutral on deliverability. The majority of opponents were okay with the Protocol giving companies the option to report their emissions using the hourly matching and deliverability requirements, however.

The new CEO’s philosophy
I asked Mohin, who joined the Protocol as CEO in April, about the imbalance in who participated in the public consultation process, and how the organization would take that into account. He said the Protocol’s job as a standard setter was to find common ground, and that “clearly, with what we got back in the consultation draft, we haven’t gotten there yet.”
Did he see the Protocol’s job as facilitating climate action, I then asked, or ensuring accurate reporting and comparable data?
“Our vision is decarbonization. That's why we do what we do,” he told me. “There is a difference between accuracy and precision. Accuracy is good enough to make a decision to lead to decarbonization. Precision is trying to tweak it all the way down to some more precise number. We are focused on accuracy so that we can get to decarbonization.”
Mohin noted that one commonality across all sides of the debate is a desire to make the electricity emissions accounting standard more rigorous — the disagreement comes from how to do it. He said the staff has been “working on solutions that could feed into the technical working group,” which will “restart the process” in an in-person meeting this fall.
Merging four workstreams into one
When the electricity working group reconvenes this fall, it will be under the Protocol’s new plan to join forces with the ISO.
Originally, the Greenhouse Gas Protocol had convened four separate expert groups to work on different aspects of its standard. While the “scope 2” group was updating the method for estimating electricity emissions, a “corporate standard” group was revising the underlying bible guiding corporate carbon accounting. A “scope 3” group was also tightening the rules for tallying indirect emissions, such as those resulting from when customers use a company’s product. Lastly, an “actions and market instruments” group was developing a new framework for companies to report their purchases of low-carbon fuel, carbon removal, and other types of carbon credits.
Each of these workstreams was set to assemble their own draft proposals, put them out for public comment, and then finalize them separately. To date, only the scope 2 group has reached the public consultation phase.
Now, the Protocol is scrapping that plan. ISO experts have joined the Protocol’s working groups and are already contributing to their proposals. Once all are ready for public comment, they will be combined and released as one, consensus-based draft standard.
After the public consultation and any further revisions, the two organizations will each vote to ratify the new standard separately through their distinct governance processes. Assuming they both approve it, the end product will be a single, co-branded standard.
On the Protocol’s side, the group’s independent standards board will vote on the proposal. If approved, a steering committee will assess it to ensure that it meets all pre-established goals and requirements, then ratify it.
The ISO is structured differently. It’s a membership organization made up of national standards bodies from nearly every country in the world, and it is ultimately the members that get to vote to approve new or revised standards.
I asked Mohin what would happen if one group voted to ratify the standard and the other rejected it.
“I haven’t really thought about that, but it’s a really good question,” he said. “I don’t believe that’s going to be an outcome.”
Tensions remain
There are other reasons this is an awkward marriage.
In some ways, the ISO is the more authoritative organization, having set more than 25,000 international standards adopted by countries around the world. But when it comes to greenhouse gas emissions, it’s lagged behind. By the time the ISO created a carbon accounting standard in 2006, the Greenhouse Gas Protocol was already established, and contained much more detail. The ISO standard also costs hundreds of dollars to access, while Protocol standards are freely available.
Michael Gillenwater, the executive director of the Greenhouse Gas Management Institute, which is engaged in standards development at both the ISO and the Protocol, told me the two were not that different. Still, most companies have followed the Protocol’s standard, he said, because it’s free and has a longer track record.
The Greenhouse Gas Protocol has also taken strides to embed transparency and accountability into its process. Its technical working groups are made up of a diverse range of experts from industry, academia, and NGOs. The names and affiliations of everyone involved in the process are published on the group’s website, and most of their meeting minutes and working drafts are shared publicly.
The Protocol has come under fire recently for not totally adhering to its governance principles. A member of its independent board resigned in protest last month, accusing the organization of covering up a complaint he filed about misconduct in the development of a standard for forest carbon accounting.
Still, it’s more transparent than the ISO. There, the technical committees that draft the standards are staffed by experts appointed by members. The focus is much more on geographical representation than diversity of expertise. Additional stakeholders can get involved in the drafting process as "liaisons,” but they cannot vote. The ISO also does not disclose the names of the experts staffing its technical committees, nor does it publish any of the documents they produce.
For the consolidation of the corporate emissions standard, these differences may not matter as much, as it appears that the Greenhouse Gas Protocol is simply integrating ISO members into its existing processes. The Protocol has already added the names of the ISO experts joining its working groups to its website.
The two organizations also plan to work together on additional standards, however, and transparency has already been an issue. A new, joint working group convened to develop an accounting standard for the emissions embedded in individual products has already begun meeting, but the ISO has not disclosed who it has appointed to the group, and the meeting minutes are going to be stored on the ISO’s repository, which is not accessible to the public. Only high-level summaries will be shared broadly.
When I raised these concerns with Mohin and how they might affect the Protocol’s reputation, he acknowledged there were differences in how the two organizations operated, but said he was not worried. “I think those differences are small compared to the benefits that we are accomplishing with this,” he said, adding that this is “really what the world wants, to have a single global common language.”


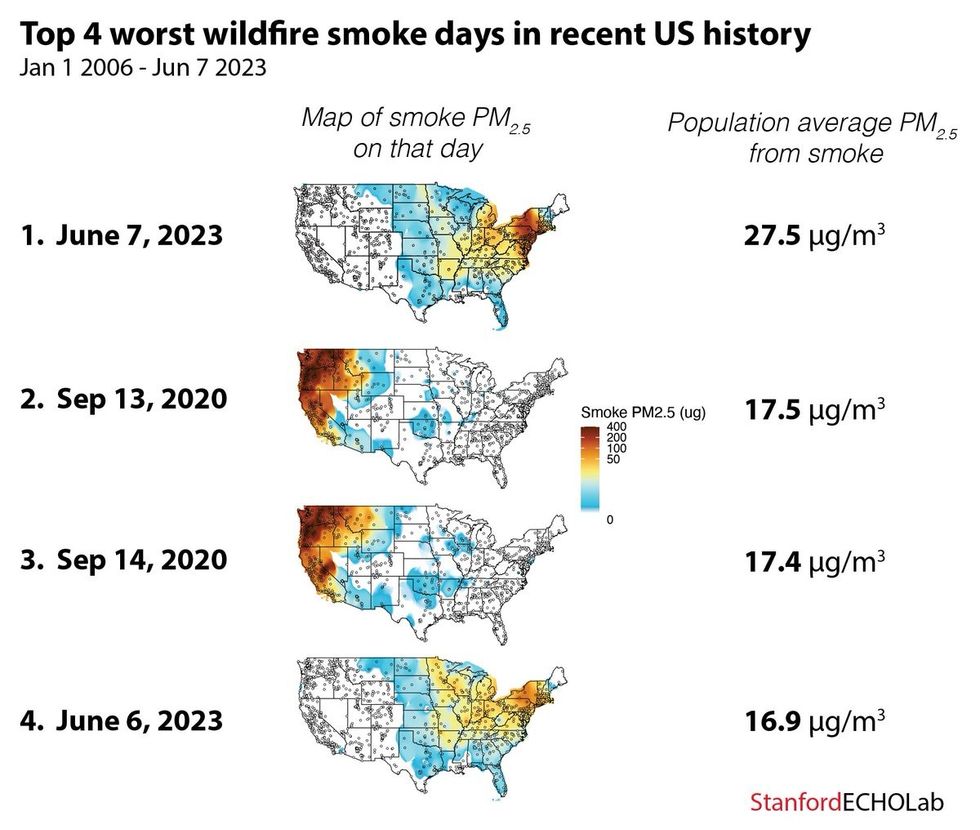 Stanford.


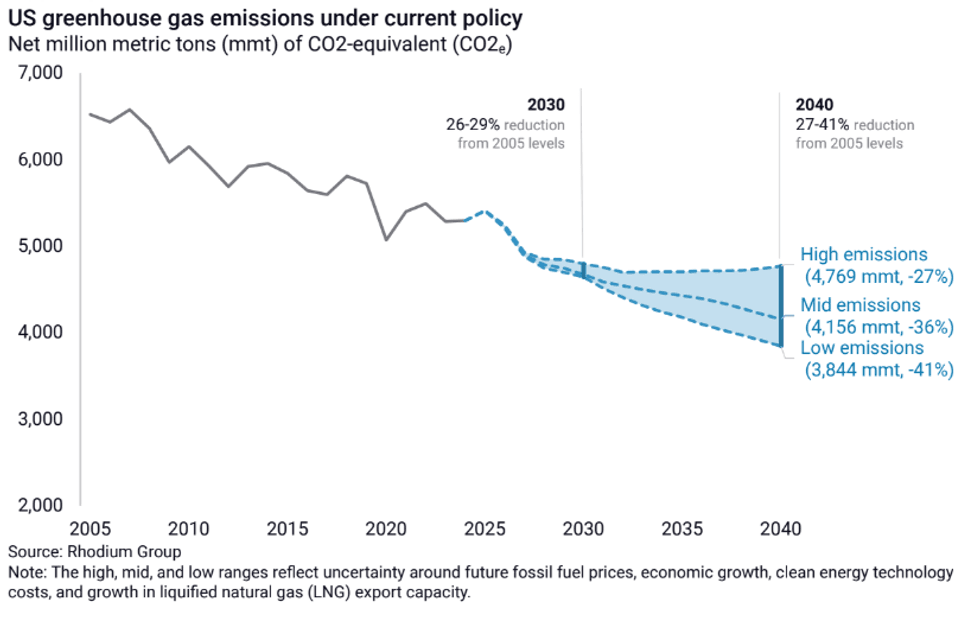 The 2030s crossroads.Rhodium Group