You can also add the show’s RSS feed to your podcast app to follow us directly.
Robinson Meyer:
Hello, it's October 16, and the Senate is considering a bipartisan permitting bill. Last month, a group of four senators, two Republicans and two Democrats, introduced the Bipartisan American Affordability and Jobs Act. That is “BAAJA” or “bei-ja.” I've been flipping between the two pronunciations.
At the heart of that bill is a compromise.
The bill would make it easier to build, and in some cases mandate, lots of types of new infrastructure that are essential for decarbonization, including long-distance power lines. It would also make it easier in some cases to build natural gas pipelines. So how should Democrats, and climate hawks more broadly, think about such a compromise?
Is there any case in which lawmakers should accept building more fossil-fuel infrastructure in exchange for a lot of climate-friendly or decarbonization or electrification-friendly measures? Well, joining us today is someone who is among the most cited authors on this topic. Peter Erickson is an affiliated researcher at the Stockholm Environment Institute. He's written some of the most important papers on why it's essential to look at fossil fuel infrastructure, and specifically fossil fuel supply infrastructure, when considering climate policy. He wrote a very influential paper, as you'll hear, on the Keystone XL pipeline, arguing that that pipeline would have created way more carbon emissions than the State Department thought at the time.
He's since become an expert witness testifying against fossil fuel infrastructure in court cases, and I'm pretty sure he's been cited in more court cases about fossil fuel infrastructure and fossil fuel supply than any other climate researcher. But in recent years, he has taken a nuanced approach to the question.
He's come to think that some of the claims about fossil fuel infrastructure are perhaps running ahead of the science. He joins me on this episode of Shift Key to discuss the long arc of his work, because I think in tracking his work, you can see the evolution of a very important approach to climate policy and where that approach may go next in years to come.
You'll also get a sense of what all of this could mean for “BAAJA” or “bei-ja” or whatever we're calling it. I'm Robinson Meyer, the founding executive editor of Heatmap News, and all that and more, it's all coming up on Shift Key.
Peter Erickson, welcome to Shift Key.
Peter Erickson
Hi, Rob. I think this is gonna be really fun.
Robinson Meyer
Excited you're here.
Could you just describe, like, your distinct role as a fossil fuel and energy systems researcher?
Peter Erickson
So my name is Peter Erickson, and my background is in science, in geology specifically. And for the last couple of decades, my main role in the climate policy space has been to do, as best as I can, objective analysis of how climate policies would affect greenhouse gas emissions. And so that role has led me to various places, but one place that it has led me to is to be an expert witness in court cases about fossil fuel infrastructure.
And the reason that in my mind has fit into my role as a climate policy analyst is that sometimes information is surfaced or brought forward by project proponents into these permitting decisions. Sometimes the information that's brought forward is clearly wrong and/or it seems like the permitting decision is a proxy for the policy decision made by the government.
And because I care more than anything about good analysis being brought to these decisions, that is why I have gotten involved as an expert witness.
Robinson Meyer
Yeah, I wanna talk today about a number of papers you've written and some of your ideas in the space and kind of how they inform thinking about permitting reform, but also I think the state of climate politics in 2026 more broadly. But before we get there, I wanna start in 2014, with this paper you wrote about the Keystone XL Pipeline.
I think a lot of your writing is about the role of fossil fuel supply and how it drives greenhouse gas emissions and how climate policy should think about fossil fuel supply. But what were you doing before you got into that, and how did you get into this world of fossil fuel supply thinking?
Peter Erickson
Yeah, and the Keystone XL Pipeline is a great example because that was my entry point into the fossil fuel stuff. Before that, I was working much more on either city scale or, local scale, or international scale climate policy. So one of my major things before getting into fossil fuel supply was looking at carbon offsets.
For example, I had just been working with the UN Framework Convention on Climate Change, who had commissioned me to do a study of whether carbon offsets were or were not reducing emissions under the Kyoto Protocol. So, you know, I really viewed myself, and I still do to some extent, as just, let's just look at the numbers as best we can about this type of policy, right?
And so Keystone XL came along, and I wasn't really all that interested, but I saw the State Department's environmental impact statement about it, and I thought, “This can't be right." Something is wrong if they're concluding that this major pipeline from the oil sands is not going to change emissions at all.
And so that really got me looking at this question in the first place, reading economics textbooks, talking to economists, understanding oil market dynamics.
Robinson Meyer
I realize I should make one observation that I wanna touch on before we get into the actual process here, I suppose. Which is when I read these papers, when I read your research, when I read your written work, I do see what I would describe as an evolution, or at least a change of thinking on your part about... I'm not even sure you've, like, changed your mind per se, but in some ways I, I see an evolution from a world that wasn't taking, you know, your belief that questions of fossil fuel supply were not being taken seriously at all to now maybe a concern...
It might be wrong to say that you're worried that it's gone too far, but a concern that claims being made about the role that fossil fuel supply plays in greenhouse gas emissions are, like, overstated compared to the role that it actually plays. Am I right to detect in your research a broad turn?
Peter Erickson
I think it's fair. I think it's fair to detect an evolution and a change in emphasis, perhaps. But the fundamental math has stayed, and research findings have stayed true throughout, right? I was interested in Keystone XL in the first place because I thought that truth was somewhere between it can't matter at all and it matters absolutely, right?
That is still the position I'm taking based on my research. It's just that I think we have gotten to the point with some of the fossil fuel supply discussions where not only the rhetoric, that's always been the case, but the actual evidence being brought forward in front of very serious policy venues and very serious courts is straying from what I think is defensible in some cases.
And so if you detect a change in my posture, it's because it's the exaggerated claims are no longer just on the fossil fuel side.
Robinson Meyer
Let's start with the Keystone XL Pipeline, because I think to some degree, Keystone, both for you but also for society at large, winds up setting the terms for how we talk about fossil fuel infrastructure in a new way. And this was partly by design; this was part of the point of the Keystone XL Pipeline campaign was to make people aware of the role of fossil fuel infrastructure in perpetuating climate change and worsening climate change.
What's interesting about it is that part of the question with Keystone, and this will come up again with later fossil fuel projects, comes down to this analytical question where President Obama at the time says, "We're only going to approve Keystone if it doesn't significantly worsen greenhouse gas emissions or significantly worsen climate change."
The State Department then comes out with an analysis that says basically, "No, it won't." Keystone XL Pipeline, which for readers who are blissfully younger than you or I, was a big old pipeline that was gonna connect the Albertan tar sands, a particularly carbon-intensive form of oil extraction, to refineries in the Gulf Coast, allowing a broader expansion of refinery activity.
And because of the particular chemistries of Canadian oil and fracking oil, it was going to allow for a big expansion of activity. But the US State Department came out with this analysis, and it said, “Listen, don't worry. It's only going to worsen greenhouse gas emissions by 1 to 27 million tons of CO2.” And you wrote a paper, it was in Nature Climate Change 2014, and you said, “Actually, that’s not right.” And so what did you say?
Peter Erickson
What we said was that 1 to 27 million range that the State Department came out with was only about how much dirtier the oil sands were than whatever they would be replacing out there in the market. And what we said is, that can't be the only thing, right? You have this major oil producer that is Canada. It is capacity constrained in how and whether it can get its oil to market. Keystone XL is changing that, right? That is the fundamental point of the project, is to expand the ability of Canada to get its oil to market. That is going to change oil markets and therefore oil consumption in ways globally that we can use math about.
This is not unknown. It is, as I was criticized for, using Econ 101, but we should at least bring Econ 101 to bear and look at it from that and other perspectives. And so that's why that paper got published. That's why the State Department cited our paper in a footnote, as if to say, "Look, this is the way we think it is, but it could be this other way, too."
Robinson Meyer
And what did their analysis miss? It was this idea that basically every additional barrel you bring to market slightly lowers the global cost of oil and therefore increases the global market's propensity to consume oil, right?
Peter Erickson
That's exactly right. Yeah, each additional barrel slightly lowers the price of oil in the market, and that means that consumers might drive a little more, and car companies might make cars that are slightly less efficient. it means that whole cascading chain of decisions that is affected by price.
Robinson Meyer
This has come up in previous pieces of legislation, previous policy questions as well, which is you have to think about several different systems, and they're all in equilibrium. One of them is that you're opening up this new fossil fuel resource.
You're producing fossil fuel from it. You're producing oil, in this case, from it, and that's going to slightly increase the amount of oil supply on the global market, and that is going to also make it so oil's cheaper and people burn oil. But it also seems like by decreasing the global cost of oil, you're going to keep other fossil fuel reserves off the market. You're going to, by just a little bit, lower the global cost of oil. And that's going to take, you know, potential oil fields or potential oil field upgrades that other countries or, you know, companies elsewhere in the US or North America could make that would open up new sources of oil.
It's gonna make those projects uneconomic, and therefore, they're not gonna make those investments. And that's going to tick the price of oil a little bit up from where it was. And so how do you think about this relationship between new fossil fuel or new oil supply in this case, crowding out other supply, out-competing other supply versus it creating a market for itself?
Peter Erickson
Yes, that's right. And so the way that economists or oil market economists would deal with all that equilibrium is they would look at just how sensitive the producers are and the new producers are to price. They look at how the consumers and the new consumers are sensitive to price, and they essentially, you know, balance out those different factors in a complicated or, as I've done, a really simple model of how to look at this.
And so, you know, those parameters are called elasticities. We don't need to get into them per se, but when you put that kind of basic fundamentals and math together, what you end up finding is that, for each new oil barrel brought online, abou 0.4 barrels of that are newly consumed and 0.6, that adds to 1 by design, right, are, no longer produced elsewhere.
Robinson Meyer
Has our assessment of that number changed? I'm asking only — obviously I'm reading this paper you wrote 12 years ago. Stipulate it; it's a 12-year-old paper. I think your number there is 0.6, and it's funny 'cause I was reporting on this question like a year ago, and the number a year ago was 0.4, and I was like, "Have we knocked this down by two-tenths of a barrel?"
Peter Erickson
You know, maybe by chance during the Keystone XL era, the oil market was really tight, right? An analyst thought we were way up high on the cost curve for oil where it is very steep, and so where each new unit of production costs that much more.
Or, you know, considerably more than the last unit of production. And so in that environment, like, that is the kind of environment where affecting supply really matters. But in the current oil crisis notwithstanding, we are not exactly in that world anymore. And it's reasonable to think, or at least if you believe the energy transition is happening at the speed and scale that some people think, demand goes down.
That brings us further down the supply curve into an area where it's flatter and where supply restrictions matter, or rather would have less effect on prices and emissions. So in, you know, elasticity terms, we're going from a place of low elasticity in 2014 to a place perhaps with higher elasticity going forward.
Robinson Meyer
The way we would see that, if that change was happening, is that there's now alternatives to, say, in the oil market, there's alternatives to liquid-fueled vehicles in a way that there was not alternatives to liquid-fueled vehicles like in 2014.
Peter Erickson
That is completely the biggest change. And, in Econ 101 terms, the demand curve has shifted to the left because these other alternatives are now available, and consumers are choosing for price or other reasons, other options, and they have those options available.
So there is good reason to think that going forward, and I haven't seen this published in rigorous ways yet, but going forward, the elasticity of oil supply may be higher than it was in the past. And therefore, you know, further shifts in the demand curve or shifts in the supply curve are less consequential for price than they were in the past.
Robinson Meyer
That's so interesting. Let's stay on the chronology. All of that lay ahead. So Keystone XL brings infrastructure as this big climate policy question to the forefront, and I do think it's interesting. What wound up happening, I believe, was that in the final days of his presidency, Obama then revoked the permit from the pipeline or didn't grant it.
Peter Erickson
He did. That's correct.
Robinson Meyer
It was ultimately reinstated by Trump and then partially built, and then President Biden later revoked the permit, and now we live in the world we live in. Have we ever gone back and looked? Because I think what you hear now is that a lot of oil was able to leave the tar sands even-- You know, Keystone XL basically, as I was just describing, never opened.
Peter Erickson
So, your analysis was like zero, you know, the, the Keystone XL CO2 impact was gonna be like zero to 110 million tons. Do we have a sense of where in that range we wound up?
Yeah. I don't think we really do. I mean, what I did was, you know, a forward-looking analysis. What you're suggesting is maybe there's a way to go back and look, do a backward analysis to see what actually happened. But, you know, we do know that Canada's oil was capacity constrained at times. And so, you know, they ended up building another pipeline, and you know, if you believe the Canada Energy Regulator, they may be capacity constrained again.
And so, I think there's good evidence to say that it wasn't near the zero end of that range, right? It was at least somewhere in the middle, if not higher.
Robinson Meyer
Why would it have been zero? Sorry, I just wanna — 'cause I feel like the headline of this paper is that the impact of the Keystone XL pipeline may have been way bigger than the State Department said, but the range is actually like, instead of the State Department range, which was zero to 27 million tons, yours was like zero to 110 million tons.
So what is, like, going on at the zero end of that range that would make it—
Peter Erickson
At the zero end of that range, it's just all the oil is getting to market some other way, right? And we know that didn't happen.
Robinson Meyer
Yeah. And for it to be 110, it would've been like, none of…
Peter Erickson
None of that oil was getting out otherwise.
Robinson Meyer
Do we also know that didn't happen?
Peter Erickson
Yeah, we also know that didn't happen because then they went and built, you know, the Trans Mountain Express TMX pipeline and got a lot of that oil out that way. So, you know, these are dynamic systems.
Robinson Meyer
Cool. Okay, so anyway, all of that lay in the future. So then about a decade ago, I think you wrote two papers. One is about this idea of carbon lock-in, and the other is about limiting fossil fuel production as the next big step in climate policy.
Let's talk about carbon lock-in first. So what is this idea of carbon lock-in?
Peter Erickson
Carbon lock-in is this idea that these energy systems, once you build them, especially the fossil fuel energy systems, they are able to maintain their inertia, maintain their dominance through a whole bunch of factors. But that includes economic, that includes institutional, by which I mean, you know, they have all the trade associations and community colleges and pipeline of workers that they need, and political factors, right?
They are able to continue the lobbying and other activities that keep them there as the center provider of energy for an economy.
Robinson Meyer
Is it like mostly a technical and economic story where you have these pipelines, they're expensive to build but cheap to run? I think your example is gas power plants or coal power plants as big capital-intensive projects that then once you have them, they're pretty cheap to just keep running.
So is it that's like a technical economic story? Or is it like a political story where once you have this big investment that was successful that's throwing off cash, you can reinvest a relatively small amount of that cash into your right to continue to operate?
Peter Erickson
That's right. It's both of those things. In that paper assessing carbon lock-in in 2015, we tried to bring all of those dimensions into a single framework for how to look at lock-in. Both, you know, the economic dimensions of how cheap is it to build this thing, but also another economic dimension, which is, well, once you have built it, does it really stick around for its full lifetime? Or how easy it is to unlock that thing again, right? Which is a key thing. So it's not binary.
Once you build this stuff, it's not like it's just going to keep doing its thing for 30 years necessarily, right? There are analysis tools we can bring to that. And then there are the sociopolitical dimensions, which we tried to find ways to quantify, as well in that paper.
Robinson Meyer
I do think one of the examples in that paper is coal power plants, which at the time and even now still are in— I mean, actually less now because they've been given the great gift of load growth. But through the early 2020s, even though they were locked in, were being outcompeted by gas and therefore shutting down with the help of a lot of EPA regulatory assist and legal campaigns as well.
Peter Erickson
That's a great example of why a thing that's built may not keep operating the way it was intended. And, you know, again, it's a special situation in the U.S. for reasons you know. You know, a lot of the coal plants were really old. They were beyond their useful lifetimes anyway.
But, you know, we could apply the same logic to gas plants, for example, going forward, right? Like, lots of those are being built under duress and under pressure by data centers or otherwise because they feel that they need to. But it's not automatic that those things are gonna be operated for 30 years or 40 years.
Robinson Meyer
At the same time as the carbon lock-in paper, you wrote another piece with two co-authors in Nature Climate Change, It's a case study. It looks at California specifically, but I think it builds on the Keystone XL work to say, look, climate policy should be thinking more proactively about limiting fossil fuel production as a centerpiece of climate policy.
So can you just talk about that paper a little bit?
Peter Erickson
Yeah, of course. And the slight modification I would make to what you say is I would say we were saying it could be, it can be. Here are some of the reasons why it might make sense to be, rather than a normative statement of “it should be.” But nonetheless, what we were seeing at the time is that some of the reasons to not look at supply, didn't hold up to us.
And we looked at the California context in particular, where there was a debate and activism focused on Jerry Brown, the then-governor, about stopping production and starting to wind down production in California of oil, and which is among some of the most carbon-intensive oil in the country and the world is in California, right?'Cause it's this old, very thick, dirty oil.
And what we looked at was, you know, limiting oil supply could make sense as part of a standard, just straight up by-the-books climate policy, in the sense that as you are winding down your oil demand, as California was making great plans to do, if you also wound down production at similar rates or in concert, you would be reducing the fact that downward pressure on prices that you are helping to create by reducing demand, that downward pressure in prices then makes it easier for everyone else around the world to consume oil.
And could you not, at the same time, be winding down your own oil supply and perhaps not even affecting, you know, the net import balance, right? It could all be part of a planned transition. I still stand by that concept, right? These two things can go together: energy policy about oil and gas supply, and climate policy about reducing demand for those things.
Robinson Meyer
I can see why at the time, and I would put myself in the same category here, that would be a very attractive argument, not only because you're limiting fossil fuel production, it has these global effects on the global oil market. You know, as always, the question in climate policy that nobody has a completely satisfying answer on is: How do you do climate policy in your state, your subnational or national entity in a way that advances global decarbonization? How do you do global climate policy in your state or country?
Peter Erickson
That's completely right. And just one, one more thing on that is like, I mean, that exact argument, as you just stated, was influential with the Obama White House on the question of Arctic drilling. So I don't know if you remember, but very late in Obama's presidency, he took off-line, by you know, using his presidential determinations, a bunch of oil from the Arctic that could no longer be considered, in theory, you know, for perpetuity for oil drilling.
And the argument that was with John Holdren, as I understand it, there in the White House at the time, was: how can we expect the rest of the world to be getting off oil in the ways that we, the U.S., want them to do if we're then providing them even more oil in the process?
Robinson Meyer
Oil especially is an unusually global fossil fuel market, it's a very distinctive set of global problems. Like coal is obviously in some ways worse for the climate, but coal markets are often national or regional.
But oil is this nice, big, happy global market. We build all the infrastructure so that it effectively settles on a global basis, except in moments of profound supply shock, such as right after the Iran war, and right after the Iran war started. And, because of that, removing barrels of oil from anywhere kind of affects everyone's consumption in a way that is not nearly as satisfying with, say, natural gas or coal.
It also seems like I can see, and in fact I think I, like, remember, there's another reason this argument is, I think, so appealing, or the potential for this policy is so appealing, which is not only does it satisfy, you know, our, Utopian liberal aspirations of economic planning but it also seems to address a big problem of climate policy, which is that the fossil fuel industry or the set of interests that are aligned around fossil fuels, make a lot of money and extract a lot of political power.
I mean, it's this carbon lock-in idea that they become entrenched through revenues from this existing infrastructure. Part of the case that's made for limiting fossil fuel production is also that it addresses, especially at the time, especially in the late 2010s, is also that it addresses the power of the fossil fuel industry and weakens it as a political power and political entity going forward.
Peter Erickson
I have so much to say about this, but let me just start by saying that paper that you're referencing from 2018, Limiting Production is the Next Big Step in Climate Policy, led to the California Air Resources Board holding — I mean, I'm oversimplifying, it wasn't just my paper that led to—
Robinson Meyer
No, no.
Peter Erickson
California Air Resources Board held a workshop, like a public meeting, on this in Sacramento to try to surface some of the arguments and evidence around this set of ideas.
And I was paired opposite Severin Borenstein, who I think has been a guest on your show before, and he was basically there to rebut this paper, you know, from Nature Climate Change. And, you know, we had a lively debate. We sparred, it was a lot of fun. And what he argued is that, you know, maybe Erickson has a point here. His math is basically correct, but there's another thing that he didn't show you from his math, which is that price increase that, you know, the supply-side theory is counting on to help reduce emissions, that is, in effect, a transfer of wealth from global consumers who had no say in this policy in California to the incumbent producers all around the world, the ones that are not in California, and that transfer of wealth is substantial.
And, you know, I thought that was a good point, but I thought it kind of missed this, "Hey, aren't we doing this in tandem?" idea, right? But it stuck with me ever since, just in the back of my head. And so this summer, I went back to it, and I was like, "Let's look back at that math." And I reconstructed from, you know, scratch, this economic model.
I got it to verify the calcs that Severin put forward in 2018, and I looked at, okay, say we leave that barrel of oil in the ground, and prices increase just the way we think, and it helps reduce emissions, the whole storyline that you and I have been talking about, what else happens? And it turned out— and this was what I was kind of afraid to look at in 2018, right? It turned out that the overall transfer of money from the world's consumers to the world's incumbent fossil fuel producers was greater than the amount of money that was denied that company that you no longer let develop their assets, right? And that finding is inseparable from the climate benefits that limiting supply would bring, right?
And so to me, that really complicated this idea that limiting supply is a stick in the eye to the fossil fuel industry, right? Like they are actually on net winning out when you limit supply in many cases. And of course, they know this, right? That's why they have OPEC and OPEC Plus to try to manage and limit supply themselves.
So it just made me think, you know, I don't think this part of the debate should be limited to some notes in a t2018 debate in Sacramento. I think this needs to be out there for climate advocates to wrestle with.
Robinson Meyer
So before we get to this paper you wrote this summer, in 2021 you wrote a paper that looks at U.S. fossil fuel subsidies, and it draws a very interesting conclusion. The paper looks at what you describe as — the U.S. has 16 different policies that could be construed as fossil fuel subsidies. You take a very rigorous look at subsidies. What did you find in this paper? Because when we talk about fossil fuel subsidies in the U.S., people assume when we say the U.S. is subsidizing fossil fuels, that it means the U.S. is producing more fossil fuels than it would if not for the non-existence of these subsidies.
But you find something surprising, What was it?
Peter Erickson
Find something surprising. And of course, this is all dependent on the price of oil and gas and economics and stuff, but that is what we looked at, so I think you should pay attention to what I say here. What we looked at is we gathered data on tens of thousands of oil and gas fields in the United States that were known.
They were discovered, but they had not yet been developed, right? So these are the ones that either are or are not gonna be affected by subsidies and other regulatory exemptions. And what we found is that the existence of those, like you say, 16 subsidies or regulatory exemptions, what those do is they mainly steer more profit to these projects.
They are not, at least at oil and gas prices at the time, which have been somewhat similar since, what those subsidies are not doing is leading to new projects on the ground. The project economics are not changing all that much. And so we found that well over 90% of the value of those subsidies is going directly to the profits of those companies, but that is not necessarily trickling down to new projects on the ground, which also means, you know, the jobs and other economic benefits that the fossil fuel industry claim that they are providing, right?
Robinson Meyer
Why is that?
Peter Erickson
Yeah. The reason that is, is because this is a really mature industry, right? It is sort of a, almost a, you know, classic rentier industry where they're given a huge amount of, by geology, oil and gas in the ground, and they can draw a line around that, and create a moat for themselves and produce it, right?
And so the price of oil is enough higher than the cost of developing those fields that they are able to do that. They are able to get profits, and the subsidies that are still in place are not essential, are not what is driving that investment on the ground, right? They still have enough profit margin, 15%, say, rate of return on their new projects with or without the subsidies, right?
And so, say the subsidies are taking a project that was gonna get 15% return and they're turning it into a 22% return, right? That's bad either way if you're concerned about the climate, right? We don't want this industry to have any more profits than it already has. But what we really care about at the end of the day is, are new fossil fuel projects being developed, and does the fossil fuel industry have the power to block, you know, clean energy?
Robinson Meyer
I mean, first of all, I think it actually points — and maybe we can get back to this at the end of the conversation — but it seems to point to a place you, climate policy advocates could look if they wanted to go after industry profits specifically, which is go look at the subsidies because it is, uh, actually the subsidies that's driving the surplus.
I mean, it's not only the subsidies that are driving the surplus. The surplus is kind of chemical. That's kind of the whole problem. But if you wanna look at where the additional surplus is coming from, so to speak, that these companies are using to help entrench their political power and support political candidates who oppose climate policy and, you know, lobby against climate policy, you could go after the subsidies.
It would be significant.
Peter Erickson
Yeah, and you could go after windfall, windfall profits and, you know, there are campaigns and ideas to try to do that. But, you know, just one other like specific math finding from that study, which is that we found that basically, you know, subsidies were responsible for basically almost none of the new oil projects to be developed this decade and maybe, you know, a quarter of the gas projects that would be developed this decade in the US, you know, would or would not happen without subsidies.
So, you know, essentially none of the new oil projects were dependent on these subsidies or regulatory exemptions. I mean, that tells you how mature this industry is.
Robinson Meyer
One could go after the subsidies, but be sure if you go after the subsidies you don't think you're going after emissions, 'cause you're not. You're only going after a second order input into the ultimate cocktail of political factors that determine emissions. Because as you said, you don't need the subsidies to make these projects make sense.
Peter Erickson
I think that's basically right. I mean, you know, globally there's perhaps different stories in different parts of the world, but in the U.S.…
Robinson Meyer
Is the U.S. context for…
Peter Erickson
Yeah.
Robinson Meyer
In some ways, the paper is one about corporate decision-making, you know, and what drives corporate decision-making is not lots of little tweaks on the margin to see if a project is just gonna eke out profitability or not. For oil companies to make the, you know, multi-billion dollar investments required to open a new field or open a new resource, they have to be so sure that this thing is gonna be enormously profitable going forward that it justifies them risking that capital. This is not an industry that's operating at the tenths of a margin of profit.
Peter Erickson
No, that's right. And I mean, that's why you hear so much about certainty being an issue with regard to all kinds of energy investment and why, for a long time, you know, major international commissions have gone, "Well, we need the renewable industry to be able to have more certainty in its projects to go forward."
Well, you know, there's a reason for that, right? Certainty really does matter.
Robinson Meyer
Okay, so then let's get to this 2026 paper. So if you've been listening to this, you're like, "Why are we talking about all these papers?" First of all, they're all in the, gonna be in the show notes. But second of all, we're gonna get to the future of climate policy, all that.
So this paper, "Rethinking the Case Against New Oil and Gas Fields," it was published this summer in Environmental Research Letters. I think it does complete this turn, or this honing of your thinking from, hey, we're not thinking about the importance of individual fossil fuel projects in the global marketplace in equilibrium, to like, whoa, whoa, whoa, we need better evidence before we turn every additional new fossil fuel project into, like, a fight over the future of climate policy, perhaps would be one way of putting it.
Peter Erickson
Yeah, and so big things changed in the world in that time too, right? We had, like we had COVID, we had the war in Ukraine, we've had the Strait of Hormuz, and the war on Iran really changing supply. So we've had some big real-world tests to see how supply and demand shocks play out that we can draw from.
Robinson Meyer
So first of all, let's just talk about this finding that you've already previewed, which is that when you restrain fossil fuel supply, you might be able to keep those barrels off the market. But what you are doing is engineering a massive shift of wealth to the existing fossil fuel industry. I know you've already described it a little, but just why is that?
Peter Erickson
Yeah, the reason that is, is because when you constrain supply and constrain supply outlooks, you are causing an increase in price, and that is what is needed to bring on the other new projects. And that increase in price and price outlooks is what causes consumers and all of the institutions that surround consumers, the car industries, et cetera, to reduce their oil consumption.
But that increase in price applies to every single producer in the whole world, right? You've penalized one producer or one whole region of the world by saying, "You can't produce oil here," but the price increase applies globally, and all producers see that, right? And all consumers see that. And when those economics balance out, and a new equilibrium is found, the consumers are paying for that price increase and giving the money to the producers.
And you can do straight-ahead math on that to give a first-order estimate of what happens.
Robinson Meyer
And you cite a recent example that everyone just saw, that we've been talking about on this show, which is in early 2026, Iran, following the US-Israeli war starting, closed the Strait of Hormuz. The price for oil and refined products spiked everywhere around the world.
That increased fuel costs for consumers, and it increased profits for producers. It was quite mechanical, and we all saw it happen. And effectively, what you're saying is that when you constrain fossil fuel production in some subnational region, effectively what you're doing is like a mini version of that.
Peter Erickson
That's completely right. And the logic of that has been consistent through all of my papers. But I think Hormuz and other events mean that this dynamic needs to be considered upfront. It needs to be daylighted in climate policy and in the fossil fuel supply-limiting community to grapple with, right? It is price. Price is the mechanism that causes a decrease in supply to lead to a reduction in consumption and a reduction in emissions, and that price has other effects that need to be considered.
Robinson Meyer
You'll see this idea that people will say, which is, "Look, to hit 1.5C, we need to have no new oil and gas fields." In fact, opening any new oil and gas fields or doing any kind of fossil fuel expansion is completely incompatible with a 1.5C world. is that claim supported by the literature?
Peter Erickson
Well, let's just say first, it is appealing, right? I mean, we are at the final moments of a carbon budget that would allow us to stay within 1.5C. And so therefore, it's appealing to have such simple rubrics. You know, no new fossil fuel projects are compatible. But the simplicity of that is also its real weakness, right?
I mean, if the carbon budget is so vanishingly small that no new fossil fuel projects are compatible with it, well, then nothing is compatible with it, right? Any individual ton of emissions could be the one that you point to and say, "Incompatible," right? And so really it puts the question back in my mind as to what is the effectiveness, what is the effect of any given policy that you're going to be looking at, and is that going to actually bring about the transition, help bring about the transition that we want?
And I think the idea that limiting supply or that specifically the new oil and gas fields are incompatible, like I don't think that really stands up very well in the literature. And I mean, there's like one or two papers that sort of claim that, but they don't — they have flaws.
Robinson Meyer
You mention, for instance, that one of the parts of the IPCC report that looks at, okay, how are we gonna meet these climate targets, of the 97 scenarios that preserve 1.5 C that they look at, and these are scenarios for the path of global energy development and the global energy system, fewer than half show declines in oil and gas demand rapid enough that no new oil and gas fields would be needed.
Even fewer of those that show, you know, 2 C, that show us hitting the 2 C target, show declines that are that rapid.
Peter Erickson
Yeah, just given that, to say that new oil and gas fields are incompatible with 1.5C requires a very narrow reading of the literature, meaning the science, meaning the IPCC. Or it requires saying, you know, those scenarios are a few years old now. We actually know more. You know, this newer scenarios would say that no new oil and gas fields are required. But even that requires that those pathways are feasible, right? Like the reason that the IEA, for example, comes to the logic that it does, that no new oil and gas fields are required is that they first say, they first find that oil demand would decline or would be able to decline this fast, and therefore we wouldn't, quote, need these new fields.
But they actually do not go and say that no-- that those new fields should be stopped. And they actually even explicitly say stopping new fields is not a tactic or a strategy that we think makes a lot of sense.
Robinson Meyer
In other words, the IEA wrote a scenario, and they said, "If you were to hit 1.5 C, if you wanted to do it, oil demand would have to decrease so fast that you wouldn't need new oil and gas fields. But by the way, we don't think that you should respond to this by trying to proactively shut down new oil and gas fields. We're just saying if you were to actually hit this target, then you wouldn't need these fields." And then that was kind of like that if-then statement was then, like, reversed to a then-if and said, "If you want to hit 1.5 C, then you should have no new fields.” But actually, the literature doesn't support that.
Peter Erickson
That logic is plainly wrong, you know? And the literature doesn't support it. So you can then go concoct the literature to try to support it, as some have done, but that doesn't make it right.
Robinson Meyer
It seems like you're making another argument in this paper, which is that the current arguments against limiting oil and— no new oil and gas have these analytical errors, but they also have political errors. And can you talk about the political errors, stipulating that we will never be able to analyze political errors as quantitatively and objectively as we can analyze analytical errors and economic errors?
Peter Erickson
I come at this from having experience working with, you know, Governor Jerry Brown's office or the Obama White House, and seeing how they think about this very real question. And I just think it is a really big ask to ask a politician, someone like Joe Manchin, to go against this sort of basic availability of fossil fuels and the basic community needs in their jurisdiction to make this bigger policy that would basically not necessarily be in the immediate near-term interests of their jurisdiction for very good reasons, right?
And so I just think the politics are much more complicated than this idea that we can develop an anti-fossil fuel norm or that we can, you know, shift the social license around fossil fuel companies in the way that leads to actual policy decisions by real people that face trade-offs in their jurisdictions in the United States.
And I think Joe Manchin is a great example of that. I mean, you know, he has been the most debated politician in the U.S. since the Inflation Reduction Act. But the fact that he had shot a gun at, a literal gun, at cap and trade previously in his ads, and that he got to a yes on this, you know, path-breaking legislation, I think was a huge triumph.
And the fact that he got so excoriated by anti-fossil fuel activists over it, and more to the point, not celebrated for what he actually did, I think misreads the politics of what an actual rural decision-maker in a resource-dependent community faces. And you can debate whether Joe Manchin really is that or whether he's more the face of capital, but the incentives are real.
Robinson Meyer
There's various ways I think about kind of the meso-scale of humanity's future. But one of the big ways is climate change. One of the big ways is these baseline assumptions that climate impacts are gonna be getting worse, and that at the same time, I would hope, and I am trying to advocate for policies that decarbonize the energy system over that timescale.
What can be hard is that those are our interests, yours and mine, and voters don't care. Voters don't care at all. That's not how they see the future at all. They care primarily about cheap energy. They care about the environment. They would like to see something done about climate change, but it is not a fundamental part of their worldview in the same way that it's a part of my worldview or your worldview.
And that can make it very hard, I think, for you— for people like us — to reason about it and to make arguments about it, and to say relatively common-sense things like it is a big deal that Joe Manchin, who came from a state whose economy is dominated by fossil fuels, was willing to be the yes vote on so many important parts of climate policy. Because people can point to all the bad things that he was doing that I don't think he should've been doing about climate policy. But guess what? If I was Joe Manchin, then I wouldn't have won that Senate seat because my politics aren't Joe M— You know, someone with my politics would not have won the Senate seat that…
Peter Erickson
You wouldn't have gotten in that position, and Joe Manchin was in that position. And the material interests, regardless of how he was fracturing those through his own holdings or whatever, the material interests led him to be, for very good reasons, led him to be skeptical of climate policy, and yet he got to a deal. And, you know, I don't think that many of the things he said were all that unreasonable. I don't think his advocacy for the Mountain Valley Pipeline was all that unreasonable. And—
Robinson Meyer
Well, this is the crazy thing. If environmental advocates had taken Joe Manchin's permitting reform, we wouldn't be talking about the package we're talking about right now.
Peter Erickson
That's exactly right. I mean, there's a way to look at this where Joe Manchin got massively sold out because he didn't get what he wanted. And this — I'm not saying any of this to excuse the bad parts about Joe Manchin or say that we should have taken his exact deal, but, like, it was a deal, was it not?
And the Mountain Valley Pipeline as a flashpoint for emission... I mean, I have a lot to say about the Mountain Valley Pipeline and the emissions consequences of that, that go behind the scenes in ways maybe we shouldn't get to. But, you know, there was a major group that came out and said, "Our number one climate priority is stopping the Mountain Valley Pipeline." And that same group had a consultant, that was me, who was looking at the emissions consequences of the Mountain Valley Pipeline, which were very, very small. So if you want to talk about the epistemic environment and how climate analysis of emissions connects to, you know, the statements of major environmental organizations, there's a pretty good case study of mine.
Robinson Meyer
I think that there's another piece of this that we've already kind of touched on, but that I think is worth just hitting on one more time as we leave this paper and then talk about permitting reform, talk about future climate policy. The analysis behind no new oil and gas are dubious, and it can lead people to take political stances that they don't need to take and prevent compromises from happening that would ultimately be helpful for decarbonization.
You describe going back and looking at Severin Borenstein's math. and that what he said at the time was true, which is that if you constrain fossil fuel development, you're basically engineering a massive transfer of wealth from fossil fuel consumers to fossil fuel producers. Just not the particular producer whose production you're constraining at that moment. Probably. I mean, if it's Chevron or Exxon, guess what? They have a lot of other assets in the world. And by the way, there's another whole story here, too, which is that throughout most of the history of the oil market, the key question was how would you constrain supply, not how would you increase demand. And for this reason, cartels continually emerge in the history of the global oil market to constrain the global oil market.
What you find in this paper is that if you, say, do withhold production, if you do constrain production, this transfer of wealth from consumers to producers is, like, not small. Not only is it not small, it is bigger than the scale of the barrel you have kept off the market. So you write, "For each $70 barrel of oil," of course, now it would be $90, but setting that aside — "For each $70 barrel of oil left undeveloped as a result of production-limiting policy, between about 60 and $350 are transferred from global oil consumers to producers. The enrichment of oil producers is greater than the revenue denied the company no longer able to develop its oil assets."
And so if you keep oil off the market, you're actually engineering more than the value of that oil going to the global fossil fuel capital stack.
Peter Erickson
Yeah. That's right. And given what we know right now, I mean, I did also point to a few special cases, you know, certain combinations of elasticities where that would not be the case, right? You know, if we really were on a very rapid transition down in energy demand, then we would be at a place where oil producers would be much more competitive, right?
And the increase in price as a result of any additional barrel pulled off the market would be so low that the sign of that would flip. And, you know, some people I've talked to in response to this paper said, "Well, Isn't it plausible that we're on that path? Aren't we winning the war against oil demand?" And they point to, you know, rates of electric vehicle purchases in Brazil or China or wherever. And I say, "I mean, that's fine. That is maybe — maybe we are on that path." But like people have been telling us we're at peak oil demand for a long time now, right? We are probably at more of a plateau in oil demand. And until we see really good signs that oil demand has peaked and is going down, I think economics and the politics of limiting supply are not as strong as many advocates would like.
Robinson Meyer
All of this now brings us to today, where, in a concrete way, there's a bill in Congress that would include some concessions for fossil fuel companies and also include a lot of concessions and incentives and things that clean energy companies want. It would make it easier, much easier to build clean and I wanna talk about that bill.
This is not the first time this has happened since 2020, where there is a piece of legislation or a piece of policy on the table that would make it easier for oil companies in some ways and make it easier for clean energy companies in a lot of other ways. Where does this leave you? How are you thinking about these issues in a broad way today? What are you thinking about climate policy today?
Peter Erickson
It's a tough place for climate policy qua climate policy, right? And I think there is reason to be really hopeful about the pace of renewables, you know, as we've seen costs coming down, et cetera. But there's a difference between a rapidly accelerating industry, a low-carbon energy industry, and one that we know can keep going at the pace that we need it to ultimately displace fossil fuels, right?
Some people talk about this in terms of increasing returns to scale or, you know, S-curve type dynamics, where there's sort of a line out there among climate and energy policy folks that like, "Oh, you know, we've finally gotten somewhere. Renewables are finally up the S-curve. They are winning. They are going fast." And I think while that is true and that is hopeful, that speed and the continuation of that is not guaranteed at all, right? There's a paper that came out this summer from a group of social scientists in Europe that looked at past energy transitions, like in individual countries, and what they found is, like, how far the S-curve goes before it plateaus and flattens out is really also a function of policy. And you need the policies that allow that speed to keep going. You need the grid integration. You need the permitting reform, even, to let that industry keep growing up into something that can really take on fossil fuels.
So, I think this is a bill that comes at a very important time.
Robinson Meyer
I think where this conversation started, right, actually why it started, in some ways why you and I started talking about this topic and about permitting reform was you said in your carbon lock-in paper you wished you had emphasized things a little differently. And that you'd wish you'd emphasized them differently 'cause they're ideas that are as important now as they were then. So what do you wish you had done differently in that paper that to some degree started all of this off, you know…
Peter Erickson
I think that assessing carbon lock-in paper from 2015 was really good, and it's been cited a whole —
Robinson Meyer
It's great. Yes, it's great. I wanna…
Peter Erickson
But it was in a policy environment where carbon lock-in was much on the people's minds, and we framed the analysis as, you know, you need to not keep making carbon lock-in worse.
But all of the math and the analysis that we did and put into that could just as easily have supported a different take, and it still can support a different take. And that take is that the best way to unseat carbon lock-in, based on our same math and our same findings and all of the literature, is to grow what can beat it, grow low-carbon energy as fast as you can and for as long as you can.
And let me try to crystallize that in terms of one of the pieces of analysis that we did then. As I mentioned, we looked at a whole bunch of different ways to look at carbon lock-in, right? What is carbon lock-in, and how do you unseat it? And one of the things we looked at is we developed this ratio that would say you give a unit of help to both the fossil fuel industry and its obvious replacement in clean energy.
We developed this ratio: say you give the same unit of help, who benefits more? And so we looked at, for example, gas power versus either wind or solar. And if you give those two the same unit of help, the renewables are gonna benefit two to three times more from that same benefit of help as would the gas power plant.
And the reason for that is economics in part, but it extends beyond economics too, right? Because we've heard that these renewables can compete on cost, and so that's sort of the price and economics reason. You know, you're moving them up the S-curve of technology deployment.
But there's a whole set of other conditions that go around that, that allow that speed to be maybe accelerated or allow that speed to be maintained, and that is the institutions that sit around these insurgent industries that the incumbents already have and that the insurgents don't really. So these are things like the trade associations that have enough members and are big enough to actually do things on the ground.
These are things like the fact that there are enough people that work in this industry that you know them in your community, and maybe you go to the bar together, and then maybe you have a softball team, and then maybe, you know, the whole community comes and rallies around your softball team. And all of a sudden, you are a going concern culturally and politically.
And those extra factors are really important in how far an industry can go and how quickly it can scale in the long term. And so that is what we were trying to capture with that dynamic, with that ratio of a unit of help to fossil versus clean benefits clean like two to three times more than it does the fossil.
Robinson Meyer
Where does that shake out for permitting reform?
Peter Erickson
Well, where permitting reform shakes out, you know, there are so many provisions in the bill, but on the fundamentals, I think what that means for permitting reform is that the renewable industry really does need this. This is a critical time to help the renewable industry keep its pace of growth.
This is gonna be a cheesy metaphor, right? But when we're talking about the power of the fossil fuel industry, like it's sometimes talked about as David and Goliath, right? And I'm sure that there were all kinds of lawsuits to try to take Goliath's sword away, and I'm sure there were all kinds of comms campaigns to move the Overton window about just how bad Goliath was, right? But like, if some upstart who's been working with their slingshot to throw things really fast, and they've got five smooth stones, and they've practiced on all the lions and the bears out there, let's have that upstart get a shot.
Robinson Meyer
What would you need to see in the permitting ... and you haven't looked at it. I mean, you're not a U.S. senator. It's not your job to say whether it's a good deal or not. But if you were, or just like what would you need to see to make you think the permitting deal or compromises like it are worth it, versus what would make you think that it's not worth it?
Peter Erickson
I care a lot about climate change. I am a climate policy analyst. I look at bills for my whole career and policy from the perspective of, does this thing dramatically reduce emissions or not? You know, is the upside better and substantially better than the downside? So that is the lens that I would look at, that I am looking at it.
I am a quantitative analyst. I like to see the numbers. There's lots of opinions being weighed on this that are hard to weigh without some analysis. So I think those are forthcoming. I have reasonable, you know, confidence that those are forthcoming. So I'm on the sidelines waiting to look at that, and that is the yardstick that I will use.
Robinson Meyer
Well that is great, and when they come out we'll have to talk about them. This has been a great conversation. Peter Erickson, thank you so much for joining us on Shift Key.
Peter Erickson
Thank you, Rob. Was really fun.


 Stanford.


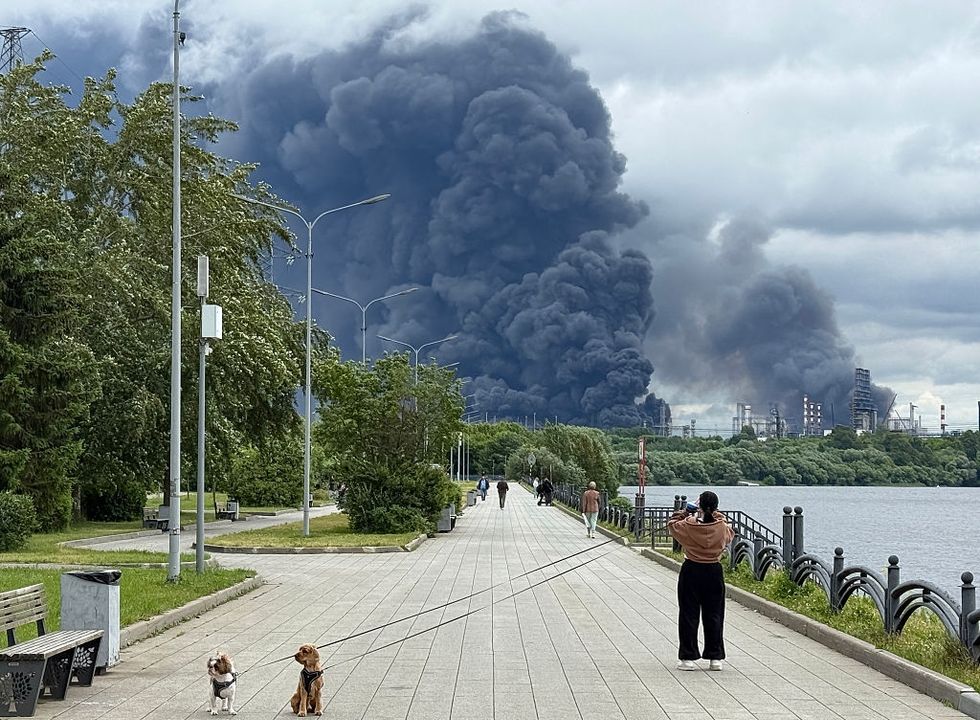 Smoke billows from a Gazprom refinery outside Moscow following a drone attack. AFP via Getty Images