You’re out of free articles.
Log in
To continue reading, log in to your account.
Create a Free Account
To unlock more free articles, please create a free account.
Sign In or Create an Account.
By continuing, you agree to the Terms of Service and acknowledge our Privacy Policy
Welcome to Heatmap
Thank you for registering with Heatmap. Climate change is one of the greatest challenges of our lives, a force reshaping our economy, our politics, and our culture. We hope to be your trusted, friendly, and insightful guide to that transformation. Please enjoy your free articles. You can check your profile here .
subscribe to get Unlimited access
Offer for a Heatmap News Unlimited Access subscription; please note that your subscription will renew automatically unless you cancel prior to renewal. Cancellation takes effect at the end of your current billing period. We will let you know in advance of any price changes. Taxes may apply. Offer terms are subject to change.
Subscribe to get unlimited Access
Hey, you are out of free articles but you are only a few clicks away from full access. Subscribe below and take advantage of our introductory offer.
subscribe to get Unlimited access
Offer for a Heatmap News Unlimited Access subscription; please note that your subscription will renew automatically unless you cancel prior to renewal. Cancellation takes effect at the end of your current billing period. We will let you know in advance of any price changes. Taxes may apply. Offer terms are subject to change.
Create Your Account
Please Enter Your Password
Forgot your password?
Please enter the email address you use for your account so we can send you a link to reset your password:
A practical guide to using the climate law to get cheaper solar panels, heat pumps, and more.

Today marks the one year anniversary of the Inflation Reduction Act, the biggest investment in tackling climate change the United States has ever made. The law consists of dozens of subsidies to help individuals, households, and businesses adopt clean energy technologies. Many of these solutions will also help people save money on their energy bills, reduce pollution, and improve their resilience to disasters.
But understanding how much funding is available for what, and how to get it, can be pretty confusing. Many Americans are not even aware that these programs exist. A poll conducted by The Washington Post and the University of Maryland in late July found that about 66% of Americans say they have heard “little” or “nothing at all” about the law’s incentives for installing rooftop solar panels, and 77% have heard little or nothing about subsidies for heat pumps. This tracks similar polling that Heatmap conducted last winter, suggesting not much has changed since then.
Below is Heatmap’s guide to the IRA’s incentives for cutting your carbon footprint at home. If you haven’t heard much about how the IRA can help you decarbonize your life, this guide is for you. If you have heard about the available subsidies, but aren’t sure how much they are worth or where to begin, I’ll walk you through it. (And if you’re looking for information about the electric vehicle tax credit, my colleague at Heatmap Robinson Meyer has you covered with this buyer’s guide.)
Get one great climate story in your inbox every day:
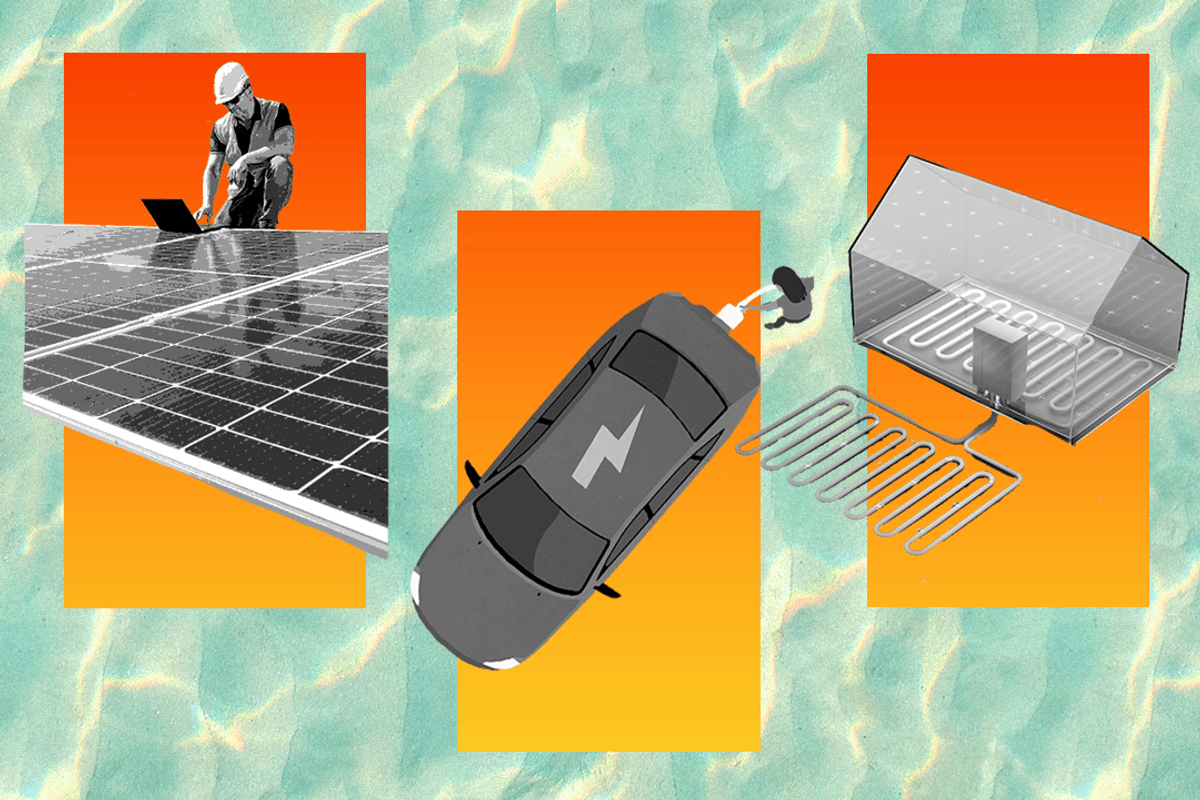
There’s funding for almost every solution you can think of to make your home more energy efficient and reduce your fossil fuel use, whether you want to install solar panels, insulate your attic, replace your windows, or buy electric appliances. If you need new wiring or an electrical panel upgrade before you can get heat pumps or solar panels, there’s some money available for that, too.
The IRA created two types of incentives for home energy efficiency improvements: Unlimited tax credits that will lower the amount you owe when you file your taxes, and $8.8 billion in rebates that function as up-front discounts or post-installation refunds on equipment and services.
The tax credits are available now, but the rebates are not. The latter will be administered by states, which must apply for funding and create programs before the money can go out. The Biden administration began accepting applications at the end of July and expects states to begin rolling out their programs later this year or early next.
The home tax credits are available to everyone that owes taxes. The rebates, however, will have income restrictions (more on this later).
“The Inflation Reduction Act is not a limited time offer,” according to Ari Matusiak, the CEO of the nonprofit advocacy group Rewiring America. The rebate programs will only be available until the money runs out, but, again, none of them have started yet. Meanwhile, there’s no limit on how many people can claim the tax credits, and they’ll be available for at least the next decade. That means you don’t need to rush and replace your hot water heater if you have one that works fine. But when it does break down, you’ll have help paying for a replacement.
You might want to hold off on buying new appliances or getting insulation — basically any improvements inside your house. There are tax credits available for a lot of this stuff right now, but you’ll likely be able to stack them with rebates in the future.
However, if you’re thinking of installing solar panels on your roof or getting a backup battery system, there’s no need to wait. The rebates will not cover those technologies.
A few other caveats: There’s a good chance your state, city, or utility already offers rebates or other incentives for many of these solutions. Check with your state’s energy office or your utility to find out what’s available. Also, it can take months to get quotes and line up contractors to get this kind of work done. If you want to be ready when the rebates hit, it’s probably a good idea to do some of the legwork now.
If you do nothing else this year, consider getting a professional home energy audit. This will cost several hundred dollars, depending on where you live, but you’ll be able to get 30% off or up to $150 back under the IRA’s home improvement tax credit. Doing an audit will help you figure out which solutions will give you the biggest bang for your buck, and how to prioritize them once more funding becomes available. The auditor might even be able to explain all of the existing local rebate programs you’re eligible for.
The Internal Revenue Service will allow you to work with any home energy auditor until the end of this year, but beginning in 2024, you must hire an auditor with specific qualifications in order to claim the credit.
Let’s start with what’s inside your home. In addition to an energy audit, the Energy Efficiency Home Improvement Credit offers consumers 30% off the cost (after any other subsidies, and excluding labor) of Energy Star-rated windows and doors, insulation, and air sealing.
There’s a maximum amount you can claim for each type of equipment each year:
$600 for windows
$500 for doors
$1,200 for air sealing and insulation
The Energy Efficiency Home Improvement Credit also covers heat pumps, heat pump water heaters, and electrical panel upgrades, including the cost of installation for those systems. You can get:
$2,000 for heat pumps
$600 for a new electrical panel
Yes, homeowners can only claim up to $3,200 per year under this program until 2032.
Also, one downside to the Energy Efficiency Home Improvement Credit is that it does not carry over. If you spend enough on efficiency to qualify for the full $3,200 in a given year, but you only owe the federal government $2,000 for the year, your bill will go to zero and you will miss out on the remaining $1,200 credit. So it could be worth your while to spread the work out.
The other big consumer-oriented tax credit, the Residential Clean Energy Credit, offers homeowners 30% off the cost of solar panels and solar water heaters. It also covers battery systems, which store energy from the grid or from your solar panels that you can use when there’s a blackout, or sell back to your utility when the grid needs more power.
The subsidy has no limits, so if you spend $35,000 on solar panels and battery storage, including labor, you’ll be eligible for the full 30% refund, or $10,500. The credit can also be rolled over, so if your tax liability that year is only $5,000, you’ll be able to claim more of it the following year, and continue doing so until you’ve received the full value.
Geothermal heating systems are also covered under this credit. (Geothermal heat pumps work similarly to regular heat pumps, but they use the ground as a source and sink for heat, rather than the ambient air.)
Here’s what we know right now. The IRA funded two rebate programs. One, known as the Home Energy Performance-Based Whole House Rebates, will provide discounts to homeowners and landlords based on the amount of energy a home upgrade is predicted to save.
Congress did not specify which energy-saving measures qualify — that’s something state energy offices will decide when they design their programs. But it did cap the total amount each household could receive, based on income. For example, if your household earns under 80% of the area median income, and you make improvements that cut your energy use by 35%, you’ll be eligible for up to $8,000. If your household earns more than that, you can get up to $4,000.
There’s also the High-Efficiency Electric Home Rebate Program, which will provide discounts on specific electric appliances like heat pumps, an induction stove, and an electric clothes dryer, as well as a new electrical panel and wiring. Individual households can get up to $14,000 in discounts under this program, although there are caps on how much is available for each piece of equipment. This money will only be available to low- and moderate-income households, or those earning under 150% of the area median income.
Renters with a household income below 150% of the area median income qualify for rebates on appliances that they should be able to install without permission from their landlords, and that they can take with them if they move. For example, portable appliances like tabletop induction burners, clothes dryers, and window-unit heat pumps are all eligible for rebates.
It’s also worth noting that there is a lot of funding available for multifamily building owners. If you have a good relationship with your landlord, you might want to talk to them about the opportunity to make lasting investments in their property. Under the performance-based rebates program, apartment building owners can get up to $400,000 for energy efficiency projects.
For the most part, yes. But the calculus gets tricky when it comes to heat pumps.
Experts generally agree that no matter where you live, switching from an oil or propane-burning heating system or electric resistance heaters to heat pumps will lower your energy bills. Not so if you’re switching over from natural gas.
Electric heat pumps are three to four times more efficient than natural gas heating systems, but electricity is so much more expensive than gas in some parts of the country that switching from gas to a heat pump can increase your overall bills a bit. Especially if you also electrify your water heater, stove, and clothes dryer.
That being said, Rewiring America estimates that switching from gas to a heat pump will lower bills for about 60% of households. Many utilities offer tools that will help you calculate your bills if you make the switch.
The good news is that all the measures I’ve discussed in this article are expected to cut carbon emissions and pollution, even if most of your region’s electricity still comes from fossil fuels. For some, that might be worth the monthly premium.
Tax Credit #1 offers 30% off the cost of energy audits, windows, doors, insulation, air sealing, heat pumps, electrical panels, with a $3200-per-year allowance and individual item limits.
Tax Credit #2 offers 30% off the cost of solar panels, solar water heaters, batteries, and geothermal heating systems.
Rebate Program #1 will offer discounts on whole-home efficiency upgrades depending on how much they reduce your energy use, with an $8,000 cap for lower-income families and a $4,000 cap for everyone else.
Rebate Program #2 is only for low- and moderate- income households, and will offer discounts on specific electric appliances, with a $14,000 cap.
Read more about the Inflation Reduction Act:
Log in
To continue reading, log in to your account.
Create a Free Account
To unlock more free articles, please create a free account.
Current conditions: Snow is returning to the Upper Midwest, with as much as a foot set to dump on Duluth, Minnesota • Crater Lake National Park in Oregon just registered the lowest snow water equivalent ever recorded for this time of year • Pago Pago, the capital of American Samoa and the United States’ southernmost city, is weathering days of intense thunderstorms.
Big news from over here at Heatmap: Today, in partnership with the Massachusetts Institute of Technology and CleanEcon, we launched the Electricity Price Hub, a new public data platform that provides monthly, utility-level estimates of residential electricity rates and bills across the United States going back to 2021, broken down by generation, transmission, and distribution costs.
To kick off the new feature, we have:

Total residential electricity costs as a fraction of personal expenditure came out to 1.25%, according to new data from the Lawrence Berkeley National Laboratory. That would be near an all-time low, but slightly above 2024 levels. Total residential electricity costs as a fraction of total income was also near an all-time low, at 1%. Once again, that metric was also flat in recent years with a slight increase in 2025.
Sign up to receive Heatmap AM in your inbox every morning:
Last week, Slovenia became the first European Union nation to introduce fuel rationing amid the energy shock from the Iran War. Now the European Commission has begun urging Europeans to work from home and drive and fly less. Brussels’ top governing body also pressed countries across the bloc to speed up construction of renewables. “Even if … peace is here tomorrow, still we will not go back to normal in the foreseeable future,” Dan Jorgensen, the EU’s energy chief, said in a speech to the energy ministers from all 27 nations, according to Politico.
On Tuesday, Secretary of the Interior Doug Burgum assembled the so-called “God Squad,” a rarely-used committee with the authority to waive Endangered Species Act protections under exceptional circumstances. In this case, Burgum gathered the panel to exempt federally-permitted oil and gas drilling in the Gulf of Mexico from the landmark conservation law on national security grounds. The move came in response to a request from Secretary of Defense Pete Hegseth. “It took the Trump administration 15 minutes to wipe our crucial environmental safeguards in the Gulf of Mexico,” Jimmy Tobias and Chris D’Angelo wrote in the conservation newsletter Public Domain yesterday. “It took them 15 minutes to condemn an endangered animal to possible extinction. It took them 15 minutes to play God.”
The Trump administration has previously given credence to species conservation arguments against wind energy, both onshore and off. As my colleague Jael Holzman has covered, the administration has used laws protecting eagles to extract information and fines from wind farms, and has appeared to follow a playbook laid out by anti-offshore wind activist groups that includes leveraging marine species protections to block development.
General Motors has once again idled production at its Factory Zero electric vehicle plant in Detroit as demand wanes. The move comes less than three months after a mass layoff and reduction to a single shift, Automotive News reported. The facility was part of a $2.2 billion investment in 2021 to manufacture the GMC Hummer EV and Sierra EV, the Chevrolet Silverado EV, and the Cadillac Escalade IQ electric SUV. The latest temporary layoff impacts 1,300 workers, who were told to stay home starting March 16 and return to work on April 13, the United Auto Workers told InsideEVs.
Just a few years ago, you’d be mistaken for thinking this was an April Fool’s Day joke: New England is going atomic. The governors of all six states signed onto a statement Tuesday outlining steps for what they said is to “strengthen the region’s energy reliability, affordability, and long-term supply” of electricity. “New England has a long tradition of collaborating on regional energy matters. As governors, we are committed to safeguarding our collective energy future through advancement of a diverse energy strategy that includes nuclear power, a pillar of New England’s electric system,” the governors of Massachusetts, Connecticut, Maine, New Hampshire, Rhode Island, and Vermont wrote.
Introducing the Electricity Price Hub, a partnership between Heatmap News and MIT in collaboration with CleanEcon designed to bring much-needed clarity to the conversation around energy affordability.
As the energy shock generated by the Iran War ripples through the global economy, gas prices are front of mind for many Americans. They are the most visible energy prices in our lives — posted on billboards along the highway and in towns and cities across the country, updated on a day-to-day, even hour-to-hour, basis.
Electricity prices, by contrast, are far less transparent. Even as prices rise across the country, it is difficult for households and businesses to see, let alone understand the price they are paying for electricity and what is behind it.
In nominal terms, electricity rates are up by an average of 33% over the past five years nationwide, adding $35 on average to household bills every month, or $420 per year. Prices in 32 states grew by more than 25% in that time, with six states experiencing increases of over 50%. As electricity prices increase, what was once a relatively stable line item in many Americans’ budgets is now more volatile, compounding broader cost of living pressures.
As the stakes rise for American consumers, the lack of transparency also makes effective policymaking more difficult: Regulators and politicians are making high-stakes decisions about reliability, affordability, and future investment with, at best, partial information.
That is why Heatmap and MIT are launching the Electricity Price Hub, a new public data platform built to address this information gap. The hub provides month-to-month estimates of residential electricity prices and bills for utilities across the United States, from 2020 to the present. For the largest utilities, these estimates are broken down into their core components. By making this data available down to the zip code level, the hub empowers users to understand what they are paying and see how that compares to neighboring communities and states.
That clarity is urgently needed. More than half of Americans say that power bills are causing at least “a decent amount” of stress on their budgets, according to a Heatmap Pro poll from last fall. Electricity prices have already emerged as a political issue in states like New Jersey, Virginia, and Georgia — and are likely to keep rising in voters’ minds.
Last year utilities asked state regulators to approve more than $28 billion in rate increases, according to the research and advocacy group PowerLines. Many of these rate increases won’t take effect for months or even years to come, meaning that some amount of price increase is baked in regardless of how the policy and technology environment changes.
But electricity prices are not the only problem. If the cost per kilowatt-hour of electricity is analogous to the number projected on the neon sign at the gas station, the total monthly cost of electricity use is what you see at the bottom of your receipt when you fill up. As anyone who has ever driven a gas car knows, the ultimate expense is a function of both the size of your tank and how fuel-efficient your car is.
Even where electricity prices appear moderate, electricity bills can be high. Alabama Power, for example, has prices that are just $0.05 above (or 1.3x) the national average. But its average residential bills are among the nation’s highest, at nearly $100 over the national average. (Heatmap’s Emily Pontecorvo has more on how trends in prices and bills can diverge.)
In many areas, it’s not just that bills are rising. Sharp swings in bills are especially difficult for households to manage. The median difference between the highest and lowest bills in 2025 was $92 (a 91% difference). Zooming in on a subset of utilities with the greatest bill volatility, peak-to-trough bill differences often exceed $200, with percentage swings of 200% to 280%. Two utilities in New Jersey, for example, saw average residential bills increase by more than $275 between spring and peak summer months.
Why have electricity prices remained so deeply opaque? In part, this is a function of the byzantine structures that govern our electricity system. We have three major grids, seven regional transmission authorities, 51 state-level regulators, more than 800 rural co-operatives, and roughly 3,000 utilities.
The result is a data environment that is fragmented and inconsistent, and lags well behind real-time price changes:
In the absence of reliable data, simplified narratives fill the void, allowing anyone to pick their chosen villain — be it renewables, data centers, transmission lines, or environmental policies — to blame for system failures. Policymakers risk adopting blunt measures that provide limited and temporary relief but that fail to address critical underlying issues, including the investments required to protect the grid’s long-term reliability and affordability.
Addressing these challenges starts with more timely and detailed data. That is what the Electricity Price Hub is all about. The platform delivers timely data for utilities serving the vast majority of residential customers in each state, with standard estimates that are comparable across states with different regulatory systems and across utilities with different rate structures.
It provides monthly, up-to-date estimates of both electricity prices and bills for a typical residential customer, offering a clearer view of the real cost burden households face and how that burden varies across places and over time. These estimates are more current than any existing public data sources.
We construct these estimates by combining detailed price and price component data for the largest utilities, sourced from state filings and utility rate books. We complement that with data for a wider set of utilities from the U.S. Energy Information Administration to generate standardized, current estimates of monthly average prices and bills.
We also disaggregate electricity prices into their core components: generation, the cost of producing electricity; transmission, the cost of moving power over long distances; distribution, the cost of getting electricity “the last mile” to homes and businesses; and other, a grab bag of regulatory and system-level charges. (You can find more on our methodology here.)
By standardizing and updating this information on a monthly basis, the platform is designed to inform consumers and businesses, and equip federal and state policymakers, regulators, and researchers with the information needed to design targeted, evidence-based responses.
You can now explore this tool for yourself, but here’s what we’ve already learned: There isn’t one cause of rising electricity costs. Prices are rising for different reasons in different places. There is no single national explanation for surging power prices.
Take our data on Maine. The state has long had some of the country’s most expensive electricity prices, and in recent years, distribution-related charges have been rising steadily. The utility Versant Power, for example, has seen distribution charges more than double over the last five years. The rising costs of maintaining and repairing aging distribution infrastructure, made worse by the increasing equipment and construction costs, are behind that trend.
In other parts of the country, extreme weather is driving higher distribution costs. While wildfire-related costs in California currently offer the most extreme example, storm costs are showing up in rising bills across the country. In Florida, for example, Tampa Electric customers have seen storm-related charges rise steadily, increasing from a credit in 2020 to more than $0.027 per kilowatt-hour in 2025.
Elsewhere, other factors are at play. In parts of the Mid-Atlantic, persistent bottlenecks in adding new capacity to the grid — as well as surging power demand, driven primarily by data centers — are causing generation costs to get bid up. In New Jersey, for example, the utility Atlantic City Electric Co’s generation-related charges have increased by more than 50% year on year.
You can already find other stories from the Electricity Price Hub from Heatmap reporters across the site. In some states, for instance, “other” charges are driving up power bills. We also look in detail at what’s going on with prices in PJM Interconnection, the country’s largest grid.
We hope this hub is only the beginning of a new era in open electricity data. If we want a modern electricity system that can deliver affordability, reliability, decarbonization, and economic growth, we will need a modern, up-to-date, and localized data infrastructure to match.
Rob announces the Electricity Price Hub, a new project from Heatmap News and MIT, alongside guests Brian Deese and Lauren Sidner.
Electricity prices rose faster than overall inflation last year. Yet at the local level, it’s been difficult to know why. Is it data centers? Renewables? Aging infrastructure? Or something else more mysterious? Everyone in the political system — including senior Trump officials — wants to blame their favorite energy bugbear. But if we actually want to fix the problem, getting the real answer matters.
Now, Heatmap and MIT’s Center for Energy and Environmental Policy Research are teaming up to answer this critical question. On this episode of Shift Key, Rob announces the launch of the Electricity Price Hub, a new public data platform that provides monthly, utility-level estimates of residential electricity rates and bills across the United States going back to 2021, broken down by generation, transmission, and distribution costs.
Joining Rob to discuss the tool are Brian Deese, an MIT Institute Innovation Fellow and the former director of the White House National Economic Council under President Biden, and Lauren Sidner, a senior advisor at MIT's Center for Energy and Environmental Policy who previously served as a senior advisor to U.S. Special Presidential Envoy for Climate John Kerry.
Shift Key is hosted by Robinson Meyer, the founding executive editor of Heatmap News.
Subscribe to “Shift Key” and find this episode on Apple Podcasts, Spotify, Amazon, or wherever you get your podcasts.
You can also add the show’s RSS feed to your podcast app to follow us directly.
Here is an excerpt from their conversation:
Brian Deese: Bills matter in an absolute sense, but rates do matter in a relative sense, because people’s lived experience is also not just about ... It’s why inflation has the unsettling economic effect that it has, which is that as prices go up, even if they’re off a lower base — your point about Manhattan is a good one, which is it’s a good example of sort of high rates, low bills. But if the rate of increase of the bill is going up, then it also means that people are going to feel this more.
Robinson Meyer: And it’s complicated because from a utility revenue perspective, the bill is also what matters. And if you think about from a systems perspective, the utility is trying to recoup the costs of running its system and then make a profit. The volumetric rate is a technical mechanism it uses to like allot the costs of running its system, but actually, the size of the revenue that it receives from each household matters far more in terms of its ability to turn a profit, to cover its cost, to invest further in the system. That is the number that matters in terms of actual upkeep for the system — although I still find it requires a bit of a brain reformatting to remember that’s actually how the entire power grid works.
Deese: It’s why it has been so difficult for us to figure out how to credit efficiency within our system. Because in an overly crude way, if the bill matters, then the utility actually wants to avoid incremental efficiency, which is not true in practice. But the mechanism to actually credit efficiency, whether that efficiency is actually at the household level or is efficiency of the system, efficiency of the grid, capacity and storage — all of those things run into this basic challenge, which is, if you make the system more efficient, the utility often doesn’t get paid for it.
Meyer: This is one of the classic problems that I think we’re now struggling with in terms of governing utilities. I mean, when you looked at individual states or individual political jurisdictions, were there any that stood out where you were like, man, you can really see in this state the difficulty of utility governance or the difficulty of incentivizing utilities or customers to be more efficient in their energy use?
Lauren Sidner: A good number of states have adopted mechanisms that try to do away with the sort of internal disincentive to support efficiency. So very frequently, you’ll see charges that allow utilities to recover the costs of efficiency programs. But you will also, in maybe a more limited number of examples, see charges that allow utilities to recover the revenue that they lose because of those programs, or because of distributed energy or other policy-related aims that may be in place. I believe Arizona has that kind of recovery mechanism, but it’s not uncommon.
And then occasionally in states like California, you’ll see charges that will give a benefit to a customer for using less power. So it’ll be a tiered charge where if the customer kind of stays within the lower tier, they can actually get sort of a bill credit or something along those lines. So they sometimes even build it into the rate design in addition to just making sure the utility is made whole for supporting that kind of investment.
You can find a full transcript of the episode here.
Mentioned:
What Americans Really Pay For Electricity, by Brian Deese and Robinson Meyer
Factors Influencing Recent Trends in Retail Electricity Prices in the United States
Rob’s piece on power prices from last year: How Electricity Got to Be So Expensive
This episode of Shift Key is sponsored by …
Heatmap Pro brings all of our research, reporting, and insights down to the local level. The software platform tracks all local opposition to clean energy and data centers, forecasts community sentiment, and guides data-driven engagement campaigns. today to see the premier intelligence platform for project permitting and community engagement. Book a demo today to see the premier intelligence platform for project permitting and community engagement.
Music for Shift Key is by Adam Kromelow.