In February, the Department of Energy issued its largest-ever loan to Southern Company to fund up to 6 gigawatts of uprates across the utility’s nuclear fleet. Last week, Amazon signed a deal with Constellation Energy, the nation’s largest operator of nuclear reactors, to uprate the Calvert Cliffs plant in Maryland to generate another 190 megawatts on top of its current 1.8-gigawatt output. Soon after, the Energy Department offered nuclear operator Vistra a $4 billion loan to uprate plants in Ohio and Pennsylvania.
Then on Tuesday, Google inked its own deal with Constellation aimed at wringing out 890 megawatts of new power from 11 reactors across PJM Interconnection, the nation’s second-biggest and arguably most overworked grid system.
“Everyone loves nuclear, but it takes a really long time to build,” Raiford Smith, Google’s head of power and energy for the cloud, told me yesterday. “The fastest way to get it is via uprates. It’s real megawatts, but the quicker, shorter-term approach.”
Building new reactors, he said, “is the intermediate term plan, and we see fusion as the longer term bet.” Given that “new data centers are coming on at a gigawatt a clip, that means even with all the uprates, there’s still more to come,” he added.
The investments into existing nuclear stations deliver a win for Constellation, whose chief executive, Joe Dominguez, has been among the more vocal C-suite skeptics of what my colleague Matthew Zeitlin described as utility executives’ “load growth mania” over the past two years. But the deals say as much about the shifting lines in the debate over how to expand the nuclear power fleet in this country — what size reactors are better, how to finance projects — as the disagreement over how much new generation is needed to supply the artificial intelligence boom.
The deal “is a win-win,” Emmet Penney, the director of energy and infrastructure at the think tank Foundation for American Innovation, told me. “Constellation and Google are revealing just how essential our nuclear fleet is to maintaining our energy dominance.”
America’s last attempt at a nuclear buildout ended in a series of financial boondoggles. The problems traced back to numerous factors: Decades without any nuclear construction atrophied the workforce. Electricity market reforms aimed at breaking up monopoly utilities left the industry with few players equipped with large enough balance sheets to take on megaprojects that would take years to build and billions of dollars of upfront capital. Increased competition from cheap natural gas.
The only two new reactors that made it over the finish line, Southern’s pair of Westinghouse AP1000s at the Alvin W. Vogtle Generating Station in eastern Georgia, came in billions of dollars over budget, in part because the developers erred in choosing a Nuclear Regulatory Commission licensing pathway that required long stops and costly delays every time the builders tweaked the design. Since those were the first AP1000s constructed in the U.S., there were plenty of last-minute design kinks to iron out.
In the meantime, the industry rallied behind the idea of small modular reactors. By making individual reactors roughly a third or less powerful than large-scale units such as the AP1000, the thinking went, developers would need to buy more, helping the technology slide down the cost curve through repeated construction and assembly-line manufacturing of components.
While Google and Amazon both backed fourth-generation startups whose designs use coolants other than water, such as liquid sodium or helium gas, the only such reactor operating in the world is in China, and America’s track record of running similar plants is poor. As such, government-owned utilities such as Canada’s Ontario Power Generation and America’s Tennessee Valley Authority have thrown their weight behind third-generation SMRs that essentially just shrink down existing water-cooled technology. The first of GE Vernova Hitachi Nuclear Energy’s BWRX-300s, a 300-megawatt design based on the boiling water reactors that make up about a third of the U.S. fleet, is now underway at OPG’s Darlington plant. In the U.S., meanwhile, the NRC just issued a construction license for the TVA’s first BRWX-300.
But the completion of the second AP1000 at Plant Vogtle demonstrated an uncomfortable reality proposed by researchers at the Massachusetts Institute of Technology: That the next, cheapest reactor to build in the U.S. would be another of Westinghouse’s flagship design. Vogtle Unit 4 came online in 2024 roughly 30% cheaper and faster than its slightly older twin, Vogtle Unit 3.
If that reduction seemed to justify the approach SMR companies were pursuing, a report by an economist and former antinuclear researcher raises new questions. The study by Charles Komanoff, which I covered here last month, suggests that the number of reactors required to achieve major cost reduction through “economies of duplication” pales in comparison to the price drop achieved through “economies of scale.” In other words, the nuclear industry’s time-tested approach to making reactors more economical — making them bigger — is still the best bet.
The Trump administration certainly agrees. The Energy Department laid plans for at least 10 new AP1000s last year, and put up another nearly $20 billion loan package for utilities that form joint ventures with Westinghouse to build one of the 1,100-megawatt reactors. South Korea is currently working out the fine print on a deal to help finance and build as many as six AP1000s and two APR1400s, the Korean rival to the Westinghouse reactor.
Whether any American utilities step up to help build any of those AP1000s remains an open question.
“There’s no way any utilities could consider building a large AP1000 because doing so could bankrupt the whole operation, and they don’t have enough confidence,” Chris Gadomski, the lead nuclear analyst at the consultancy BloombergNEF, told me.
The workforce that constructed the two AP1000s at Vogtle, he said, are now out building data centers. Unlike the Chinese, whose state-owned nuclear companies reverse engineered the AP1000 and made it relatively cheap to build by constructing as many as half a dozen at a time at one location, “we don’t have the wherewithal or sites in this country to build six reactors at once,” Gadomski said. “You’re lucky to build two at one site in this country.”
So fusion and next-generation fission remain years away. Current-generation SMRs come with big questions. And the leading large-scale design, the AP1000, is proving a hard sell to utilities. That leaves two options: Restarting decommissioned plants and uprating current reactors. The Energy Department has pumped billions in loans into projects to restart at least three permanently closed reactors: Holtec’s Palisades plant in Michigan, NextEra’s Duane Arnold facility in Iowa, and Constellation’s Crane Clean Energy Center, née Three Mile Island, in Pennsylvania. The consensus among industry experts is that those are the only three that remain intact enough to start back up; every other shuttered plant is at too advanced a stage of demolition.
That leaves uprates.
There are limits to how much power can be drawn from existing plants, said Jeff Jenkins, the founder and managing partner of Bernhard Capital Partners, an investment firm whose portfolio includes Allied Power, a contractor that has worked with Constellation on past uprates. “There’s still a few gigawatts out there,” he said. “And a gigawatt is a lot.”
But ultimately, the U.S. nuclear buildout needs options.
“It’s very much a hedge,” Gadomski said. “They’re spreading their bets. That’s a strength of Google’s strategy. They’re willing to place bets on advanced reactors, fusion, and still try to double down on the capacity of existing plants.”







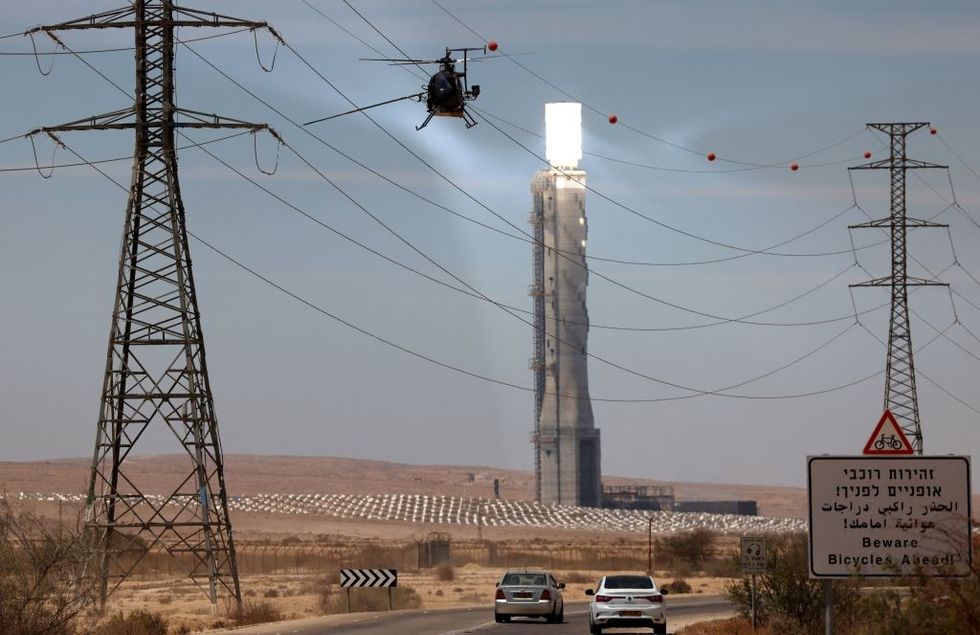 A crew cleans power lines at Israel’s Ashalim solar plant.EMMANUEL DUNAND/AFP via Getty Images