You’re out of free articles.
Log in
To continue reading, log in to your account.
Create a Free Account
To unlock more free articles, please create a free account.
Sign In or Create an Account.
By continuing, you agree to the Terms of Service and acknowledge our Privacy Policy
Welcome to Heatmap
Thank you for registering with Heatmap. Climate change is one of the greatest challenges of our lives, a force reshaping our economy, our politics, and our culture. We hope to be your trusted, friendly, and insightful guide to that transformation. Please enjoy your free articles. You can check your profile here .
subscribe to get Unlimited access
Offer for a Heatmap News Unlimited Access subscription; please note that your subscription will renew automatically unless you cancel prior to renewal. Cancellation takes effect at the end of your current billing period. We will let you know in advance of any price changes. Taxes may apply. Offer terms are subject to change.
Subscribe to get unlimited Access
Hey, you are out of free articles but you are only a few clicks away from full access. Subscribe below and take advantage of our introductory offer.
subscribe to get Unlimited access
Offer for a Heatmap News Unlimited Access subscription; please note that your subscription will renew automatically unless you cancel prior to renewal. Cancellation takes effect at the end of your current billing period. We will let you know in advance of any price changes. Taxes may apply. Offer terms are subject to change.
Create Your Account
Please Enter Your Password
Forgot your password?
Please enter the email address you use for your account so we can send you a link to reset your password:
What happens when you can’t run and you can’t hide?

You did everything right.
You had your go-bag ready and you knew your evacuation route. You monitored the wildfire as it moved closer and closer to your home, and you kept the volume turned up on your phone so you could heed a “LEAVE NOW” notice if one came. When it finally does, jolting you awake in the middle of the night, you realize that you can smell the smoke inside. When did the fire get so close?
The power is out, so you make your way downstairs using your phone’s flashlight. You have to Google how to manually open the garage door since the electronic clicker doesn’t work (oh, so that’s what the red cord is for). Your heart is thumping, but you’ve made it, you’re in your car; you even remembered to keep it filled to half a tank in preparation. You pull out of your driveway and onto the dirt road that leads out of your rural neighborhood. The night sky ahead of you is a weird neon orange.
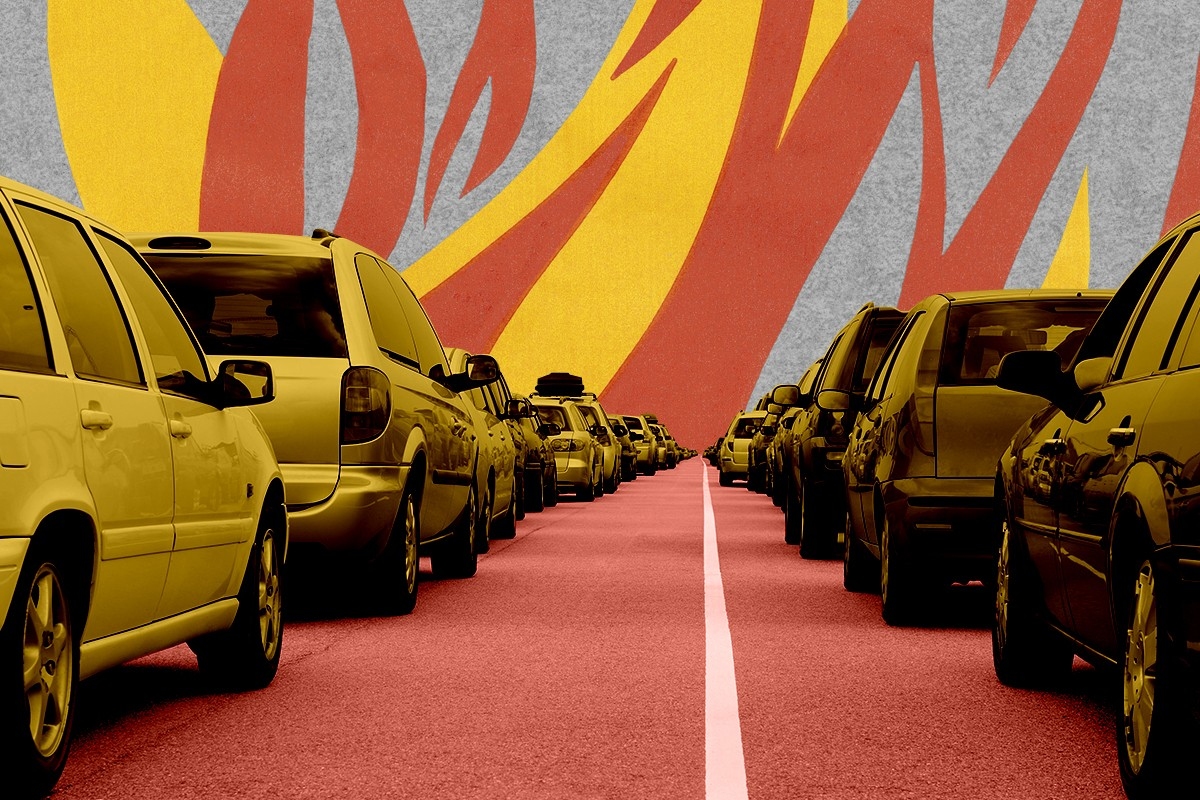
You have to hit your brakes when you reach the intersection at the main road. It’s completely backed up with other evacuees, their red taillights stretching ahead through the thickening smoke as far as your eye can see. Some of your neighbors are pulling their boats on trailers; there is an RV up ahead. And you can see the fire burning down the side of the hill now — toward you, toward the gridlocked traffic that isn’t moving.
Harrowing Fort McMurray wildfire escapeyoutu.be
Leaving your home is only the beginning of a wildfire evacuation. But the next step — the drive to a safe location — is usually given no more attention in preparedness guides than the reminder to “follow the directions of emergency officials.” In the best-case scenarios, where communication is clear and early and residents are prepared, that might be enough. But when communication breaks down, or fires move fast and unpredictably, traffic can reach a dangerous standstill and familiar roads can transform into death traps.
In 2015, some 20 vehicles were overcome by a fire while stuck in a traffic jam on Interstate 15 between Los Angeles and Las Vegas; on the same interstate in Utah five years later, a backup nearly became deadly as a fire burned up to the road’s shoulder and panicked travelers abandoned their cars. Fire evacuations in New South Wales, Australia, in 2020 resulted in a 10-hour backup, and Canada’s Highway 3 had bumper-to-bumper traffic earlier this month because it was the only road out of imperiled Yellowknife. In 2020, some 200 people had to be evacuated by helicopter from California’s Sierra National Forest after a fire cut off their only exit route.
And when people die in wildfires, they are often found in their vehicles. In Portugal, 47 of the 64 people killed during a 2017 forest fire were in their cars, trying to escape. At least 10 people were found dead in or near their cars after the 2018 Camp fire, the deadliest blaze in California’s history. And in Lahaina, Hawaii, this month, in what the Los Angeles Times has called “surely … the deadliest traffic jam in U.S. history,” the lack of advanced warning combined with inexplicably blocked roads led an untold number of people to perish in their cars while trying to evacuate, including a 7-year-old boy who was fleeing with his family; a man who used his last moments attempting to shield a beloved golden retriever in his hatchback; and a couple who were reportedly found in each other’s arms.
In a best-case scenario, emergency managers are able to phase evacuations in such a way that the roads don’t get backed up and residents have plenty of time to make it to safety. But wildfire is anything but predictable, and officials who call for an evacuation too soon can risk skeptical residents deciding to take a “wait and see” approach, where they only get in their car once things start to look dicey. In one 2017 study, only a quarter of people in wildfire-prone neighborhoods actually left as soon as they received an evacuation notice (other studies have found higher levels of compliance). This is the worst nightmare from an emergency management standpoint, since “evacuating at the last minute is probably the most dangerous thing you can do,” Sarah McCaffrey, one of the 2017 study’s authors, told The New Yorker.
Further complicating matters is the fact that many wildfire-prone areas are isolated or rural regions with a limited number of egresses to work with. One 2019 investigation found that in California alone, 350,000 people live in areas “that have both the highest wildfire risk designation, and either the same number or fewer exit routes per person as Paradise” — the site of the 2018 Camp fire, where backups on roads prevented many from escaping.
Evacuation traffic also doesn’t behave like the rush hour traffic we’re more familiar with. It’s “a peak of a peak,” with the congestion caused by “the sheer amount of people trying to leave and load onto the roadway at the same time in the same direction,” Stephen Wong, a wildfire evacuation researcher and an assistant professor of transportation engineering at the University of Alberta, told me. Burnovers and hazards like downed powerlines or trees can further reduce exit options, funneling all evacuees onto the same low-capacity roads. Worse, once that congestion starts to form, “you actually reduce the number of vehicles being able to go through that section,” Wong added. “So you go from 2,000 vehicles per hour [per lane], and it drops to, like, 500 vehicles per hour.”
Get one great climate story in your inbox every day:
Households will also frequently evacuate with multiple cars — rather than leave a valuable asset behind to burn — and tow trailers, boats, and RVs. As a result, the average vehicle length increases by 3% during wildfire evacuations, one recent study that looked at the 2019 Kincade fire in California found — leading, of course, to even worse congestion. (Agonizingly, Wong’s research further uncovered that over half of evacuating households “had at least two or more spare seats available”). The Kincade study also discovered that drivers significantly slow down during wildfire evacuations — contrary to the common misconception of careening, panicked escapees — likely due to a combination of factors such as lowered visibility and more cautious driving.
Because “most [evacuation] research focuses on hurricanes and then tornadoes,” Salman Ahmad, a traffic engineer at the civil engineering firm Fleis & VandenBrink, told me, “traffic simulations — how traffic moves during a wildfire — are still lacking.” When emergency planners use computer models to calculate minimum evacuation times for their jurisdictions, for example, their assumptions can be deadly. “If you plan for an allocation considering normal traffic as a benchmark, you’re basically not making the right assumption because you need to put in that extra safety margin” to account for “the fact that people slow down,” Enrico Ronchi, a fire researcher at Lund University in Sweden and the author of the Kincade study, told me.
Wong agreed, stressing that the number of variables fire managers need to juggle is dizzying. “Evacuations are really complex events that involve human behavior, risk perceptions, communication, emergency management, operations, the transportation system itself, psychology, the built environment, and biophysical fire,” Wong said. “So we have a long way to go for evidence-based and sufficient planning that can actually operationalize and prepare communities for these types of events.”
And that’s the scary thing: A person or a community might do everything right and still be at grave risk because of all the unknowns. Evacuation alerts might not get sent or arrive too late; exit routes might become unexpectedly blocked; fires might leapfrog, via flying embers, to create new spot fires that cut off egresses. Paradise, California, famously had a phased evacuation plan in place and had even run community wildfire drills, but even the best-laid plans can unravel.
Tom Cova, a geography professor at the University of Utah who has been studying wildfire evacuations for 30 years, told me that “too many communities may be planning for the roads to be open, the wireless emergency alert systems to work, there not to be tons of kids at home that day — you can just go down the list of things that [could go] wrong and think, What’s the backup plan?” The uncomfortable truth is that we need plans B, C, and D for when evacuations fail. Because they will fail.
Take Lahaina, where a closed bypass road concentrated outbound traffic onto a single, jam-packed street. When people started to panic and abandon their cars, it ultimately further obstructed the road for everyone behind them. “It’s like a chain reaction, where each car is seeing the [people in the] car in front of them run,” Cova said. “And then you look behind you, you can’t back up. If you look to the sides, you’re stuck. And then you say, ‘We’re going into the ocean, too.’”
That improvisation ultimately saved some lives. But “it’s hard for emergency managers to order this kind of thing because what if people drowned?” Cova went on. “So you’re trading one risk for another risk.”
But the need for creative improvisation is also a conclusion that’s been reached by the National Institute of Standards and Technology (NIST), the government agency tasked with issuing guidelines and regulations for engineers and emergency responders. In new guidance released last week, NIST used the Camp fire as its case study and found “evacuation is not a universal solution,” explaining there are times when “it may be better for residents to shelter in their community at a designated safety zone” rather than attempt to drive out of town.
This is a somewhat radical position for a U.S. agency since evacuations have long been the foundation of American wildfire preparations. But the thinking now appears to be turning toward asking “what shelters do we have?” if and when a worst-case scenario arises, as Cova further explained to me. “Temporary refuge areas, high schools, churches, large parking lots, large sports fields, golf courses, swimming pools — I wouldn’t recommend using any of these things, and I wouldn’t recommend people being told to use them,” he said, “but [people] have to know what to do when they can’t get out.”
In the case of Paradise, for example, NIST reports that there were 31 such “temporary refuge areas” that ultimately saved 1,200 lives during the fire, including 14 parking lots, seven roadways, six structures, and a handful of defensible natural areas, like a pre-established wildfire assembly area in a meadow that had already burned and ended up serving as a refuge for as many as 85 people. Once established, these concentrated refuge areas can be defended by firefighters, as was the case for 150 people who memorably hunkered down to wait out the blaze in a strip mall parking lot. It’s far from a best-case scenario, but that’s still 150 people who would’ve otherwise been stuck in potentially deadly traffic jams trying to get out of town.
Temporary refuges are unplanned areas of last resort, but establishing a larger safety zone network and preemptively hardening gathering places like schools and community centers could also potentially reduce exposure on roads by shortening the distance evacuees need to travel to get to lower-hazard areas. So-called WUI fire shelters — essentially, personal fire bunkers that NIST warns against because they aren’t standardized in the U.S. but are popular in Australia — could also be explored. “That’s the direction we’re heading in with wildfire communities,” Cova told me grimly, “because we don’t seem to be able to stop the development in these areas. That means we’re forcing people into a corner where shelter is their only backup plan.”
Maybe this is difficult for you to imagine: Your community is different; a wildfire couldn’t happen here. You’d evacuate as soon as you got the notice; there’s no way you’d get stuck. You’re a good driver; you could get out without help. But as Lahaina and other “unprecedented” fires show, it’s the limits of our lived experiences that we’re up against now.
“We should think about possible scenarios that we have not seen before in our communities,” Ronchi, the Swedish fire researcher, said. “I understand that it’s a bit of a challenge for everyone because often you have to invest money for something that you have not experienced directly. But we are [living] in scenarios now in which we cannot anchor ourselves on our past experiences only.”
Read more about wildfires:
Log in
To continue reading, log in to your account.
Create a Free Account
To unlock more free articles, please create a free account.
Building a data center is also quite carbon-intensive.
When I helped start Heatmap News three years ago, I didn’t think I would be writing this much about big tech companies.
I knew that, sure, they were crucial to America’s ability to develop and scale some next-generation emissions-reducing technologies. (By then, Microsoft had already started its huge carbon removal purchasing program.) And, yes, I knew they bought a lot of renewables. But I still understood their clean energy programs chiefly as an employee perk — a way for some of the economy’s richest firms to show their largely urban, college-educated, and liberal employees that they cared.
Perhaps that was true once. It’s not true anymore. Over the past several years, the tech companies have become major electricity consumers and producers in their own right. Artificial intelligence has turned their electricity procurement and development businesses into core operational competencies. (Meta and Microsoft have even considered entering the electricity trading business.) Some of the thorniest questions in climate policy were first encountered by these tech companies.
More importantly, their hunger for electricity has transformed them into quasi-industrial companies — and given them enough heft in the market to sometimes counterbalance (and sometimes collaborate with) the utilities and fossil fuel firms that previously steered the sector. As such, they’re now crucial parts of the U.S. decarbonization story.
Three companies in particular dominate the artificial intelligence cloud business: Google, Amazon, and Microsoft.
The country’s best-known frontier labs, such as OpenAI and Anthropic, rely on these companies to provide their compute power; Amazon Web Services is the backbone of virtually the entire online software industry. Amazon, Google, and Microsoft account for more than half of the country’s data center power capacity, according to the investment firm Jeffries.
So these companies’ emissions are, in a sense, not only their own; they also give us a view into the AI industry’s carbon footprint more broadly.
Over the past two weeks, all three of these cloud providers released their energy and emissions data for the past year, and we’ve looked at the top line findings from these reports in past editions. Today I want to briefly dive into what they could mean together.
Let’s handle the part you already know: Everyone’s emissions are up.
Microsoft’s emissions grew by 25% last year, their largest year-over-year leap since the pandemic. Amazon’s emissions leapt by 16%, its largest one-year increase ever. Google’s emissions increased by 18%, rising above their pre-pandemic level.
This surge will make the companies’ climate goals increasingly difficult to meet — and some of them are coming up fast. Microsoft has pledged to become ‘carbon negative’ by 2030, meaning it must remove more climate pollution from the atmosphere than it emits in that year. Google has pledged to achieve net zero by 2030, a goal that requires — by its own estimate — cutting its emissions in half by that year, as compared to their 2019 level. Amazon, meanwhile, has pledged to achieve net-zero in its operations by 2040.
All three firms’ greenhouse gas emissions are up because of the AI data center boom. Microsoft consumes nearly four times as much electricity as it did before the pandemic; Google’s electricity use has more than doubled.
These companies’ energy use has swelled, too, but at least as of last year, nearly all of their energy demand still took the form of electricity. When we think about “electrification” in the national context, perhaps we should think at least as much about these AI megalodons as we do about heat pump or battery manufacturers.
Amazon, to its shame, does not publish recent electricity usage data, so it doesn’t appear on either of these charts.
But outsiders have estimated its power consumption based on the numbers it does publish. Hendrik Rood, an IT researcher and consultant in the Netherlands, calculates that Amazon’s data center business used 78,000 gigawatt-hours in 2025. That would mean it consumes nearly as much electricity as Microsoft and Google combined.
As I cautioned yesterday, some of these figures are already outdated. Although all three companies just released their 2025 sustainability data, Microsoft brackets its report to the fiscal year, which ended on June 30, 2025. Google and Amazon’s data covers the calendar year.
In what might be a quirk inherent to the genre, all three sustainability reports have a somewhat defensive tone (or at least a writing style that tries to anticipate quibbles). These companies know that their sustainability pledges, embraced in the heady flush of 2020 and 2021, have become much more difficult to fulfill in the AI era. And they want you to know that all of their emissions could be worse — if not for their corporate policies, pollution might be much higher.
I can’t say I find these counterfactuals entirely believable. We don’t know what Google or Microsoft or Amazon would do if, say, computing were more energy intensive or a certain process more environmentally damaging. And Jevon’s paradox suggests that every gain in efficiency — especially for a service as in-demand as AI — will make it cheaper to use AI, therefore raising its energy demand.
But I do think it’s worth sharing these claims to get some perspective. Google, for its part, says that its corporate emissions would be five times higher than they are if not for its total slate of policies:

Microsoft takes a more clinical approach. It selects four of its corporate policies: “carbon-free electricity, sustainable fuels, XBOX console efficiency,” as well as efforts to decarbonize its Surface tablet production. If not for these interventions, it says, it would have emitted 34 million tons of greenhouse gas into the atmosphere last year, not the 21 million tons that it did produce.
For all the focus on the difficulty of powering data centers (including by Heatmap), electricity does not drive most of these companies’ emissions — or it didn’t in the first half of last year, at least. The majority of Microsoft, Google, and Amazon’s greenhouse gas emissions came from what are dubbed “scope 3” emissions, a somewhat nebulous category that includes buildings, employee travel, and the full carbon footprint of their supply chain. This category reflects the AI boom in its own way.
(Skip this if you’re a sustainability nerd: In the classic schema used for corporate emissions accounting, “scope 1” emissions are direct fossil fuel pollution from an asset that the company owns or controls, “scope 2” emissions are pollution associated with the electricity, steam, or chilled water purchased by the company, and “scope 3” emissions are everything else — pollution from the company’s upstream supply chain and its downstream product use. I find this scheme makes somewhat more sense for businesses like airlines and automakers than it does for technology conglomerates. But that’s a different newsletter.)
It makes sense, then, that Amazon should have huge scope 3 emissions. The scope 3 subcategory called “Purchased Goods and Services” drives the largest share of its emissions; these include pollution from goods and services that Amazon buys for its employees to use, as well as all the embodied carbon in its line of Amazon Basics products.
But the biggest driver of scope 3 emissions — and thus for emissions overall — for Microsoft and Google came from “capital goods,” a category that covers new construction, physical assets and other fixed infrastructure used to produce products and services. More than 40% of Microsoft’s total emissions came from capital goods, and they made up more than 9 million metric tons of the company’s greenhouse gases. Google doesn’t fully aggregate out its “capital goods” category, combining it with the “use of sold products” subcategory, but it was responsible for almost 9 million tons as well.
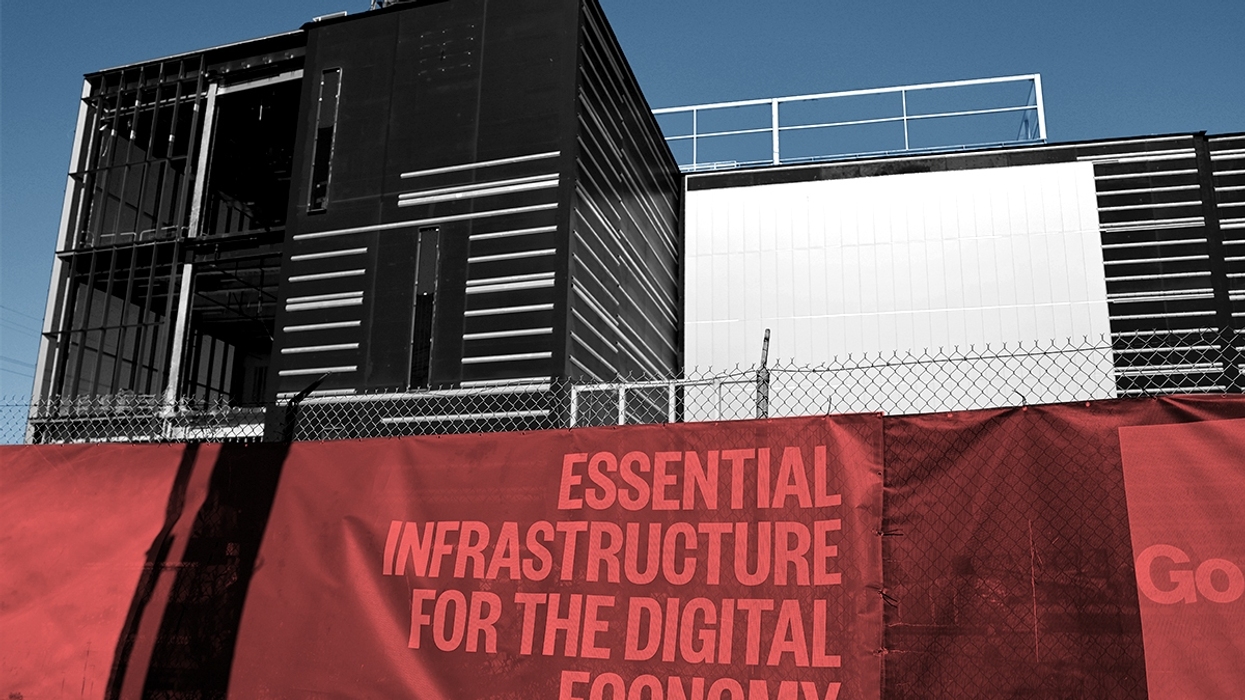
These capital goods include the new data centers themselves: all the cement, steel, server racks, and silicon that actually make up the physical infrastructure supporting the AI boom. Here at Heatmap, we often focus on the electricity sector because it’s where so much change. But it’s good to remember that construction remains enormously carbon-intensive, and the literal buildings that house AI are, in many cases, still driving a disproportionate amount of emissions.
The July 4 heat wave showed just how far the metropolis has to go to reach its decarbonization goals.
New York City’s decarbonization plan has stalled. The events of this year’s Fourth of July weekend all but prove it.
The temperature in the city reached as high as 100 degrees Fahrenheit on Thursday, July 2, the hottest it’s been here in 14 years. As New Yorkers blasted their air conditioners to stay cool, utilities drew on all of New York’s resources to serve the resulting electricity demand for cooling. These included a fleet of dual-fuel power plants, which can burn both oil and natural gas and encompasses many of its peakers, which turn on to deal with spikes of demand.
Those dual-fuel plants pushed over 10 gigawatts of electricity onto the grid on the evening of July 1— about a third of the total load in the state — and hit similar peaks on the 2nd and 3rd. The peaker fleet owned and operated by the New York Power Authority was operational for over two-thirds of the heat wave, which persisted for four consecutive days, while some ran nonstop from 7 a.m. July 2 to 3 a.m. July 4, according to NYPA.
In response to questions about the use of its peakers during the heat wave, a NYPA spokesperson told me, “During times of peak energy demand, like last week’s heat wave, the state’s independent grid operator called upon NYPA’s Small Natural Gas Power Plants to run well beyond their typical usage to meet high energy needs and prevent localized blackouts.”
While specific generator information is a protected trade secret, they said, “capacity suppliers are critical resources to meet system peak loads like those experienced during the recent heatwave.”
And yet still, over 100,000 people lost power during the heat wave. Real-time electricity prices in the area of the New York grid that includes the city got as high as $1,465 per megawatt-hour on the evening of July 3, according to data collected by Grid Status.
At the same time, the latest addition to New York’s non-carbon electricity generation fleet, a transmission line from Quebec that can transmit up to 1,250 megawatts known as the Champlain Hudson Power Express, was struggling. It experienced an unplanned outage on July 1, the first day of the heat wave, followed by a second outage beginning on July 4 that still had not been resolved as of Friday.
Since 2014, the city has had an aspirational goal of reducing emissions by 80% of its 2005 levels by 2050. CHPE was a major part of that plan, which also included offshore wind and utility-scale solar. There has been progress: Of the 1,000 megawatts of solar the city aims to have installed by 2030, about two thirds have been built. Even so, about 90% of New York City’s electricity came from fossil fuels in 2025, according to the city’s comptroller.
Why the difficulty decarbonizing? Blame a mixture of policy and geography. New York City is dense and has a lot of old buildings with old heating systems. Reducing consumption of fossil fuels requires getting cars off the road (congestion pricing) and retrofitting buildings with electric appliances (Local Law 97).
But that’s the demand side — the supply side is far trickier. Utility-scale non-carbon-emitting power on the orders of hundreds of megawatts or a gigawatt will have to be built elsewhere and piped in via transmission lines. That means offshore wind, solar (ideally with battery storage), and maybe one day nuclear power.
To the extent New York City can build solar and storage locally, it means dealing with a thicket of building regulations and local opposition. Efforts to shut down or replace peaker plants in the city have run into a brick wall at the New York Independent System Operator, which has declared that at least some peakers will have to stay online through the end of the decade to maintain system-wide reliability.
The only other new source of carbon-free power currently under construction is the offshore wind project Empire Wind, due to come online in 2027. NYISO said last year that without CHPE, Empire, and two local transmission projects planned to enter service by 2030, New York City would be “deficient in the summer” through 2030.
Of course developers have scrapped several other offshore wind projects over the years, whether due to problems procuring the right size turbine or the Trump administration buying out their lease. And though New York Governor Kathy Hochul pledged last summer to develop at least a gigawatt of new nuclear capacity in the northern region of the state, that is probably a decade away from fruition.
Meanwhile the Clean Path transmission line, which was meant to connect New York City to several gigawatts of new wind, solar and hydropower, saw its contracts canceled in late 2024 as its projected costs continued to rise. Last year, utility regulators shut down an effort by the state-run New York Power Authority to take it over as a “priority transmission project,” questioning whether it was “needed expeditiously” to meet downstate reliability needs and arguing that the project “will not be needed to serve substantial amounts of generation until well after 2033, and possibly not until 2040.”
While the city has some utility-scale battery storage systems, would-be developers have faced intense local opposition. Fullmark Energy, for instance, scrapped a planned 650-megawatt storage project after protests from political figures, including frequent mayoral candidate Curtis Sliwa. A dispute over another battery storage project in Queens has escalated into accusations of assault leveled by Councilmember Phil Wong, who called for a criminal investigation into what he said was an assault by a contractor for a project against his staffer.
So what’s left for New York City to do?
Any near-term progress will likely come from increasing efficiency and adding marginal generation capacity, as opposed to large-scale new projects and decommissioning of power plants.
“We need to max out our energy efficiency gains from Local Law 97,” former New York City Chief Climate Policy Advisor Daniel Zarelli told me, referring to a 2019 law mandating steep reductions in emissions from large buildings in the city, which came into effect two years ago. He also called for a further“push on batteries and behind the meter solar, clean energy, and energy efficiency.”
Already across the state, behind-the-meter solar is shaving off peak power demand. On the afternoon of July 2, behind-the-meter solar accounted served about 4.5 gigawatts to users, according to NYISO and Grid Status data.
Going forward, Zarelli said, the city should use its purchasing and planning power — as it did with CHPE — for projects like resurrecting Clean Path. “We need to be starting now. Maybe it’s not by 2030, but soon after we could be getting the benefit of that.”
“Battery developers started to see interconnection costs that were around 30 or 40 times what is standard,” Patrick Robbins, director of the Utility Customers Association told me. “It just means that new battery projects completely don’t pencil out and so we have a de facto moratorium on new [battery] projects.”
Advocates for solar and storage have blamed Con Edison for the city’s slow progress there, claiming that changes in the interconnection process have made it essentially cost prohibitive for battery storage developers to move forward on new projects.
Some of these fights have landed in front of New York’s Public Service Commission. In a filing, the city cited data from Con Edison showing that “the interconnection costs for some projects … have increased by thousands of percent,” citing one project whose interconnection costs jumped from $640,000 to over $35 million due to changes in how Con Edison attributed grid costs from new projects.
"Battery storage is essential to New York's clean energy future, and Con Edison strongly supports the development of energy storage when projects are deployed at the right locations, at the appropriate scale, and with operating parameters that provide the greatest benefit to customers and the electric grid,” a Con Edison spokesperson told me. “Because grid constraints vary across our system — from neighborhood‑level distribution lines to major transmission corridors — the location of a battery ultimately determines how much benefit it can deliver to the grid and to customers.”
There were 115 megawatts of battery storage operational in New York City at the end of last year, according to Con Edison, and 865 megawatts of projects with interconnection agreements. Peak load in the region is about 10,000 megawatts, meaning that these new projects would meaningfully alter the way the utility serves its customers.
Con Edison has claimed in a regulatory filing that the concentration of projects could lead to “significant impacts from BESS charging on infrastructure upstream of primary feeders,” necessitating the changes to its interconnection process. The city claimed in its filing that the added cost has “understandably chilled ongoing development activity at a time when New York City needs more supply resources capable of serving peak demand.”
When I reached out to the Mayor’s Office of Climate & Environmental Justice about the dispute, I received a statement in return from New York City Chief Climate Officer Louise Yeung: “Expanding battery storage capacity will be critical to New York City’s clean energy future, as extreme climate events continue to strain our grid system,” she said. “The City is working across agencies and communities to ensure battery energy storage projects are deployed safely and can provide reliable power when New Yorkers need it most.”
As for residential solar and storage, it will likely take years for those distributed resources to become a regular part of New York City’s energy landscape. There’s only one fully permitted and approved residential storage system allowed in New York City, which was installed earlier this year by Brooklyn Solar Works. Negotiating approvals with city agencies including the Department of Buildings and the New York City Fire Department took around six years, the company’s vice president of sales, Steve Nelson, told me.
“It’s New York City. We’re expecting there to be some level of bureaucracy and some lift to get that stuff approved,” Nelson said. “But what we also lack is a ready, readily accessible residential battery that meets the criteria that these departments have set.”
All that adds up to both a practical and a political gap for decarbonization, Zarelli told me.
“Batteries are a great way to connect the climate agenda and the affordability agenda, and it’s in the mayor’s control — it’s the regulatory apparatus at FDNY,” he said. “That’s a big near-term play that I think would make a big difference.”
Earlier this year, New York City Councilmember James Gennaro introduced a bill to amend the fire code to relax some battery storage permitting and safety requirements. But that still leaves the city’s decarbonization advocates with many big fish to fry.
“It’s a challenging future that’s still out in front of us, and how to navigate that is really difficult. But it’d be good if we were actually aligned on what our goals were as a society,” Zarelli said.
Rates were up 17% year over year in June, according to the latest Electricity Price Hub update, with another increase on the way.
With higher temperatures come higher electricity bills. Whether through higher seasonal charges or greater usage, Americans across the country were paying more for electricity in June.
In Virginia, the epicenter of the data center boom, the typical household electricity bill was $192 in June, up from $172 in June of last year, according to the latest data from the Heatmap and MIT’s Electricity Price Hub. Rates, meanwhile, were about 18 cents per kilowatt-hour, compared to just over 15 cents in June of last year, a 12% hike. Rates were also up from the end of last year, when they were about 15.5 cents.
The rate increase is largely due to prices set by Virginia’s largest utility, Dominion. Its rates are up 8% so far this year, according to MIT researchers, and 17% over the past 12 months, the result of a base rate increase that took effect at the beginning of the year. The average base rate alone is up 7.5% year over year for the average Dominion customer.
But that’s not all: The fuel portion of the bill is rising $8 a month for the typical customer, Dominion said according to local media reports, as a result of rising costs. The fuel charge went into effect at the beginning of July. Already, Dominion customers are paying about $78 per month for the generation portion of their electricity bill, according to Heatmap-MIT data.
The price hike will likely increase pressure on Dominion as it seeks to sell itself to Florida utility and energy developer NextEra in a $67 billion deal announced in May.
Earlier this week, Virginia's lieutenant governor Ghazala Hashmi sent a detailed letter to the State Corporation Commission, Virginia’s utility regulator, with 64 questions about the proposed merger. She said the deal “carries unprecedented implications for Virginia’s consumers and regulatory landscape.”
Hashmi asked regulators to extend their review of the deal beyond the six-month period mandated by its utility regulations, writing that “forcing this process into the six-month timeline will render an already inadequate period completely unworkable.”
In May, when the deal was announced, NextEra said it would provide over $2 billion of bill credits over two years to Dominion customers in Virginia, North Carolina, and South Carolina, which Dominion executives estimated would add up to $10 per month over the two years.