You’re out of free articles.
Log in
To continue reading, log in to your account.
Create a Free Account
To unlock more free articles, please create a free account.
Sign In or Create an Account.
By continuing, you agree to the Terms of Service and acknowledge our Privacy Policy
Welcome to Heatmap
Thank you for registering with Heatmap. Climate change is one of the greatest challenges of our lives, a force reshaping our economy, our politics, and our culture. We hope to be your trusted, friendly, and insightful guide to that transformation. Please enjoy your free articles. You can check your profile here .
subscribe to get Unlimited access
Offer for a Heatmap News Unlimited Access subscription; please note that your subscription will renew automatically unless you cancel prior to renewal. Cancellation takes effect at the end of your current billing period. We will let you know in advance of any price changes. Taxes may apply. Offer terms are subject to change.
Subscribe to get unlimited Access
Hey, you are out of free articles but you are only a few clicks away from full access. Subscribe below and take advantage of our introductory offer.
subscribe to get Unlimited access
Offer for a Heatmap News Unlimited Access subscription; please note that your subscription will renew automatically unless you cancel prior to renewal. Cancellation takes effect at the end of your current billing period. We will let you know in advance of any price changes. Taxes may apply. Offer terms are subject to change.
Create Your Account
Please Enter Your Password
Forgot your password?
Please enter the email address you use for your account so we can send you a link to reset your password:
As climate writers, my colleagues and I spend a lot of time telling readers that places are hot. The Arabian Peninsula? It’s hot. The Atlantic Ocean? It’s hot. The southern U.S. and northern Mexico? Hot and getting hotter.
But here’s a little secret: “Hot” doesn’t really mean … anything. The word is, of course, of critical importance when it comes to communicating that global temperatures are the highest they’ve been in 125,000 years because of greenhouse gases in the atmosphere, or for public health officials to anticipate and prevent deaths when the environment reaches the point where human bodies start malfunctioning. But when you hear it’s “100 degrees out,” what does that really tell you?
Beyond that you’re a fellow member of the Fahrenheit cult, the answer is: not a lot. Humans can “probably avoid overheating” in temperatures of 115 degrees — but only if they’re in a dry room with 10 percent relative humidity, wearing “minimal” clothing, and not moving, The New York Times reports. On the other hand, you have a high chance of life-threatening heat stroke when it’s a mere 90 degrees out … if the humidity is at 95%. Then there are all the variables in between: if there’s a breeze, if you’re pregnant, if you’re standing in the shade or the sun, if you’re a child, if you’re running a 10K or if you’re napping on your couch in front of a swamp cooler.
In order to better specify how hot “hot” is, a number of different equations and techniques have been developed around the world. In general, this math takes into account two main variables: temperature (the one we all use, also known as “dry bulb” or “ambient air temperature,” which is typically measured five feet above the ground in the shade) and relative humidity (the percentage of air saturated with water vapor, also known as the ugly cousin of the trendier dew point; notably Canada’s heat index equivalent, the Humidex, is calculated from the dew point rather than the relative humidity).
In events like the already deadly heat dome over the southern United States and northern Mexico this week, you typically hear oohing and ahhing about the “heat index,” which is sometimes also called the “apparent temperature,” “feels like temperature,” “humiture,” or, in AccuWeather-speak, the “RealFeel® temperature.”
But what does that mean and how is it calculated?
The heat index roughly approximates how hot it “actually feels.”
This is different than the given temperature on the thermometer because the amount of humidity in the air affects how efficiently sweat evaporates from our skin and in turn keeps us cool. The more humidity there is, the less efficiently our bodies can cool themselves, and the hotter we feel; in contrast, when the air is dry, it’s easier for our bodies to keep cool. Regrettably, this indeed means that insufferable Arizonans who say “it’s a dry heat!” have a point.
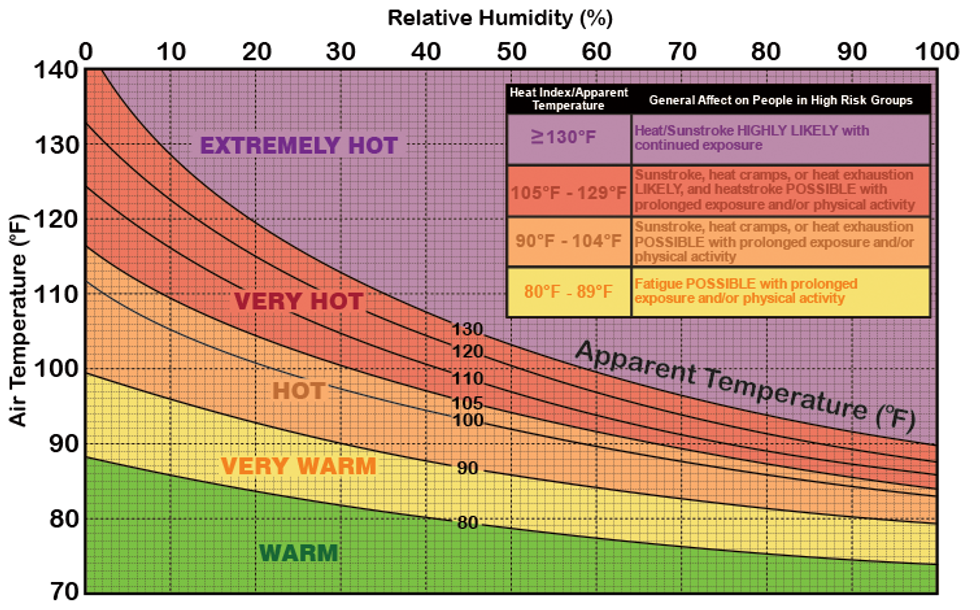
The heat index, then, tells you an estimate of the temperature it would have to be for your body to be similarly stressed in “normal” humidity conditions of around 20%. In New Orleans this week, for example, the temperature on the thermometer isn’t expected to be above 100°F, but because the humidity is so high, the heat toll on the body will be as if it were actually 115°F out in normal humidity.
Importantly, the heat index number is calculated as if you were standing in the shade. If you’re exposed to the sun at all, the “feels like” is, of course, actually higher — potentially as many as 15 degrees higher. Someone standing in the New Orleans sun this week might more realistically feel like they’re in 130-degree heat.
The heat index graph.NOAA
Here’s the catch, though: The heat index is “purely theoretical since the index can’t be measured and is highly subjective,” as meteorologist Chris Robbins explains. The calculations are all made under the assumption that you are a 5’7”, 147-pound healthy white man wearing short sleeves and pants, and walking in the shade at the speed of 3.1 mph while a 6-mph wind gently ruffles your hair.
Wait, what?
I’m glad you asked.
In 1979, a physicist named R. G. Steadman published a two-part paper delightfully titled “The Assessment of Sultriness.” In it, he observed that though many approaches to measuring “sultriness,” or the combined effects of temperature and humidity, can be taken, “it is best assessed in terms of its physiological effect on humans.” He then set out, with obsessive precision, to do so.
Steadman came up with a list of approximately 19 variables that contribute to the overall “feels like” temperature, including the surface area of an average human (who is assumed to be 1.7 meters tall and weigh 67 kilograms); their clothing cover (84%) and those clothes’ resistance to heat transfer (the shirt and pants are assumed to be 20% fiber and 80% air); the person’s core temperature (a healthy 98.6°F) and sweat rate (normal); the effective wind speed (5 knots); the person’s activity level (typical walking speed); and a whole lot more.
Here’s an example of what just one of those many equations looked like:
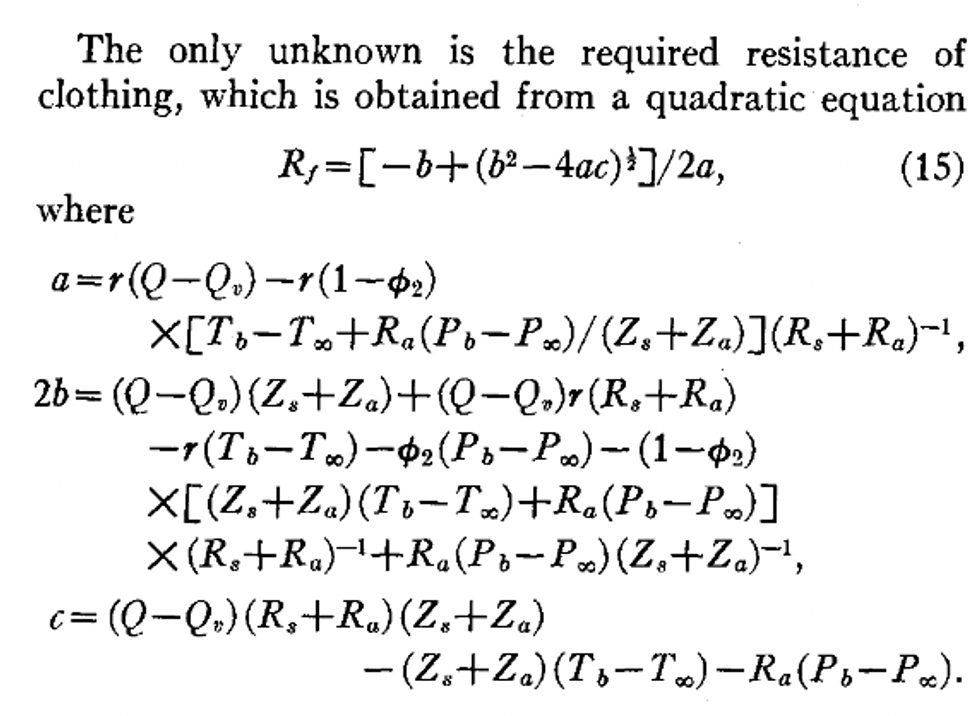
One of the many equations in “The Assessment of Sultriness: Part I,”R.G. Steadman
Needless to say, Steadman’s equations and tables weren’t exactly legible for a normal person — and additionally they made a whole lot of assumptions about who a “normal person” was — but Steadman was clearly onto something. Describing how humidity and temperature affected the human body was, at the very least, interesting and useful. How, then, to make it easier?
In 1990, the National Weather Service’s Lans P. Rothfusz used multiple regression analysis to simplify Steadman’s equations into a single handy formula while at the same time acknowledging that to do so required relying on assumptions about the kind of body that was experiencing the heat and the conditions surrounding him. Rothfusz, for example, used Steadman’s now-outdated calculations for the build of an average American man, who as of 2023 is 5’9” and weighs 198 pounds. This is important because, as math educator Stan Brown notes in a blog post, if you’re heavier than the 147 pounds assumed in the traditional heat index equation, then your “personal heat index” will technically be slightly hotter.
Rothfusz’s new equation looked like this:
Heat index = -42.379 + 2.04901523T + 10.14333127R - 0.22475541TR - 6.83783x10⁻³T 2 - 5.481717x10⁻²R 2 + 1.22874x10⁻³T 2R + 8.5282x10⁻⁴TR2 - 1.99x10⁻⁶T 2R 2
So much easier, right?
If your eyes didn’t totally glaze over, it actually sort of is — in the equation, T stands for the dry bulb temperature (in degrees Fahrenheit) and R stands for the relative humidity, and all you have to do is plug those puppies into the formula to get your heat index number. Or not: There are lots of online calculators that make doing this math as straightforward as just typing in the two numbers.
Because Rothfusz used multiple regression analysis, the heat index that is regularly cited by the government and media has a margin of error of +/- 1.3°F relative to a slightly more accurate, albeit hypothetical, heat index. Also of note: There are a bunch of different methods of calculating the heat index, but Rothfusz’s is the one used by the NWS and the basis for its extreme heat alerts. The AccuWeather “RealFeel,” meanwhile, has its own variables that it takes into account and that give it slightly different numbers.
Midday Wednesday in New Orleans, for example, when the ambient air temperature was 98°F, the relative humidity was 47%, and the heat index hovered around 108.9°F, AccuWeather recorded a RealFeel of 111°F and a RealFeel Shade of 104°F.
You might also be wondering at this point, as I did, that if Steadman at one time factored out all these variables individually, wouldn’t it be possible to write a simple computer program that is capable of personalizing the “feel like” temperature so they are closer to your own physical specifications? The answer is yes, although as Randy Au writes in his excellent Substack post on the heat index equation, no one has seemingly actually done this yet. Math nerds, your moment is now.
Because we’re Americans, it is important that we use the weirdest possible measurements at all times. This is probably why the heat index is commonly cited by our government, media, and meteorologists when communicating how hot it is outside.
But it gets weirder. Unlike the heat index, though, the “wet-bulb globe temperature” (sometimes abbreviated “WBGT”) is specifically designed to understand “heat-related stress on the human body at work (or play) in direct sunlight,” NWS explains. In a sense, the wet-bulb globe temperature measures what we experience after we’ve been cooled by sweat.
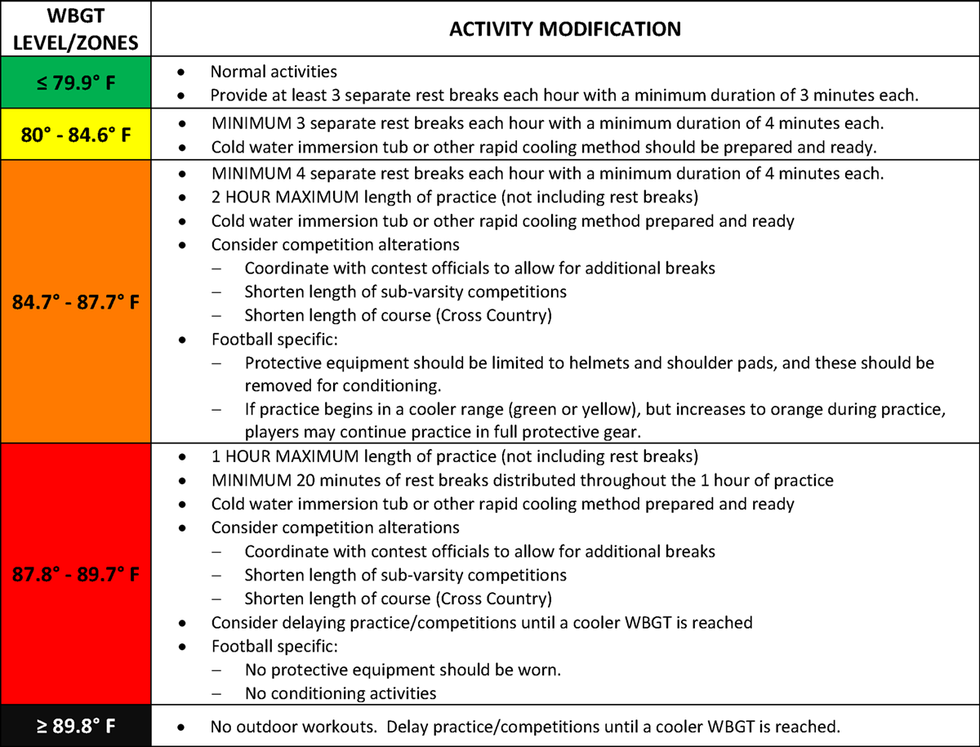
The Kansas State High School Activities Association thresholds for wet-bulb globe temperature.Weather.gov
The “bulb” we’re referring to here is the end of a mercury thermometer (not to be confused with a lightbulb or juvenile tulip). Natural wet-bulb temperature (which is slightly different from the WBGT, as I’ll explain in a moment) is measured by wrapping the bottom of a thermometer in a wet cloth and passing air over it. When the air is dry, it is by definition less saturated with water and therefore has more capacity for moisture. That means that under dry conditions, more water from the cloth around the bulb evaporates, which pulls more heat away from the bulb, dropping the temperature. This is the same reason why you feel cold when you get out of a shower or swimming pool. The drier the air, the colder the reading on the wet-bulb thermometer will be compared to the actual air temperature.
Wet bulb temperature - why & when is it used?www.youtube.com
If the air is humid, however, less water is able to evaporate from the wet cloth. When the relative humidity is at 100% — that is, the air is fully saturated with water — then the wet-bulb temperature and the normal dry-bulb temperature will be the same.
Because of this, the wet-bulb temperature is usually lower than the relative air temperature, which makes it a bit confusing when presented without context (a comfortable wet-bulb temperature at rest is around 70°F). Wet-bulb temperatures over just 80, though, can be very dangerous, especially for active people.
The WBGT is, like the heat index, an apparent temperature, or “feels like,” calculation; generally when you see wet-bulb temperatures being referred to, it is actually the WBGT that is being discussed. This is also the measurement that is preferred by the military, athletic organizations, road-race organizers, and the Occupational Safety and Health Administration because it helps you understand how, well, survivable the weather is, especially if you are moving.
Our bodies regulate temperature by sweating to shed heat, but sweat stops working “once the wet-bulb temperature passes 95°F,” explains Popular Science. “That’s because, in order to maintain a normal internal temperature, your skin has to stay at 95°F degrees or below.” Exposure to wet-bulb temperatures over 95°F can be fatal within just six hours. On Wednesday, when I was doing my readings of New Orleans, the wet-bulb temperature was around 88.5°F.
The WBGT is helpful because it takes the natural wet-bulb temperature reading a step further by factoring in considerations not only of temperature and humidity, but also wind speed, sun angle, and solar radiation (basically cloud cover). Calculating the WBGT involves taking a weighted average of the ambient, wet-bulb, and globe temperature readings, which together cover all these variables.
That formula looks like:
Wet-bulb globe temperature = 0.7Tw + 0.2Tg + 0.1Td
Tw is the natural wet-bulb temperature, Tg is the globe thermometer temperature (which measures solar radiation), and Td is the dry bulb temperature. By taking into account the sun angle, cloud cover, and wind, the WBGT gives a more nuanced read of how it feels to be a body outside — but without getting into the weeds with 19 different difficult-to-calculate variables like, ahem, someone we won’t further call out here.
Thankfully, there’s a calculator for the WBGT formula, although don’t bother entering all the info if you don’t have to — the NWS reports it nationally, too.
Log in
To continue reading, log in to your account.
Create a Free Account
To unlock more free articles, please create a free account.
On presidential proclamations, Pentagon pollution, and cancelled transmission
Current conditions: Over 1,000 people have evacuated the region of Seosan in South Korea following its heaviest rainfall since 1904 • Forecasts now point toward the “surprising return” of La Niña this fall • More than 30 million people from Louisiana through the Appalachians are at risk of flash flooding this weekend due to an incoming tropical rainstorm.
The Hugh L. Spurlock Generating Station in Maysville, Kentucky.Jeff Swensen/Getty Images
President Trump on Thursday signed four proclamations allowing certain highly polluting industries to bypass regulations established by the Biden administration. In addition to chemical manufacturers that help produce semiconductors and medical device sterilizers, the proclamations singled out coal-fired power plants and taconite iron ore processing facilities for two years of exemptions. Taconite is a low-grade iron ore primarily mined in the Upper Peninsula of Michigan and northern Minnesota, which is then processed for use in the production of iron and steel. Trump justified the move by arguing that compliance with the current emissions rule for coal-fired power plants raises the “unacceptable risk” of shutdowns, “eliminating thousands of jobs, placing our electrical grid at risk, and threatening broader, harmful economic and energy security effects,” while the iron processing emissions rule “risks forcing shutdowns, reducing domestic production, and undermining the nation’s ability to supply steel for defense, energy, and critical manufacturing.”
The proclamations allow industries to comply with the Environmental Protection Agency standards that predate former President Joe Biden’s tenure. Trump justified the pause by claiming the former administration had mandated compliance with “standards that rely on emissions-control technologies that have not been demonstrated to work.” Researchers have previously found that air pollutants related to coal power plants cause nearly 3,000 attributable deaths per year. Taconite iron ore processing facilities produce harmful acid gases, including hydrogen chloride and hydrogen fluoride, as well as mercury, which have been linked to numerous adverse health effects.
Separately, the House passed Trump’s $9 billion rescissions package late last night, which includes cuts to international climate, energy, and environmental programs like the Clean Technology Fund. Republicans Brian Fitzpatrick of Pennsylvania and Mike Turner of Ohio joined Democrats in objecting to the bill. Trump is expected to sign the package Friday. An additional rescissions package is expected “soon.”
The Pentagon’s 2026 budget will enable the Department of Defense’s planet-warming emissions to grow by an additional 26 megatons, or about the equivalent of 68 gas power plants, a new analysis by the Climate and Community Institute found. The U.S. military was already the single largest institutional polluter in the world due to its “vast global operations — from jet fuel consumption and overseas deployments to domestic base maintenance,” as well as its manufacturing of weapons and vehicles, the think tank notes. With the passage of the One Big Beautiful Bill Act, the Pentagon’s budget will exceed $1 trillion in 2026, representing a 17% increase over 2024. Its emissions, in turn, could grow to the point that if the DOD were its own country, it’d be the 38th largest polluter in the world, producing more CO2 emissions than the Netherlands, Bangladesh, or Venezuela. But “the Pentagon’s true climate impact will almost certainly be worse” than what the researchers found, The Guardian notes, “as the calculation does not include emissions generated from future supplemental funding such as the billions of dollars appropriated separately for military equipment for Israel and Ukraine in recent years.”
Get Heatmap AM directly in your inbox every morning:
New York’s Public Service Commission decided Thursday against moving forward with a major transmission project that would have had the capacity to deliver at least 4,770 megawatts of offshore wind power to New York City by the early 2030s. The commissioners said they were unable to justify “charging ratepayers for the multibillion-dollar project when feds are stymying” offshore wind, New York Focus’ Colin Kinniburgh reported on Bluesky. “We will continue to press forward regarding infrastructure needs for offshore wind in the future once the federal government resumes leasing and permitting for wind energy generation projects,” PSC chair Rory Christian said.
The canceled Public Policy Transmission Need determination was not specific to a particular offshore wind project, but rather was intended to match New York’s general offshore wind ambitions when it was approved in 2023. But as Heatmap has previously reported, Trump’s crusade against offshore wind has been a “worst case scenario” for the industry since day one, and, per ABC News 10, effectively “eliminates any reason for building new power lines in the first place.”
Microsoft has inked a deal to purchase 4.9 million metric tons of durable carbon dioxide removal from Vaulted Deep, a waste management startup, for an undisclosed amount. The companies boasted that the deal, which runs through 2038, represents “the second-largest carbon removal deal to date.” Vaulted Deep, an Xprize Carbon runner-up, diverts organic waste from landfills and incinerators by injecting it into wells thousands of feet underground using fracking technologies, which it says ensures over 1,000 years of durability, TechCrunch reports. Since Vaulted’s launch in the summer of 2023, the Houston-based company has removed 18,000 metric tons of carbon dioxide. Microsoft, meanwhile, has slipped behind its 2020 goal to remove more carbon from the atmosphere than it generates by the end of the decade due to its rush to build out data centers.
The Environmental Protection Agency’s reorganization and downsizing are set to continue, with the agency offering another round of buyouts and early retirements to staffers in offices it aims to restructure, Politico reports. Among the affected offices are the Office of Enforcement and Compliance Assurance, which the EPA said it seeks to tweak to “better address pollution problems that impact American communities by re-aligning enforcement with the law to deliver economic prosperity and ensure compliance with agency regulations,” as well as the Office of Land and Emergency Management, which works on Superfund and disaster response issues. The Office of Research and Development, the Office of Mission Support, and the Office of the Chief Financial Officer are also affected.
Separately, in a preliminary decision earlier this week, the agency moved to block the state of Colorado from closing its six remaining coal-fired power plants by 2031. Colorado was attempting to codify the retirement dates in its Regional Haze Plan, which is typically used to protect the air quality of federal wilderness and national parks; however, the EPA rejected the proposal, according to CPR News. “We believe that the Clean Air Act does not give anybody the authority to shut down coal generation plants against the owner’s will,” Cyrus Western, the administrator of EPA Region 8, said. Jeremy Nichols, a senior advocate for the Center of Biological Diversity’s environmental health program, claimed the EPA’s move shows the limits of what climate-conscious states can do on their own. “We may have state rules, but they won't be federally approved,” Nichols told CPR.
“There are so many developers and so many projects in so many places of the world that there are examples where either something goes wrong with a project or a developer doesn’t follow best practices. I think those have a lot more staying power in the public perception of renewable energy than the many successful projects that go without a hiccup and don’t bother people.” —Heatmap Pro’s Charlie Clynes, in conversation with Jael Holzman about his new project tracking all of the nation’s county-level restrictions on renewable energy.
New York City may very well be the epicenter of this particular fight.
It’s official: the Moss Landing battery fire has galvanized a gigantic pipeline of opposition to energy storage systems across the country.
As I’ve chronicled extensively throughout this year, Moss Landing was a technological outlier that used outdated battery technology. But the January incident played into existing fears and anxieties across the U.S. about the dangers of large battery fires generally, latent from years of e-scooters and cellphones ablaze from faulty lithium-ion tech. Concerned residents fighting projects in their backyards have successfully seized upon the fact that there’s no known way to quickly extinguish big fires at energy storage sites, and are winning particularly in wildfire-prone areas.
How successful was Moss Landing at enlivening opponents of energy storage? Since the California disaster six months ago, more than 6 gigawatts of BESS has received opposition from activists explicitly tying their campaigns to the incident, Heatmap Pro® researcher Charlie Clynes told me in an interview earlier this month.
Matt Eisenson of Columbia University’s Sabin Center for Climate Law agreed that there’s been a spike in opposition, telling me that we are currently seeing “more instances of opposition to battery storage than we have in past years.” And while Eisenson said he couldn’t speak to the impacts of the fire specifically on that rise, he acknowledged that the disaster set “a harmful precedent” at the same time “battery storage is becoming much more present.”
“The type of fire that occurred there is unlikely to occur with modern technology, but the Moss Landing example [now] tends to come up across the country,” Eisenson said.
Some of the fresh opposition is in rural agricultural communities such as Grundy County, Illinois, which just banned energy storage systems indefinitely “until the science is settled.” But the most crucial place to watch seems to be New York City, for two reasons: One, it’s where a lot of energy storage is being developed all at once; and two, it has a hyper-saturated media market where criticism can receive more national media attention than it would in other parts of the country.
Someone who’s felt this pressure firsthand is Nick Lombardi, senior vice president of project development for battery storage company NineDot Energy. NineDot and other battery storage developers had spent years laying the groundwork in New York City to build out the energy storage necessary for the city to meet its net-zero climate goals. More recently they’ve faced crowds of protestors against a battery storage facility in Queens, and in Staten Island endured hecklers at public meetings.
“We’ve been developing projects in New York City for a few years now, and for a long time we didn’t run into opposition to our projects or really any sort of meaningful negative coverage in the press. All of that really changed about six months ago,” Lombardi said.
The battery storage developer insists that opposition to the technology is not popular and represents a fringe group. Lombardi told me that the company has more than 50 battery storage sites in development across New York City, and only faced “durable opposition” at “three or four sites.” The company also told me it has yet to receive the kind of email complaint flood that would demonstrate widespread opposition.
This is visible in the politicians who’ve picked up the anti-BESS mantle: GOP mayoral candidate Curtis Sliwa’s become a champion for the cause, but mayor Eric Adams’ “City of Yes” campaign itself would provide for the construction of these facilities. (While Democratic mayoral nominee Zohran Mamdani has not focused on BESS, it’s quite unlikely the climate hawkish democratic socialist would try to derail these projects.)
Lombardi told me he now views Moss Landing as a “catalyst” for opposition in the NYC metro area. “Suddenly there’s national headlines about what’s happening,” he told me. “There were incidents in the past that were in the news, but Moss Landing was headline news for a while, and that combined with the fact people knew it was happening in their city combined to create a new level of awareness.”
He added that six months after the blaze, it feels like developers in the city have a better handle on the situation. “We’ve spent a lot of time in reaction to that to make sure we’re organized and making sure we’re in contact with elected officials, community officials, [and] coordinated with utilities,” Lombardi said.
And more on the biggest conflicts around renewable energy projects in Kentucky, Ohio, and Maryland.
1. St. Croix County, Wisconsin - Solar opponents in this county see themselves as the front line in the fight over Trump’s “Big Beautiful” law and its repeal of Inflation Reduction Act tax credits.
2. Barren County, Kentucky - How much wood could a Wood Duck solar farm chuck if it didn’t get approved in the first place? We may be about to find out.
3. Iberia Parish, Louisiana - Another potential proxy battle over IRA tax credits is going down in Louisiana, where residents are calling to extend a solar moratorium that is about to expire so projects can’t start construction.
4. Baltimore County, Maryland – The fight over a transmission line in Maryland could have lasting impacts for renewable energy across the country.
5. Worcester County, Maryland – Elsewhere in Maryland, the MarWin offshore wind project appears to have landed in the crosshairs of Trump’s Environmental Protection Agency.
6. Clark County, Ohio - Consider me wishing Invenergy good luck getting a new solar farm permitted in Ohio.
7. Searcy County, Arkansas - An anti-wind state legislator has gone and posted a slide deck that RWE provided to county officials, ginning up fresh uproar against potential wind development.