Maybe you’re reading this in a downpour. Perhaps you’re reading it because you have questions about the
upcoming hurricane season. Or maybe you’re reading it because you’re one of the 150 million Americans enduring record-breaking temperatures in this week’s heat dome.
Whatever the reason, you have a question:
Is this climate change?
There’s an old maxim — that, like many things, is often dubiously attributed to Mark Twain — that goes something like, “Climate is what you expect and weather is what you get.” Weather refers to the event itself, while climate refers to the trends (averaged over 30 years or more,
usually) that might make such an event more or less likely.
Climate change is almost always an exacerbating factor in the case of something like a heat wave or a heat dome. In other situations, the picture is far more complicated and uncertain. It can take years to understand if and how climate change made an extreme weather event more likely, and while organizations like
World Weather Attribution work hard to provide quick and accurate estimations, getting the science wrong can fuel climate skepticism and bolster deniers’ arguments. While it might be tempting to pin all extreme weather on climate change, the truth is, not all of it is.
Still, we do know a lot about how climate change influences the weather — and we’re always learning more. While this guide is far from the be-all and end-all of attribution and should be referred to with caveats, here is what we know about how climate change is shaping the extreme weather we see today.
The Big Four
Heat waves and heat domes
“When you’re looking at heat extremes, there is almost always a climate change signal,” Clair Barnes, a research associate with World Weather Attribution, told me. “I don’t think there’s ever
not been a climate change signal since I’ve been doing it in the last couple of years.”
As the planet warms, local temperatures respond everywhere. There are not as many complicating variables in this relationship as there are with something like
drought. “With heat waves, it’s the same answer every time: It got hotter because it’s got hotter,” Barnes said.
The Intergovernmental Panel on Climate Change
has found that the kind of heat waves that would have occurred once in a decade before the Industrial Revolution now occur almost three times more frequently and are 1.2 degrees Celsius (or 2.2 degrees Fahrenheit) warmer. The most extreme examples — like the 2021 heat dome over the Pacific Northwest — appear to have been possible only because of warming caused by greenhouse gas emissions. Additionally, about 37% of global heat-related deaths, which amount to tens of thousands of deaths per year, are attributable to climate change.
There have, of course, always been heat waves. But it is with high confidence that scientists say
they are hotter and last longer now than they would otherwise because of climate change.
Did climate change do it? It is “virtually certain” that heat waves are more frequent and hotter than they otherwise would be because of climate change.
Wildfires
WWA doesn’t specifically study wildfires since they aren’t technically “weather” (though once they form,
they can make their own). Instead, the organization studies the conditions that make a fire more likely. In the American West, this deadly combo usually involves high pressure, extremely dry air, and some wind.
Globally, burned areas decreased between 1998 and 2015, but that isn’t because fire-weather conditions are improving — rather, regional leaders have gotten better at things like land use and fire management. Fire
weather, meanwhile, is increasing and lasting longer due to climate change. In particular, hotter temperatures — especially hotter overnight temperatures — make it more difficult to combat the fires that do ignite. (Most fires in the U.S. start due to human negligence or arson, rather than by natural causes such as lightning strikes.)
This is especially the case in California, where 10 of the state’s largest fires have occurred in the past two decades, with five in 2020 alone; a 2023 National Integrated Drought Information System-funded study further found
a 320% increase in burned areas in the state between 1996 and 2021 due to contributions of human-caused climate change, with that number expected to grow in the coming decades.
On average, wildfire weather season lengthened
by two weeks around the globe from 1979 to 2019. The IPCC has medium confidence in the claim that fire weather has become more probable in the U.S., Europe, Australia, and parts of Europe over the past century, and high confidence that fire weather will increase regionally due to global warming in the coming years.
Did climate change do it? Climate change has almost certainly exacerbated the heat, humidity, and drought conditions necessary for wildfires to start. The actual ignition of the fire is frequently human-caused, however, and complicating variables such as local vegetation, forest management, and land use can also muddle the picture.
Hurricanes and tropical storms
Tropical cyclones are large and complicated storm systems.
Ocean temperatures, the El Niño-Southern Oscillation, wind shear, barometric pressure, atmospheric moisture, the shape of the continental shelf, emergency preparedness measures, and pure luck all affect how destructive a given storm might be — when or if it makes landfall. Climate change can put a thumb on the scale, but it is far from a lone actor.
Hurricanes — the strongest
manifestation of a tropical cyclone — essentially work by transferring heat from the ocean into wind energy. Because the ocean absorbs excess heat from the warming atmosphere, scientists expect to see more “major” hurricanes of Category 3 or above in the coming years.
The storms aren’t just getting more powerful, though. Because of the interaction between ocean heat and energy in a hurricane, the storms also intensify more rapidly and are “more than twice as likely to strengthen from a weak Category 1 hurricane to a major Category 3 or stronger hurricane in a 24-hour period than they were between 1970 and 1990,” according to
new research published last year.
WWA says it cannot attribute the intensification of any
individual storm to climate change due to relatively limited modeling so far, so the organization instead looks at how climate change may have amplified associated rainfall and storm surges. Rainfall and flooding are, in fact, more deadly than high wind speeds in hurricanes, and both are understood to be increasing because of climate change. Put simply, a warmer atmosphere can hold more water, which means worse deluges. Researchers linked extreme rainfall during Hurricanes Katrina, Maria, and Irma to climate change; Hurricane Harvey, which flooded up to 50% of the properties in Harris County, Texas, when it made landfall in 2017, had a rainfall total 15% to 38% greater than it would have been in a pre-industrial world, researchers found. Additionally, rising sea levels caused by climate change will worsen coastal flooding during such events.
However, “trends indicate no significant change in the frequency of tropical cyclones globally,” according to the IPCC. That is, there aren’t
more hurricanes; the ones that form are just more likely to become major hurricanes. Scientists understand far less about what climate change means for the smaller Category 1 or 2 storms, or if it will impact the diameter of the storms that do form.
Did climate change do it? The greenhouse effect is making the atmosphere warmer, and in a warmer climate, we’d expect to see more major hurricanes of Category 3 and above. Evidence also points to hurricanes intensifying much more rapidly in today’s climate than in the past. Climate does not seem to play a role in the overall number of storms, though, and other critical factors like the path of a storm and the emergency preparedness of a given community have a significant impact on the potential loss of life but aren’t linked to a warmer atmosphere. Hurricanes are complicated events and there is still much more research to be done in understanding how exactly they’re impacted by climate change.
Extreme rain, floods, and landslides
In the winter, your skin might feel dry, and your lips might chap; in the summer, many parts of the country feel sticky and swampy. This is simple, observable physics: Cold air holds less moisture, and warm air holds more. The “Clausius-Clapeyron” relation, as it is known, tells us that in 1 degree C warmer air, there is 7% more moisture. All that moisture has to go somewhere, so quite literally, when it rains, it pours. (That is, when and
where it rains: WWA notes that “an attribution study in northern Europe found that human influence has so far had little effect on the atmospheric circulation that caused a severe rainfall event.”)
Like heat, the relationship between warm air and rainfall is well understood, which is why the IPCC is highly confident in the attributable influence of climate change on extreme rain. While it
may seem confusing that both droughts and intense rainfall are symptoms of climate change, the warming atmosphere seems to increase precipitation variability, making events on the extreme margins more likely and more frequent.
Increased precipitation can have counterintuitive results, though. Rain occurring over fewer overall days due to bursts of extreme rainfall, for example, can actually
worsen droughts. And while it might seem like more water in the atmosphere would mean snowier winters, that’s only true in certain places. Because it’s also warmer, snowfall is declining globally while winters are getting wetter — and as a result, probably more miserable.
But what does “more rain” really mean? Rain on its own isn’t necessarily bad, but when it
overwhelms urban infrastructure or threatens roads and houses, it can quickly become deadly. Flooding, of course, is often the result of extreme rain, but “the signal in the rainfall is not necessarily correlated to the magnitude of the floods because there are other factors that turn rain into a flood,” Barnes, the research associate with WWA, told me, citing variables such as land use, water management, urban drainage, and other physical elements of a landscape.
Landslides, likewise, are caused by everything from volcanic eruptions to human construction, but rain is often a factor (climate-linked phenomena like
wildfires and thawing permafrost also contribute to landslides). The IPCC writes with “high confidence” that landslides, along with floods and water availability, “have the potential to lead to severe consequences for people, infrastructure, and the economy in most mountain regions.”
Did climate change do it? More extreme rainfall is consistent with our understanding of climate change’s effects. Many other local, physical factors can compound or mitigate disasters like floods and mudslides, however.
The Oddballs
Drought
When I spoke with Barnes, of WWA, she told me, “It’s really easy to define a heat wave. You just go, ‘It was hot.’” Droughts, not so much. For one thing, you have to define the time span you’re looking at. There are also different kinds of drought: meteorological, when there hasn’t been enough rain; hydrological, when rivers are low possibly because something else is diverting water from the natural cycle; and agricultural, when there is not enough water specifically for crops. Like flooding, many different infrastructural and physical factors go into exacerbating or even creating various kinds of droughts.
Drought as we mean it here, though, is a question of soil moisture, Barnes told me. “That’s really hard to get data on,” she said, “and we don’t necessarily understand the feedback mechanisms affecting that as well as we understand heat waves.” As recently as 2013, the IPCC
had only low confidence that trends in drought could be attributed to climate change.
We have a better understanding of how drought and climate change interact now, including how higher temperatures drive evaporation and cut into snowpack, leading to less meltwater in rivers. The IPCC’s most recent report concluded that “even relatively small incremental increases in global warming (+0.5C) cause a worsening of droughts in some regions.” The IPCC also has high confidence that “more regions are affected by increases in agricultural and ecological droughts with increasing global warming.”
WWA’s attribution studies have, however, found examples of droughts that have
no connection to climate change. The organization flags that it has the highest confidence in the climate affecting droughts in the Mediterranean, southern Africa, central and eastern Asia, southern Australia, and western North America and lower confidence in central and west Africa, western and central Europe, northeast South America, and New Zealand.
Did climate change do it? Maybe. Some droughts have a strong climate signal — California’s, for example. Still, researchers remain cautious about attribution for these complicated events due in part to their significant regional variability.
Tornadoes
Tornadoes are extremely difficult to study. Compared to droughts, which can last years, tornadoes occupy a teeny tiny area and last for just a blip in time. They “wouldn’t even register” on the models WWA uses for its attribution studies, Barnes said. “It would probably look like a slightly raised average wind speed.” The IPCC,
for its part, has only “low confidence” in a connection between climate change and “severe convective storms” like tornadoes, in part due to the “short length of high-quality data records.”
But we are learning more every day. This spring, researchers posited that
Tornado Alley is moving east and “away from the warm season, especially the summer, and toward the cold season.” Though it’s not entirely clear why this is happening, one theory is that it relates to how climate change is affecting regional seasonality: winters and nights are becoming warmer in certain areas, and thus more conducive to tornado formation, while others are becoming too hot for storms to form during the normal season.
Did climate change do it? Researchers aren’t entirely sure but there doesn’t appear to be a correlation between tornado formation and climate change. Still, warmer temperatures potentially make certain areas more or less prone to tornadoes than they were in the past.
Thunderstorms and hail
We say “it was a dark and stormy night” because “it was a severe convective storm” doesn’t have the same ring. But an SCS — which forms when warm, moist air rises into colder air — is the most common and most damaging weather phenomenon in the United States. You probably just call it a thunderstorm.
Severe convective storms cause many localized events that we think of as “weather,” including heavy rainfall, high winds, tornadoes, hail, thunder, and lightning. Because heat and moisture are necessary ingredients for these kinds of storms, and because the atmosphere is getting both warmer and wetter, climate models “consistently” and confidently predict an “increase in the frequency of severe thunderstorms,” the IPCC notes — but, “there is low confidence in the details of the projected increase.” Trends remain poorly studied and highly regionally dependent; in the United States, for example, there is still no evidence of a “significant increase in convective storms, and hail and severe thunderstorms.” Still, other research suggests that for every 1.8 degree F of warming, the conditions favorable to severe convective storms will increase in frequency by up to 20%.
Hail forms during severe convective storms when the hot, moist air rises to a region of the atmosphere where it is cold enough to freeze. Like thunderstorms more generally, data is fairly limited on hail, making it difficult to study long-term trends (most climate models also do not look directly at hail, studying convective storms more broadly instead). However, it’s been hypothesized that climate change could create larger and more destructive hail in the future; if thunderstorm updrafts grow stronger, as projected, then they could hold hail at freezing high altitudes for longer, allowing individual hailstones to grow larger before falling back to Earth. One study even suggested that with continued warming, there could be a 145% increase in “significant severe hail” measuring at least 2 inches in diameter — that is, a little smaller than a tennis ball.
Did climate change do it? Everything we know about thunderstorms suggests that a warmer, wetter atmosphere will mean severe convection storms become both more frequent and more intense. But there is still very little available data to track the long-term trends, so attributing any one storm to climate change would be nearly impossible.
Snowstorms and extreme cold
Just as virtually all
heat waves worldwide are worsened by climate change, “nearly every instance of extreme cold across the world has decreased in likelihood,” according to the WWA. While the organization has run attribution studies on “a few” heavy snowfall events, it has either found no link to climate change or has been unable to state a conclusion confidently. On the other hand, the
loss of snow cover, permafrost, Arctic sea ice, and glaciers has a high-confidence link to human-caused climate change in the IPCC report.
Just because climate change makes extreme cold and snowstorms less likely does not mean they won’t happen.
Research published in Nature earlier this year suggests climate change could bring more snow to certain places, as extremely cold parts of the world warm to snow-friendly temperatures, and increased precipitation from a warmer atmosphere results in more flurries. Parts of Siberia and the northern Great Plains are even experiencing a deepening snowpack.
Did climate change do it? Probably not — though there are notable exceptions.
Earthquakes
An earthquake is usually caused by the release of energy when two tectonic plates suddenly slip past each other (though they can also be caused
by fossil fuel extraction). But before you dismiss earthquakes as having no connection to climate change, there is one place where there could be a link: water.
As Emily Pontecorvo
wrote for Heatmap this spring, “Changes in surface water, whether because of heavy rain, snow, or drought, could either increase or relieve stress on geologic faults, causing them to shift.” Admittedly, even if there is a relationship between climate change, water, and earthquakes, it appears to be small — so small that humans probably can’t feel any resulting quakes.
Did climate change do it? It’s highly unlikely.
Airplane turbulence
Earlier this year,
extreme turbulence on a Singapore-bound flight from London killed one person and injured at least 20 others. While such events remain rare — the U.S. National Transportation Safety Board recorded just 101 serious injuries caused by turbulence on millions of flights between 2013 and 2022 — extreme turbulence appears to be increasing, potentially because of climate change.
According to
one study, severe turbulence is up 55% between 1979 and 2020, seemingly due to an increase in wind shear at high altitudes caused by the temperature contrast between the equator and the North Pole. (This relationship is a little bit complicated, but essentially, at higher altitudes, the temperature over the pole has been declining due to rapid Arctic temperature changes even as it’s increased at the equator; lower in the troposphere, the opposite is happening). Other studies have similarly shown that doubling the concentration of carbon dioxide in the atmosphere could increase moderate-to-severe turbulence by as much as 127%.
Data, however, is limited and fairly subjective, leading to some skepticism in the scientific community and
inaccurate dismissals by climate-change deniers. As with many complex weather phenomena, our understanding of how climate change interacts with turbulence will likely grow in the coming years as the field of research develops.
Did climate change do it? Potentially in some cases, but there is still much to learn about the connection between the two.
Dust and sand storms
Desertification differs from drought in that it describes a decline in soil fertility, water, and plant life to the point of total “land degradation.” (In contrast, land can become productive again after a drought.) Like other compound disasters, desertification results from natural processes, climatic conditions, and land management practices such as grazing and deforestation.
According to the Intergovernmental Science-Policy Platform on Biodiversity and Ecosystem Services, land degradation is “almost always” the result of these “multiple interacting causes,” and the warming climate certainly isn’t helping. Heat stress can kill off vegetation, making landscapes more prone to desertification, as well as drive aridification.
In the resulting drylands — which comprise about 46% of global land area — you can expect dust storms (also known as
haboobs), and sand storms resulting from the wind kicking up loose soils. While there have always been sand storms, one study suggests that climate change is one of the critical drivers of global annual dust emissions increasing by 25% between the late 19th century and today.
However, “climate change impacts on dust and sand storm activity remain a critical gap,”
writes the IPCC, and more research is desperately needed to address this. By the UN’s estimate, dust storms were associated with the deaths of 402,000 people in 2005. As many as 951 million people, mainly in South Asia, Central Asia, West Africa, and East Asia, could be vulnerable to the impacts of desertification if climate change continues.
Did climate change do it? It was potentially a factor, but we have lots more to learn.
Locust swarms
Are locust swarms technically “weather”? Not really. But so long as we’re on the topic of weather events of Biblical proportions, locust swarms might as well be addressed, too.
And the answer may surprise you: Climate appears to be a driver of locust swarms, which threaten food security and exacerbate famines throughout Africa, the Middle East, and South Asia. Locusts prefer “arid areas punched by
extreme rainfall,” according to
one study that looked at the connection between swarms and climate change, and while much of that pattern is fixed in the natural El Niño–Southern Oscillation cycle, a warming climate will also “lead to widespread increases in locust outbreaks with emerging hotspots in west central Asia.” In particular, the research found that in a low-emissions scenario, locust habitat could increase by 5%, while in a high-emissions scenario, it could increase by 13% to 25% between 2065 and 2100.
Did climate change do it? It’d likely be tricky to attribute any one locust swarm to climate change, but as with many other natural phenomena, climate likely plays a compounding factor.






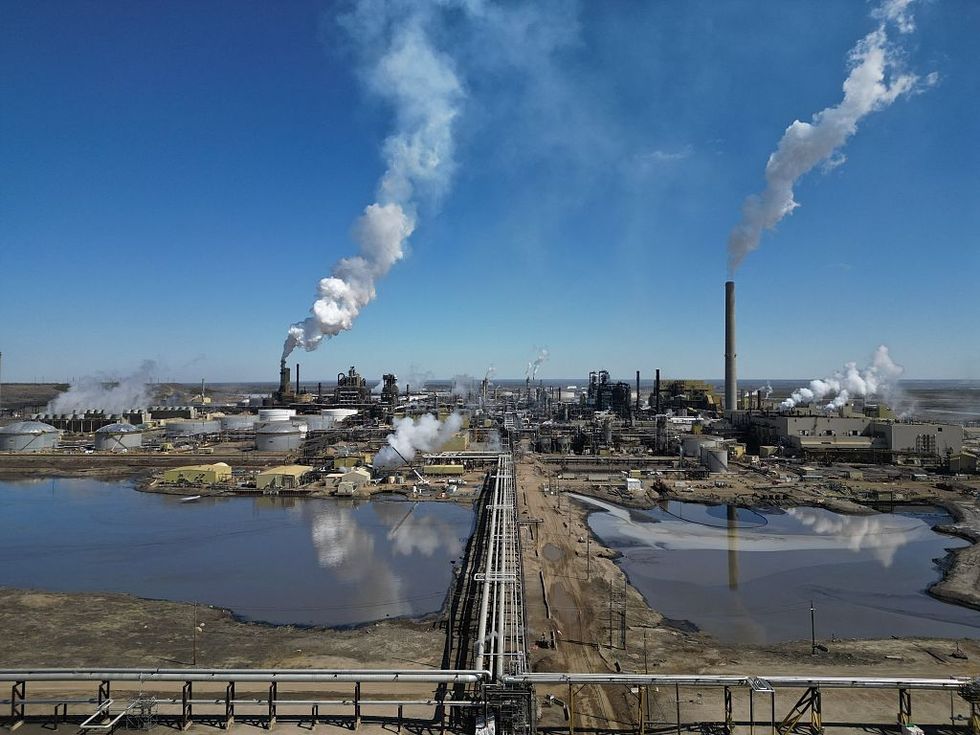 The Syncrude refinery at Mildred Lake in Alberta. Daphné LEMELIN / AFP via Getty Images