According to legend, the ghost of Lucy Addison still roams the halls of her namesake middle school in Roanoke, Virginia. She’s particularly fond of the basement, where the art and technology rooms are.
So when Brian Kreppeneck got a few thermal cameras for a summer program he was running this year, he knew exactly how he was going to teach his students how to use them: with a ghost hunt. He took them downstairs to the auditorium, shut off the lights, and had them train the cameras on things like the air-conditioning vents, a digital clock blinking in one corner, and the empty auditorium stage.
“And wouldn't you know it, as we're looking at the auditorium stage, a little mouse ran across the auditorium,” Kreppeneck, a science teacher at the school, told me. “They screamed and ran out, and that’s how they learned to use the thermal cameras.”
The cameras had a use beyond ghost-hunting and scaring schoolchildren (and mice): The students were going to use them to measure temperatures in and around their school. Over the course of a week, they pointed the cameras at all kinds of things in the world around them, from basketball courts baking in the sun to the shady ground underneath trees. They also clipped sensors to their shoes, which measured ambient temperatures as the kids went about their days. But that was just the beginning.
Get one great climate story in your inbox every day:
“We wanted to develop a curriculum where students learn both about the problem of urban heat, and then also are able to connect that with potential solutions that come from urban planning,” said Theodore Lim, assistant professor of urban affairs and planning at Virginia Tech and the designer of the summer program. “We want them to feel like there are things that [they] could do in [their] own neighborhoods to help mitigate some of those temperatures.”
Urban heat is a longstanding, intractable problem. Study after study has shown that cities are noticeably hotter than surrounding rural areas; this is called the Urban Heat Island effect. Many studies have also shown that the hottest parts of most cities tend to be the areas that house lower-income communities and communities of color, thanks to a dearth of vegetation, tightly packed buildings, and an overabundance of construction materials that radiate heat like concrete. Richer neighborhoods, meanwhile, tend to be lusher, with more space between buildings and, often, building materials like wood or brick that do a better job of dissipating heat.
But understanding just how the built environment affects heat is pretty hard. Meteorologists and weather apps tend to draw data from sensors at airports, which can’t give us any insight into the contours of heat within specific neighborhoods. The numbers we see on our phones often don’t reflect the temperatures we feel; a neighborhood by a river or a park, for example, would be much cooler than a neighborhood with high concentrations of concrete and asphalt, yet residents in both places would see the same temperature in their apps or on TV.
After a week of collecting data with another teacher, the middle-schoolers came back to Kreppeneck’s classroom to figure out what all the numbers had to say. Put together, the data from the thermal cameras and the shoe sensors created something few of us get to see: a personalized look at how the built world around them shaped the way heat worked in their lives. As Lim and Kreppeneck expected, the temperatures the kids experienced were often higher than the temperatures measured by the sensors at a nearby airport, sometimes by as much as 30 degrees Fahrenheit:
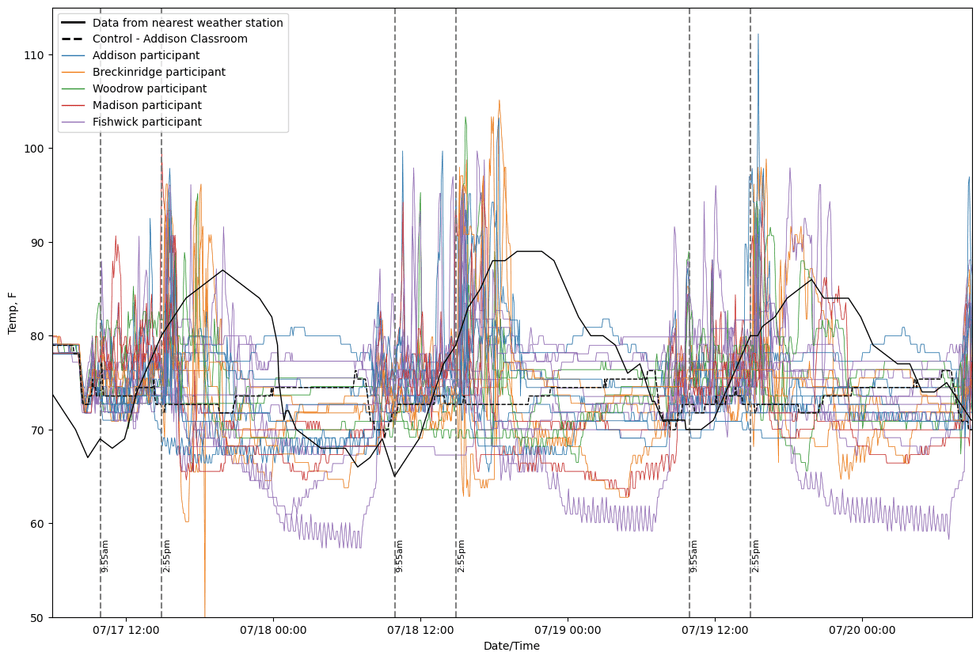
 Temperatures collected by sensors on students’ sneakers compared to temperature recorded at a nearby weather station. Courtesy Theodore Lim
Each colored line represents the data from a student at one of the five schools that participated, while the black line represents the temperature reported by the weather station at a nearby airport. If we follow a few of the blue lines, which represent students from Addison middle school — the one with the ghost — we see some of their personal temperatures spiking high above the black line. This could be for a few reasons: maybe they’re playing basketball on a concrete court, or eating lunch outside, or walking around a neighborhood with few trees.
But on each day, when the black line is at its peak, we see almost all of the students’ temperatures dip far below it. That was when the kids were cooling off indoors, often in air-conditioned buildings. As day turns to night, we see temperatures at the weather station dip below what some of the kids experienced indoors. By the next morning, as the kids start going about their days, their lines spike above the weather station again.
“Before they did this activity, if you asked one of these middle school kids if humans can control the temperature outside, they’d say no way,” Lim said. “But then they start to make these correlations: Humans make decisions about where to plant trees, or where to build parking lots, or what color different surfaces should be. And so we kind of do control the outdoor temperature.”
This kind of realization also shifts heat away from being a personal issue that can be solved by, say, drinking water or cranking the air conditioner, to a systemic one. There’s something kind of freeing about this: Lim said that instead of being ashamed that their families might not be able to afford air conditioning, the students came to recognize that their neighborhoods were historically hotter because of decisions made by other people. Northeast and Southeast Roanoke, for example, both saw higher temperatures than the Northwest and Southwest quadrants, and the entire city was significantly hotter than the rest of Roanoke County:
 Temperatures recorded in each quadrant over the course of the summer program. The bars show the range, while the boxes are the average. Courtesy Theodore Lim.
Armed with their temperature data, the students spent the second week of their summer program in Kreppeneck’s class learning about urban planning and mapping out ways their own neighborhoods could be redesigned to mitigate heat.
“As science teachers, we’ve always struggled to make the connection between science in the classroom and home,” Kreppeneck told me. “There’s always been some sort of a wall there, where the kids just think science takes place in the classroom. But giving them a real-world project made these concepts transcend the classroom.”
Kreppeneck also talked to his students about activism and advocating for change. This was the idea of Virginia Tech’s Lim; activism gives the kids a sense of agency over their built environment, and it also encourages them to start conversations with the adults in their lives who previously might not have paid much attention to climate change, whether due to a lack of information or the impression that it didn’t impact them. But climate change continues to push global temperatures higher — this September was the hottest on record — and the effect of climate change on heat is becoming increasingly harder to ignore. Creating policy to deal with those changes, however, is a difficult task.
“In Roanoke, as is probably the case in many cities, there's kind of a lot of contention between the government and some of these more vulnerable communities because of the history of urban renewal,” Lim said.
As Martha Park writes in a beautiful illustrated history for Bloomberg, northeast Roanoke was a thriving home for black and immigrant residents prior to urban renewal, a policy James Baldwin once called “negro removal.” Then, in 1955, the city declared the area “blighted,” seized the entire neighborhood through eminent domain, burned the buildings to the ground, and even exhumed nearly a thousand bodies from the local cemetery, dumping them in a mass grave outside town. Today, the area is mostly pavement and industrial parks.
“There’s a lot of mistrust on both sides,” Lim told me. “I’ve found that using youth-based community science is a relatively uncontroversial way of getting at some issues that actually do have very deep systemic causes.”
This was the third year Lim ran his program in Roanoke. In earlier years, Lim ran the program by himself at just one of the schools; this summer’s group, consisting of 130 students from all five Roanoke middle schools over the course of six weeks, was by far the largest, and Kreppeneck and another teacher took over most of the day-to-day. Going forward, Lim hopes it’ll turn into something more than a middle-school summer program; community leaders are talking about putting together a climate action plan for the city, and he’s exploring the possibility of creating programs at local high schools and churches that build on the middle school curriculum. The idea is to get the message about heat, and the solutions for it, out into the community in as many ways as possible.
Kreppeneck’s already planning on incorporating urban heat into his syllabus for the spring semester, expanding the two-week summer program into something that the students can engage with on a deeper level.
“My hope is that the kids will start talking about it, and start taking ownership,” Kreppeneck said. “Watching the looks on their faces, watching how the wheels started turning as to how they would change their neighborhood, it was very rewarding. If they believe in something, they can make change. It starts with them.”
Read more about heat:
A Guide to the Hottest Measurements in Temperature


 Temperatures collected by sensors on students’ sneakers compared to temperature recorded at a nearby weather station. Courtesy Theodore Lim
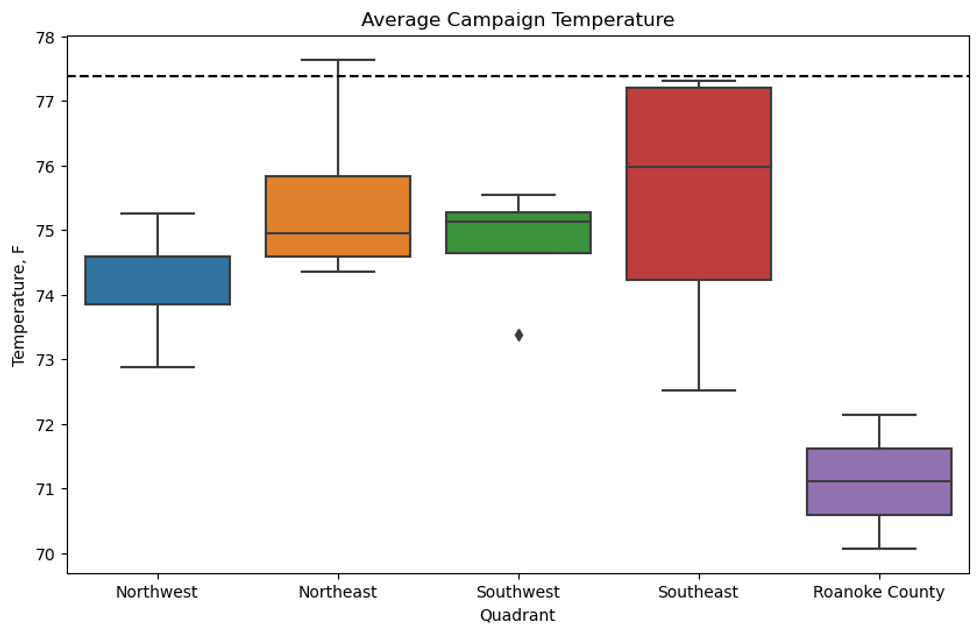 Temperatures recorded in each quadrant over the course of the summer program. The bars show the range, while the boxes are the average. Courtesy Theodore Lim.

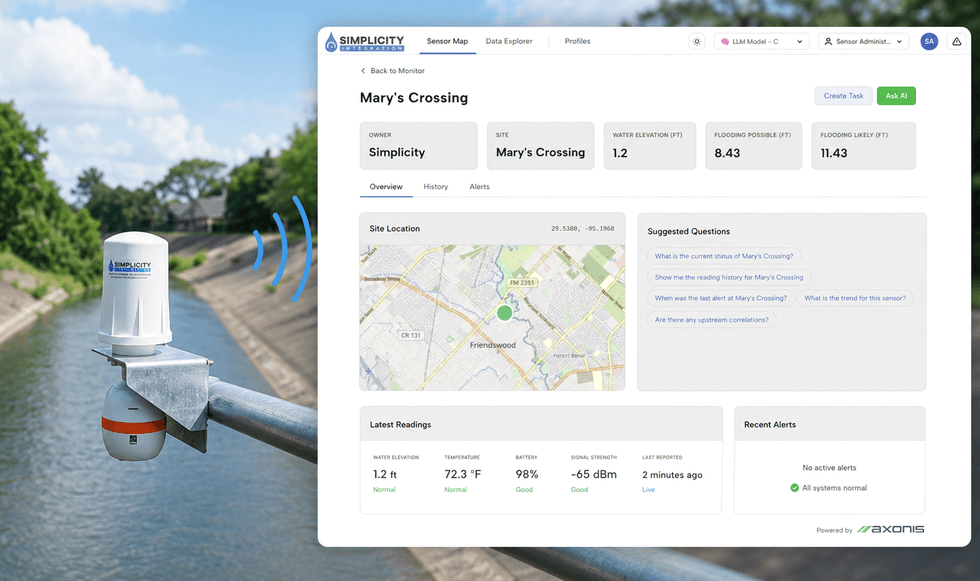 Axonis/Simplicity
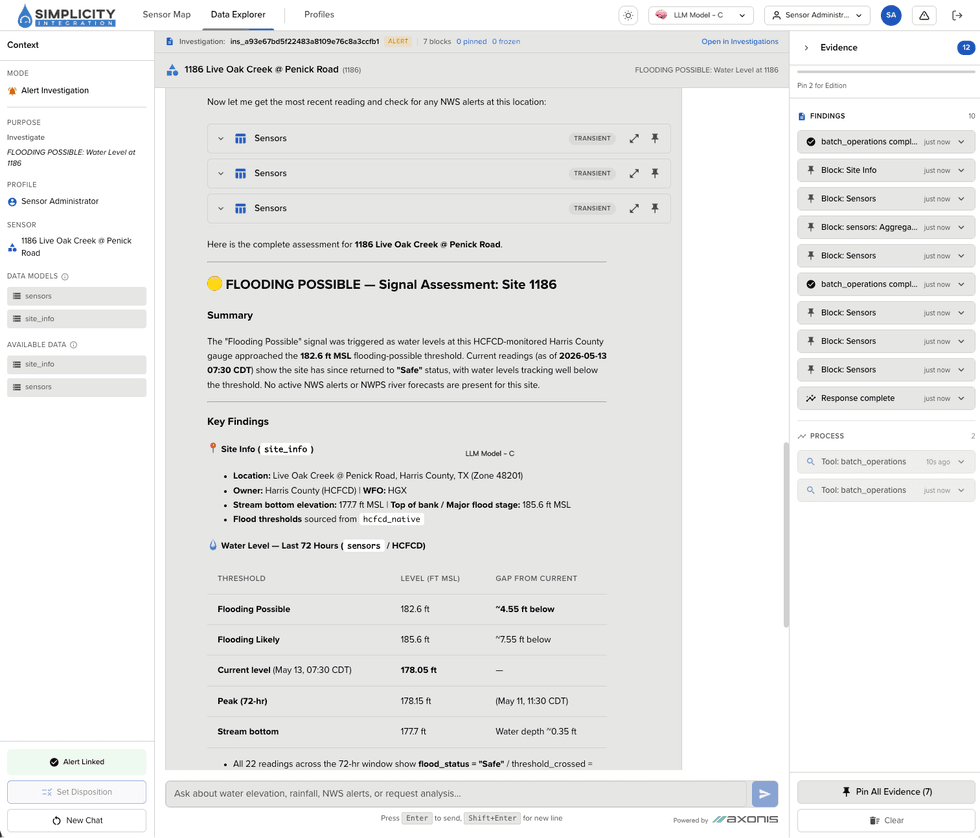 Simplicity


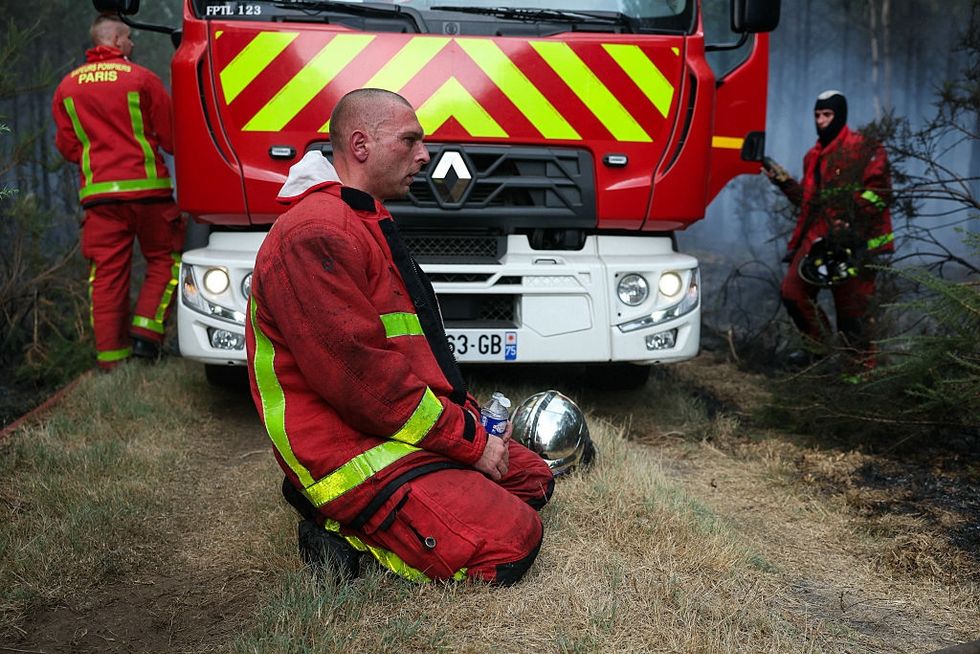 French firefighters near Bordeaux on Sunday. ALAIN JOCARD / AFP via Getty Images